

Key Insights
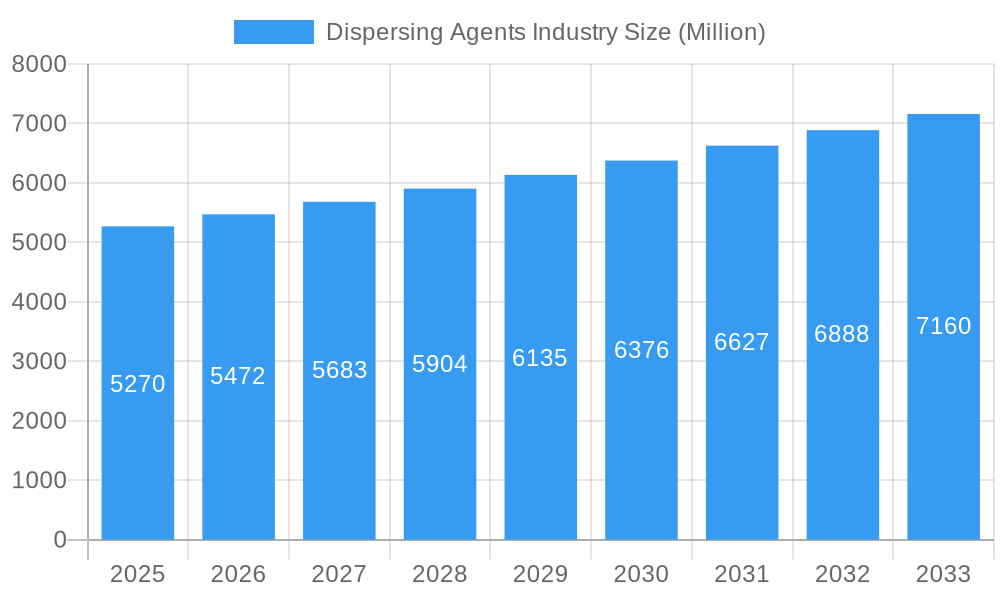
The global dispersing agents market, valued at $5.27 billion in 2025, is projected to experience robust growth, exhibiting a Compound Annual Growth Rate (CAGR) exceeding 3.50% from 2025 to 2033. This expansion is driven by increasing demand across diverse end-use industries. The paints and coatings sector remains a significant consumer, leveraging dispersing agents to enhance pigment dispersion and improve film quality. The construction industry’s burgeoning infrastructure projects further fuel market growth, requiring efficient and effective dispersing agents in concrete and other building materials. The oil and gas industry utilizes these agents in drilling fluids and other applications, contributing to market demand. Furthermore, the growing pulp and paper industry, along with the textile and pharmaceutical sectors, are key drivers, demanding specialized dispersing agents tailored to their specific needs. The rising adoption of waterborne dispersing agents, driven by environmental concerns and stricter regulations, is a notable trend. However, fluctuating raw material prices and potential supply chain disruptions pose challenges to market growth. The market is segmented by formation type (waterborne, oil-borne, solvent-borne) and end-user industry (paints and coatings, oil and gas, construction, pulp and paper, textile, and others including pharmaceuticals, agriculture, and detergents). Competition is intense, with key players such as BASF SE, Evonik Industries AG, and Clariant actively innovating and expanding their product portfolios to cater to evolving market needs and emerging applications.
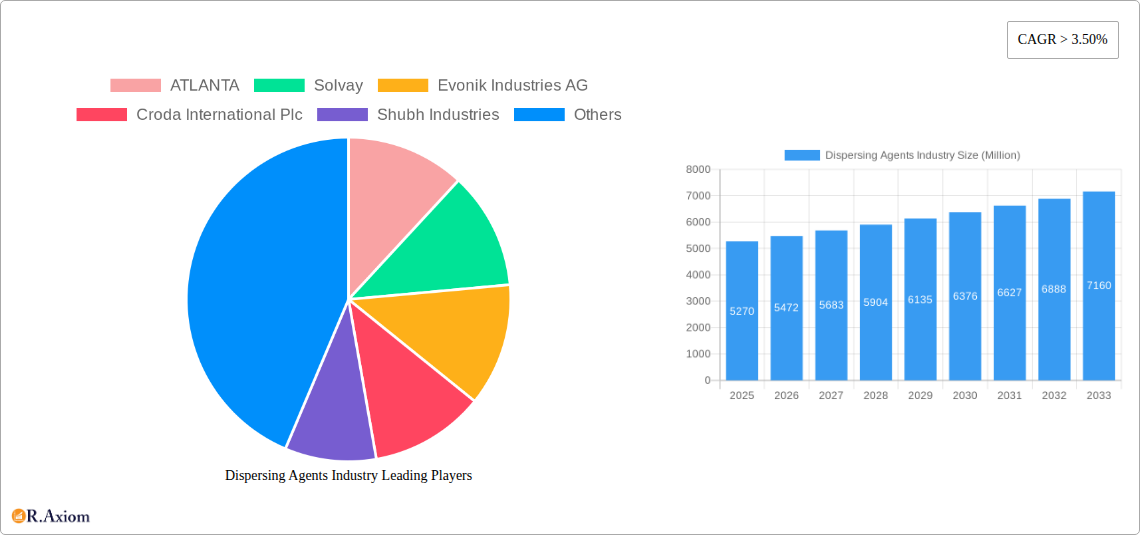
Dispersing Agents Industry Market Size (In Billion)
The forecast period (2025-2033) anticipates continued growth, influenced by factors such as increasing industrialization, particularly in developing economies, and the ongoing demand for high-performance materials across various sectors. Regional variations in market share are expected, with North America and Asia Pacific likely to dominate due to strong industrial activity and substantial infrastructure development. However, Europe and other regions will also contribute significantly to market expansion, driven by growing demand from specific niche applications and regional regulatory changes. Strategic partnerships, mergers and acquisitions, and continuous research and development will further shape the competitive landscape and drive innovation within the dispersing agents market.
Dispersing Agents Industry Company Market Share
Dispersing Agents Industry Market Report: 2019-2033
This comprehensive report provides a detailed analysis of the global dispersing agents market, offering invaluable insights for industry stakeholders, investors, and market researchers. Covering the period from 2019 to 2033, with a focus on 2025, this report meticulously examines market dynamics, growth drivers, challenges, and future opportunities. The report leverages extensive data analysis and forecasts, incorporating key developments and trends to offer actionable strategic recommendations.
Dispersing Agents Industry Market Concentration & Innovation
The dispersing agents market exhibits a moderately concentrated landscape, with several multinational corporations holding significant market share. While precise market share data for individual players fluctuates, key players like BASF SE, Evonik Industries AG, and Clariant collectively account for a substantial portion (estimated at xx%) of the global market. The industry is characterized by continuous innovation driven by the need for enhanced performance, sustainability, and cost-effectiveness. Regulatory pressures, particularly regarding environmental concerns, are increasingly influencing product development.
- Innovation Drivers: Demand for high-performance dispersants in diverse applications (e.g., advanced coatings, sustainable materials) fuels innovation in areas like bio-based dispersants and improved dispersion efficiency.
- Regulatory Frameworks: Stringent environmental regulations (e.g., VOC emission limits) necessitate the development of eco-friendly dispersants, shaping market trends.
- Product Substitutes: While direct substitutes are limited, advancements in alternative technologies (e.g., nanomaterials) pose indirect competition.
- End-User Trends: Growth in construction, automotive, and electronics industries drives demand for specialized dispersing agents with tailored properties.
- M&A Activities: The industry has witnessed several mergers and acquisitions (M&A) in recent years, with deal values ranging from xx Million to xx Million. These activities reflect the strategic importance of consolidating market share and gaining access to new technologies.
Dispersing Agents Industry Industry Trends & Insights
The global dispersing agents market is experiencing robust growth, projected to reach xx Million by 2033, exhibiting a Compound Annual Growth Rate (CAGR) of xx% during the forecast period (2025-2033). This growth is primarily propelled by increasing demand from diverse end-use industries, particularly paints and coatings, where the market penetration of high-performance dispersants is expanding rapidly. Technological advancements, such as the development of bio-based and high-efficiency dispersants, further fuel market expansion. Consumer preferences for eco-friendly and sustainable products are driving the adoption of biodegradable dispersants. Intense competition among major players leads to continuous product innovation and price optimization, influencing market dynamics.
Dominant Markets & Segments in Dispersing Agents Industry
The Paints and Coatings segment dominates the dispersing agents market, accounting for the largest share (estimated at xx%) due to its extensive application in various coatings formulations. Geographically, Asia-Pacific is the leading region, driven by robust economic growth and expanding construction and manufacturing sectors. The Waterborne segment also holds a significant market share due to its environmental benefits and wide applicability in various industries.
Key Drivers (Paints & Coatings): Growing infrastructure development, increasing demand for high-quality coatings, rising automotive production.
Key Drivers (Asia-Pacific): Rapid urbanization, industrialization, and growing consumer spending.
Dominance Analysis (Waterborne): Growing environmental concerns, stringent regulations, and inherent advantages in terms of ease of handling and safety contribute to the dominance of waterborne dispersing agents.
End-User Industry Segmentation:
- Paints and Coatings: Largest market segment driven by construction and automotive industries.
- Oil and Gas: Demand for specialized dispersants in drilling fluids and other applications.
- Construction: Use in cement, concrete, and other construction materials.
- Pulp and Paper: Essential for improving paper quality and efficiency.
- Textile: Used in dyeing and finishing processes.
- Other End-User Industries: Pharmaceuticals, agriculture, and detergents.
Formation Type Segmentation:
- Waterborne: Largest segment due to its environmental benefits.
- Oil-borne: Used in specific applications requiring oil-based formulations.
- Solvent-borne: Used in niche applications with specific requirements.
Dispersing Agents Industry Product Developments
Recent product innovations focus on sustainability, improved performance, and cost-effectiveness. Key trends include the development of bio-based dispersants, high-efficiency dispersants offering reduced dosage rates, and specialized dispersants for specific applications (e.g., high-viscosity pigments). These advancements cater to the evolving needs of various industries, offering enhanced performance and reduced environmental impact, thus creating a competitive advantage for manufacturers.
Report Scope & Segmentation Analysis
This report segments the dispersing agents market by end-user industry (Paints and Coatings, Oil and Gas, Construction, Pulp and Paper, Textile, Other) and formation type (Waterborne, Oil-borne, Solvent-borne). Each segment's growth projection, market size (in Millions), and competitive landscape are analyzed. For example, the Paints and Coatings segment is projected to grow at a CAGR of xx% during the forecast period, while the waterborne segment is expected to maintain its market leadership due to environmental regulations and demand for sustainable products. Competitive dynamics within each segment are analyzed based on factors such as product differentiation, pricing strategies, and technological advancements.
Key Drivers of Dispersing Agents Industry Growth
Several factors drive the growth of the dispersing agents industry: increasing demand from end-use industries such as paints and coatings, advancements in dispersant technology leading to improved performance and sustainability, stringent environmental regulations promoting the adoption of eco-friendly dispersants, and the growing construction and infrastructure sectors globally. Government initiatives promoting sustainable development further contribute to market growth.
Challenges in the Dispersing Agents Industry Sector
The dispersing agents industry faces challenges including fluctuating raw material prices, stringent environmental regulations requiring substantial investments in R&D for eco-friendly products, and intense competition from established and emerging players. Supply chain disruptions due to geopolitical factors or natural disasters could also impact the industry's growth trajectory. The overall impact of these challenges on profitability could be quantified at xx% reduction in margins, for example.
Emerging Opportunities in Dispersing Agents Industry
Emerging opportunities lie in the development of bio-based and high-performance dispersants for niche applications. Growing demand for sustainable and environmentally friendly products presents a significant opportunity for manufacturers to introduce innovative, eco-friendly dispersants. Expanding into new markets, especially in developing economies with growing infrastructure projects, presents substantial growth potential.
Leading Players in the Dispersing Agents Industry Market
- ATLANTA
- Solvay
- Evonik Industries AG
- Croda International Plc
- Shubh Industries
- King Industries Inc
- Kemipex
- Ashland
- BASF SE
- Arkema Group
- ELEMENTS PLC
- Rudolf GmbH
- NICCA CHEMICAL CO LTD
- The Lubrizol Corporation
- CLARIANT
- UNIQCHEM
Key Developments in Dispersing Agents Industry Industry
- June 2022: CLARIANT launched its first universal polymeric dispersing agent for high-quality pigment preparations, expanding its product portfolio and addressing the demand for versatile dispersants in water-based paint systems.
- July 2022: Evonik Industries AG launched TEGO Dispers 658, a readily biodegradable dispersing additive, enhancing the sustainability profile of pigment and colored coatings production.
Strategic Outlook for Dispersing Agents Industry Market
The future of the dispersing agents market appears promising, driven by sustained growth in end-use industries and continuous technological advancements. The focus on sustainability and the development of eco-friendly products will continue to shape market dynamics. Expanding into niche applications and exploring new markets will be crucial for achieving continued growth and profitability. The market's potential is substantial, especially in emerging economies, suggesting significant opportunities for growth and investment in the coming years.
Dispersing Agents Industry Segmentation
-
1. Formation Type
- 1.1. Waterborne
- 1.2. Oil-borne
- 1.3. Solvent-borne
-
2. End-user Industry
- 2.1. Paints and Coatings
- 2.2. Oil and Gas
- 2.3. Construction
- 2.4. Pulp and Paper
- 2.5. Textile
- 2.6. Others
Dispersing Agents Industry Segmentation By Geography
-
1. Asia Pacific
- 1.1. China
- 1.2. India
- 1.3. Japan
- 1.4. South Korea
- 1.5. Indonesia
- 1.6. Malaysia
- 1.7. Thailand
- 1.8. Vietnam
- 1.9. Rest of Asia Pacific
-
2. North America
- 2.1. United States
- 2.2. Canada
- 2.3. Mexico
-
3. Europe
- 3.1. Germany
- 3.2. United Kingdom
- 3.3. Italy
- 3.4. France
- 3.5. Spain
- 3.6. Russia
- 3.7. NORDIC Countries
- 3.8. Rest of Europe
-
4. South America
- 4.1. Brazil
- 4.2. Argentina
- 4.3. Colombia
- 4.4. Rest of South America
-
5. Middle East and Africa
- 5.1. Saudi Arabia
- 5.2. South Africa
- 5.3. Qatar
- 5.4. UAE
- 5.5. Egypt
- 5.6. Nigeria
- 5.7. Rest of Middle East and Africa
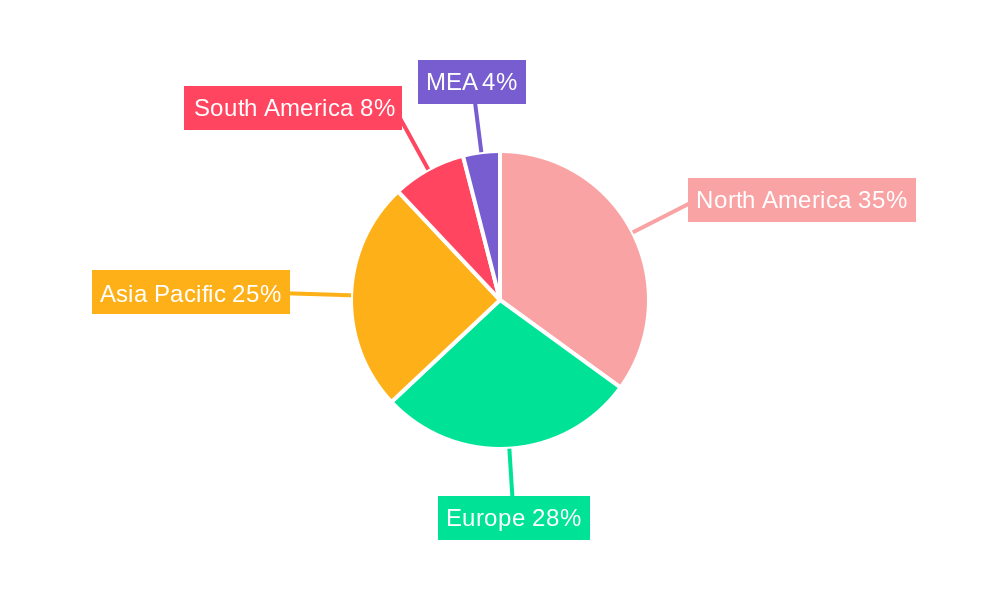
Dispersing Agents Industry Regional Market Share
Geographic Coverage of Dispersing Agents Industry
Dispersing Agents Industry REPORT HIGHLIGHTS
| Aspects | Details |
|---|---|
| Study Period | 2020-2034 |
| Base Year | 2025 |
| Estimated Year | 2026 |
| Forecast Period | 2026-2034 |
| Historical Period | 2020-2025 |
| Growth Rate | CAGR of > 3.50% from 2020-2034 |
| Segmentation |
|
Table of Contents
- 1. Introduction
- 1.1. Research Scope
- 1.2. Market Segmentation
- 1.3. Research Objective
- 1.4. Definitions and Assumptions
- 2. Executive Summary
- 2.1. Market Snapshot
- 3. Market Dynamics
- 3.1. Market Drivers
- 3.2. Market Restrains
- 3.3. Market Trends
- 3.4. Market Opportunities
- 4. Market Factor Analysis
- 4.1. Porters Five Forces
- 4.1.1. Bargaining Power of Suppliers
- 4.1.2. Bargaining Power of Buyers
- 4.1.3. Threat of New Entrants
- 4.1.4. Threat of Substitutes
- 4.1.5. Competitive Rivalry
- 4.2. PESTEL analysis
- 4.3. BCG Analysis
- 4.3.1. Stars (High Growth, High Market Share)
- 4.3.2. Cash Cows (Low Growth, High Market Share)
- 4.3.3. Question Mark (High Growth, Low Market Share)
- 4.3.4. Dogs (Low Growth, Low Market Share)
- 4.4. Ansoff Matrix Analysis
- 4.5. Supply Chain Analysis
- 4.6. Regulatory Landscape
- 4.7. Current Market Potential and Opportunity Assessment (TAM–SAM–SOM Framework)
- 4.8. RAX Analyst Note
- 4.1. Porters Five Forces
- 5. Market Analysis, Insights and Forecast 2021-2033
- 5.1. Market Analysis, Insights and Forecast - by Formation Type
- 5.1.1. Waterborne
- 5.1.2. Oil-borne
- 5.1.3. Solvent-borne
- 5.2. Market Analysis, Insights and Forecast - by End-user Industry
- 5.2.1. Paints and Coatings
- 5.2.2. Oil and Gas
- 5.2.3. Construction
- 5.2.4. Pulp and Paper
- 5.2.5. Textile
- 5.2.6. Others
- 5.3. Market Analysis, Insights and Forecast - by Region
- 5.3.1. Asia Pacific
- 5.3.2. North America
- 5.3.3. Europe
- 5.3.4. South America
- 5.3.5. Middle East and Africa
- 5.1. Market Analysis, Insights and Forecast - by Formation Type
- 6. Global Dispersing Agents Industry Analysis, Insights and Forecast, 2021-2033
- 6.1. Market Analysis, Insights and Forecast - by Formation Type
- 6.1.1. Waterborne
- 6.1.2. Oil-borne
- 6.1.3. Solvent-borne
- 6.2. Market Analysis, Insights and Forecast - by End-user Industry
- 6.2.1. Paints and Coatings
- 6.2.2. Oil and Gas
- 6.2.3. Construction
- 6.2.4. Pulp and Paper
- 6.2.5. Textile
- 6.2.6. Others
- 6.1. Market Analysis, Insights and Forecast - by Formation Type
- 7. Asia Pacific Dispersing Agents Industry Analysis, Insights and Forecast, 2020-2032
- 7.1. Market Analysis, Insights and Forecast - by Formation Type
- 7.1.1. Waterborne
- 7.1.2. Oil-borne
- 7.1.3. Solvent-borne
- 7.2. Market Analysis, Insights and Forecast - by End-user Industry
- 7.2.1. Paints and Coatings
- 7.2.2. Oil and Gas
- 7.2.3. Construction
- 7.2.4. Pulp and Paper
- 7.2.5. Textile
- 7.2.6. Others
- 7.1. Market Analysis, Insights and Forecast - by Formation Type
- 8. North America Dispersing Agents Industry Analysis, Insights and Forecast, 2020-2032
- 8.1. Market Analysis, Insights and Forecast - by Formation Type
- 8.1.1. Waterborne
- 8.1.2. Oil-borne
- 8.1.3. Solvent-borne
- 8.2. Market Analysis, Insights and Forecast - by End-user Industry
- 8.2.1. Paints and Coatings
- 8.2.2. Oil and Gas
- 8.2.3. Construction
- 8.2.4. Pulp and Paper
- 8.2.5. Textile
- 8.2.6. Others
- 8.1. Market Analysis, Insights and Forecast - by Formation Type
- 9. Europe Dispersing Agents Industry Analysis, Insights and Forecast, 2020-2032
- 9.1. Market Analysis, Insights and Forecast - by Formation Type
- 9.1.1. Waterborne
- 9.1.2. Oil-borne
- 9.1.3. Solvent-borne
- 9.2. Market Analysis, Insights and Forecast - by End-user Industry
- 9.2.1. Paints and Coatings
- 9.2.2. Oil and Gas
- 9.2.3. Construction
- 9.2.4. Pulp and Paper
- 9.2.5. Textile
- 9.2.6. Others
- 9.1. Market Analysis, Insights and Forecast - by Formation Type
- 10. South America Dispersing Agents Industry Analysis, Insights and Forecast, 2020-2032
- 10.1. Market Analysis, Insights and Forecast - by Formation Type
- 10.1.1. Waterborne
- 10.1.2. Oil-borne
- 10.1.3. Solvent-borne
- 10.2. Market Analysis, Insights and Forecast - by End-user Industry
- 10.2.1. Paints and Coatings
- 10.2.2. Oil and Gas
- 10.2.3. Construction
- 10.2.4. Pulp and Paper
- 10.2.5. Textile
- 10.2.6. Others
- 10.1. Market Analysis, Insights and Forecast - by Formation Type
- 11. Middle East and Africa Dispersing Agents Industry Analysis, Insights and Forecast, 2020-2032
- 11.1. Market Analysis, Insights and Forecast - by Formation Type
- 11.1.1. Waterborne
- 11.1.2. Oil-borne
- 11.1.3. Solvent-borne
- 11.2. Market Analysis, Insights and Forecast - by End-user Industry
- 11.2.1. Paints and Coatings
- 11.2.2. Oil and Gas
- 11.2.3. Construction
- 11.2.4. Pulp and Paper
- 11.2.5. Textile
- 11.2.6. Others
- 11.1. Market Analysis, Insights and Forecast - by Formation Type
- 12. Competitive Analysis
- 12.1. Company Profiles
- 12.1.1 ATLANTA
- 12.1.1.1. Company Overview
- 12.1.1.2. Products
- 12.1.1.3. Company Financials
- 12.1.1.4. SWOT Analysis
- 12.1.2 Solvay
- 12.1.2.1. Company Overview
- 12.1.2.2. Products
- 12.1.2.3. Company Financials
- 12.1.2.4. SWOT Analysis
- 12.1.3 Evonik Industries AG
- 12.1.3.1. Company Overview
- 12.1.3.2. Products
- 12.1.3.3. Company Financials
- 12.1.3.4. SWOT Analysis
- 12.1.4 Croda International Plc
- 12.1.4.1. Company Overview
- 12.1.4.2. Products
- 12.1.4.3. Company Financials
- 12.1.4.4. SWOT Analysis
- 12.1.5 Shubh Industries
- 12.1.5.1. Company Overview
- 12.1.5.2. Products
- 12.1.5.3. Company Financials
- 12.1.5.4. SWOT Analysis
- 12.1.6 King Industries Inc
- 12.1.6.1. Company Overview
- 12.1.6.2. Products
- 12.1.6.3. Company Financials
- 12.1.6.4. SWOT Analysis
- 12.1.7 Kemipex
- 12.1.7.1. Company Overview
- 12.1.7.2. Products
- 12.1.7.3. Company Financials
- 12.1.7.4. SWOT Analysis
- 12.1.8 Ashland
- 12.1.8.1. Company Overview
- 12.1.8.2. Products
- 12.1.8.3. Company Financials
- 12.1.8.4. SWOT Analysis
- 12.1.9 BASF SE
- 12.1.9.1. Company Overview
- 12.1.9.2. Products
- 12.1.9.3. Company Financials
- 12.1.9.4. SWOT Analysis
- 12.1.10 Arkema Group
- 12.1.10.1. Company Overview
- 12.1.10.2. Products
- 12.1.10.3. Company Financials
- 12.1.10.4. SWOT Analysis
- 12.1.11 ELEMENTS PLC
- 12.1.11.1. Company Overview
- 12.1.11.2. Products
- 12.1.11.3. Company Financials
- 12.1.11.4. SWOT Analysis
- 12.1.12 Rudolf GmbH
- 12.1.12.1. Company Overview
- 12.1.12.2. Products
- 12.1.12.3. Company Financials
- 12.1.12.4. SWOT Analysis
- 12.1.13 NICCA CHEMICAL CO LTD
- 12.1.13.1. Company Overview
- 12.1.13.2. Products
- 12.1.13.3. Company Financials
- 12.1.13.4. SWOT Analysis
- 12.1.14 The Lubrizol Corporation
- 12.1.14.1. Company Overview
- 12.1.14.2. Products
- 12.1.14.3. Company Financials
- 12.1.14.4. SWOT Analysis
- 12.1.15 CLARIANT
- 12.1.15.1. Company Overview
- 12.1.15.2. Products
- 12.1.15.3. Company Financials
- 12.1.15.4. SWOT Analysis
- 12.1.16 UNIQCHEM
- 12.1.16.1. Company Overview
- 12.1.16.2. Products
- 12.1.16.3. Company Financials
- 12.1.16.4. SWOT Analysis
- 12.1.1 ATLANTA
- 12.2. Market Entropy
- 12.2.1 Company's Key Areas Served
- 12.2.2 Recent Developments
- 12.3. Company Market Share Analysis 2025
- 12.3.1 Top 5 Companies Market Share Analysis
- 12.3.2 Top 3 Companies Market Share Analysis
- 12.4. List of Potential Customers
- 13. Research Methodology
List of Figures
- Figure 1: Global Dispersing Agents Industry Revenue Breakdown (Million, %) by Region 2025 & 2033
- Figure 2: Global Dispersing Agents Industry Volume Breakdown (K Tons, %) by Region 2025 & 2033
- Figure 3: Asia Pacific Dispersing Agents Industry Revenue (Million), by Formation Type 2025 & 2033
- Figure 4: Asia Pacific Dispersing Agents Industry Volume (K Tons), by Formation Type 2025 & 2033
- Figure 5: Asia Pacific Dispersing Agents Industry Revenue Share (%), by Formation Type 2025 & 2033
- Figure 6: Asia Pacific Dispersing Agents Industry Volume Share (%), by Formation Type 2025 & 2033
- Figure 7: Asia Pacific Dispersing Agents Industry Revenue (Million), by End-user Industry 2025 & 2033
- Figure 8: Asia Pacific Dispersing Agents Industry Volume (K Tons), by End-user Industry 2025 & 2033
- Figure 9: Asia Pacific Dispersing Agents Industry Revenue Share (%), by End-user Industry 2025 & 2033
- Figure 10: Asia Pacific Dispersing Agents Industry Volume Share (%), by End-user Industry 2025 & 2033
- Figure 11: Asia Pacific Dispersing Agents Industry Revenue (Million), by Country 2025 & 2033
- Figure 12: Asia Pacific Dispersing Agents Industry Volume (K Tons), by Country 2025 & 2033
- Figure 13: Asia Pacific Dispersing Agents Industry Revenue Share (%), by Country 2025 & 2033
- Figure 14: Asia Pacific Dispersing Agents Industry Volume Share (%), by Country 2025 & 2033
- Figure 15: North America Dispersing Agents Industry Revenue (Million), by Formation Type 2025 & 2033
- Figure 16: North America Dispersing Agents Industry Volume (K Tons), by Formation Type 2025 & 2033
- Figure 17: North America Dispersing Agents Industry Revenue Share (%), by Formation Type 2025 & 2033
- Figure 18: North America Dispersing Agents Industry Volume Share (%), by Formation Type 2025 & 2033
- Figure 19: North America Dispersing Agents Industry Revenue (Million), by End-user Industry 2025 & 2033
- Figure 20: North America Dispersing Agents Industry Volume (K Tons), by End-user Industry 2025 & 2033
- Figure 21: North America Dispersing Agents Industry Revenue Share (%), by End-user Industry 2025 & 2033
- Figure 22: North America Dispersing Agents Industry Volume Share (%), by End-user Industry 2025 & 2033
- Figure 23: North America Dispersing Agents Industry Revenue (Million), by Country 2025 & 2033
- Figure 24: North America Dispersing Agents Industry Volume (K Tons), by Country 2025 & 2033
- Figure 25: North America Dispersing Agents Industry Revenue Share (%), by Country 2025 & 2033
- Figure 26: North America Dispersing Agents Industry Volume Share (%), by Country 2025 & 2033
- Figure 27: Europe Dispersing Agents Industry Revenue (Million), by Formation Type 2025 & 2033
- Figure 28: Europe Dispersing Agents Industry Volume (K Tons), by Formation Type 2025 & 2033
- Figure 29: Europe Dispersing Agents Industry Revenue Share (%), by Formation Type 2025 & 2033
- Figure 30: Europe Dispersing Agents Industry Volume Share (%), by Formation Type 2025 & 2033
- Figure 31: Europe Dispersing Agents Industry Revenue (Million), by End-user Industry 2025 & 2033
- Figure 32: Europe Dispersing Agents Industry Volume (K Tons), by End-user Industry 2025 & 2033
- Figure 33: Europe Dispersing Agents Industry Revenue Share (%), by End-user Industry 2025 & 2033
- Figure 34: Europe Dispersing Agents Industry Volume Share (%), by End-user Industry 2025 & 2033
- Figure 35: Europe Dispersing Agents Industry Revenue (Million), by Country 2025 & 2033
- Figure 36: Europe Dispersing Agents Industry Volume (K Tons), by Country 2025 & 2033
- Figure 37: Europe Dispersing Agents Industry Revenue Share (%), by Country 2025 & 2033
- Figure 38: Europe Dispersing Agents Industry Volume Share (%), by Country 2025 & 2033
- Figure 39: South America Dispersing Agents Industry Revenue (Million), by Formation Type 2025 & 2033
- Figure 40: South America Dispersing Agents Industry Volume (K Tons), by Formation Type 2025 & 2033
- Figure 41: South America Dispersing Agents Industry Revenue Share (%), by Formation Type 2025 & 2033
- Figure 42: South America Dispersing Agents Industry Volume Share (%), by Formation Type 2025 & 2033
- Figure 43: South America Dispersing Agents Industry Revenue (Million), by End-user Industry 2025 & 2033
- Figure 44: South America Dispersing Agents Industry Volume (K Tons), by End-user Industry 2025 & 2033
- Figure 45: South America Dispersing Agents Industry Revenue Share (%), by End-user Industry 2025 & 2033
- Figure 46: South America Dispersing Agents Industry Volume Share (%), by End-user Industry 2025 & 2033
- Figure 47: South America Dispersing Agents Industry Revenue (Million), by Country 2025 & 2033
- Figure 48: South America Dispersing Agents Industry Volume (K Tons), by Country 2025 & 2033
- Figure 49: South America Dispersing Agents Industry Revenue Share (%), by Country 2025 & 2033
- Figure 50: South America Dispersing Agents Industry Volume Share (%), by Country 2025 & 2033
- Figure 51: Middle East and Africa Dispersing Agents Industry Revenue (Million), by Formation Type 2025 & 2033
- Figure 52: Middle East and Africa Dispersing Agents Industry Volume (K Tons), by Formation Type 2025 & 2033
- Figure 53: Middle East and Africa Dispersing Agents Industry Revenue Share (%), by Formation Type 2025 & 2033
- Figure 54: Middle East and Africa Dispersing Agents Industry Volume Share (%), by Formation Type 2025 & 2033
- Figure 55: Middle East and Africa Dispersing Agents Industry Revenue (Million), by End-user Industry 2025 & 2033
- Figure 56: Middle East and Africa Dispersing Agents Industry Volume (K Tons), by End-user Industry 2025 & 2033
- Figure 57: Middle East and Africa Dispersing Agents Industry Revenue Share (%), by End-user Industry 2025 & 2033
- Figure 58: Middle East and Africa Dispersing Agents Industry Volume Share (%), by End-user Industry 2025 & 2033
- Figure 59: Middle East and Africa Dispersing Agents Industry Revenue (Million), by Country 2025 & 2033
- Figure 60: Middle East and Africa Dispersing Agents Industry Volume (K Tons), by Country 2025 & 2033
- Figure 61: Middle East and Africa Dispersing Agents Industry Revenue Share (%), by Country 2025 & 2033
- Figure 62: Middle East and Africa Dispersing Agents Industry Volume Share (%), by Country 2025 & 2033
List of Tables
- Table 1: Global Dispersing Agents Industry Revenue Million Forecast, by Formation Type 2020 & 2033
- Table 2: Global Dispersing Agents Industry Volume K Tons Forecast, by Formation Type 2020 & 2033
- Table 3: Global Dispersing Agents Industry Revenue Million Forecast, by End-user Industry 2020 & 2033
- Table 4: Global Dispersing Agents Industry Volume K Tons Forecast, by End-user Industry 2020 & 2033
- Table 5: Global Dispersing Agents Industry Revenue Million Forecast, by Region 2020 & 2033
- Table 6: Global Dispersing Agents Industry Volume K Tons Forecast, by Region 2020 & 2033
- Table 7: Global Dispersing Agents Industry Revenue Million Forecast, by Formation Type 2020 & 2033
- Table 8: Global Dispersing Agents Industry Volume K Tons Forecast, by Formation Type 2020 & 2033
- Table 9: Global Dispersing Agents Industry Revenue Million Forecast, by End-user Industry 2020 & 2033
- Table 10: Global Dispersing Agents Industry Volume K Tons Forecast, by End-user Industry 2020 & 2033
- Table 11: Global Dispersing Agents Industry Revenue Million Forecast, by Country 2020 & 2033
- Table 12: Global Dispersing Agents Industry Volume K Tons Forecast, by Country 2020 & 2033
- Table 13: China Dispersing Agents Industry Revenue (Million) Forecast, by Application 2020 & 2033
- Table 14: China Dispersing Agents Industry Volume (K Tons) Forecast, by Application 2020 & 2033
- Table 15: India Dispersing Agents Industry Revenue (Million) Forecast, by Application 2020 & 2033
- Table 16: India Dispersing Agents Industry Volume (K Tons) Forecast, by Application 2020 & 2033
- Table 17: Japan Dispersing Agents Industry Revenue (Million) Forecast, by Application 2020 & 2033
- Table 18: Japan Dispersing Agents Industry Volume (K Tons) Forecast, by Application 2020 & 2033
- Table 19: South Korea Dispersing Agents Industry Revenue (Million) Forecast, by Application 2020 & 2033
- Table 20: South Korea Dispersing Agents Industry Volume (K Tons) Forecast, by Application 2020 & 2033
- Table 21: Indonesia Dispersing Agents Industry Revenue (Million) Forecast, by Application 2020 & 2033
- Table 22: Indonesia Dispersing Agents Industry Volume (K Tons) Forecast, by Application 2020 & 2033
- Table 23: Malaysia Dispersing Agents Industry Revenue (Million) Forecast, by Application 2020 & 2033
- Table 24: Malaysia Dispersing Agents Industry Volume (K Tons) Forecast, by Application 2020 & 2033
- Table 25: Thailand Dispersing Agents Industry Revenue (Million) Forecast, by Application 2020 & 2033
- Table 26: Thailand Dispersing Agents Industry Volume (K Tons) Forecast, by Application 2020 & 2033
- Table 27: Vietnam Dispersing Agents Industry Revenue (Million) Forecast, by Application 2020 & 2033
- Table 28: Vietnam Dispersing Agents Industry Volume (K Tons) Forecast, by Application 2020 & 2033
- Table 29: Rest of Asia Pacific Dispersing Agents Industry Revenue (Million) Forecast, by Application 2020 & 2033
- Table 30: Rest of Asia Pacific Dispersing Agents Industry Volume (K Tons) Forecast, by Application 2020 & 2033
- Table 31: Global Dispersing Agents Industry Revenue Million Forecast, by Formation Type 2020 & 2033
- Table 32: Global Dispersing Agents Industry Volume K Tons Forecast, by Formation Type 2020 & 2033
- Table 33: Global Dispersing Agents Industry Revenue Million Forecast, by End-user Industry 2020 & 2033
- Table 34: Global Dispersing Agents Industry Volume K Tons Forecast, by End-user Industry 2020 & 2033
- Table 35: Global Dispersing Agents Industry Revenue Million Forecast, by Country 2020 & 2033
- Table 36: Global Dispersing Agents Industry Volume K Tons Forecast, by Country 2020 & 2033
- Table 37: United States Dispersing Agents Industry Revenue (Million) Forecast, by Application 2020 & 2033
- Table 38: United States Dispersing Agents Industry Volume (K Tons) Forecast, by Application 2020 & 2033
- Table 39: Canada Dispersing Agents Industry Revenue (Million) Forecast, by Application 2020 & 2033
- Table 40: Canada Dispersing Agents Industry Volume (K Tons) Forecast, by Application 2020 & 2033
- Table 41: Mexico Dispersing Agents Industry Revenue (Million) Forecast, by Application 2020 & 2033
- Table 42: Mexico Dispersing Agents Industry Volume (K Tons) Forecast, by Application 2020 & 2033
- Table 43: Global Dispersing Agents Industry Revenue Million Forecast, by Formation Type 2020 & 2033
- Table 44: Global Dispersing Agents Industry Volume K Tons Forecast, by Formation Type 2020 & 2033
- Table 45: Global Dispersing Agents Industry Revenue Million Forecast, by End-user Industry 2020 & 2033
- Table 46: Global Dispersing Agents Industry Volume K Tons Forecast, by End-user Industry 2020 & 2033
- Table 47: Global Dispersing Agents Industry Revenue Million Forecast, by Country 2020 & 2033
- Table 48: Global Dispersing Agents Industry Volume K Tons Forecast, by Country 2020 & 2033
- Table 49: Germany Dispersing Agents Industry Revenue (Million) Forecast, by Application 2020 & 2033
- Table 50: Germany Dispersing Agents Industry Volume (K Tons) Forecast, by Application 2020 & 2033
- Table 51: United Kingdom Dispersing Agents Industry Revenue (Million) Forecast, by Application 2020 & 2033
- Table 52: United Kingdom Dispersing Agents Industry Volume (K Tons) Forecast, by Application 2020 & 2033
- Table 53: Italy Dispersing Agents Industry Revenue (Million) Forecast, by Application 2020 & 2033
- Table 54: Italy Dispersing Agents Industry Volume (K Tons) Forecast, by Application 2020 & 2033
- Table 55: France Dispersing Agents Industry Revenue (Million) Forecast, by Application 2020 & 2033
- Table 56: France Dispersing Agents Industry Volume (K Tons) Forecast, by Application 2020 & 2033
- Table 57: Spain Dispersing Agents Industry Revenue (Million) Forecast, by Application 2020 & 2033
- Table 58: Spain Dispersing Agents Industry Volume (K Tons) Forecast, by Application 2020 & 2033
- Table 59: Russia Dispersing Agents Industry Revenue (Million) Forecast, by Application 2020 & 2033
- Table 60: Russia Dispersing Agents Industry Volume (K Tons) Forecast, by Application 2020 & 2033
- Table 61: NORDIC Countries Dispersing Agents Industry Revenue (Million) Forecast, by Application 2020 & 2033
- Table 62: NORDIC Countries Dispersing Agents Industry Volume (K Tons) Forecast, by Application 2020 & 2033
- Table 63: Rest of Europe Dispersing Agents Industry Revenue (Million) Forecast, by Application 2020 & 2033
- Table 64: Rest of Europe Dispersing Agents Industry Volume (K Tons) Forecast, by Application 2020 & 2033
- Table 65: Global Dispersing Agents Industry Revenue Million Forecast, by Formation Type 2020 & 2033
- Table 66: Global Dispersing Agents Industry Volume K Tons Forecast, by Formation Type 2020 & 2033
- Table 67: Global Dispersing Agents Industry Revenue Million Forecast, by End-user Industry 2020 & 2033
- Table 68: Global Dispersing Agents Industry Volume K Tons Forecast, by End-user Industry 2020 & 2033
- Table 69: Global Dispersing Agents Industry Revenue Million Forecast, by Country 2020 & 2033
- Table 70: Global Dispersing Agents Industry Volume K Tons Forecast, by Country 2020 & 2033
- Table 71: Brazil Dispersing Agents Industry Revenue (Million) Forecast, by Application 2020 & 2033
- Table 72: Brazil Dispersing Agents Industry Volume (K Tons) Forecast, by Application 2020 & 2033
- Table 73: Argentina Dispersing Agents Industry Revenue (Million) Forecast, by Application 2020 & 2033
- Table 74: Argentina Dispersing Agents Industry Volume (K Tons) Forecast, by Application 2020 & 2033
- Table 75: Colombia Dispersing Agents Industry Revenue (Million) Forecast, by Application 2020 & 2033
- Table 76: Colombia Dispersing Agents Industry Volume (K Tons) Forecast, by Application 2020 & 2033
- Table 77: Rest of South America Dispersing Agents Industry Revenue (Million) Forecast, by Application 2020 & 2033
- Table 78: Rest of South America Dispersing Agents Industry Volume (K Tons) Forecast, by Application 2020 & 2033
- Table 79: Global Dispersing Agents Industry Revenue Million Forecast, by Formation Type 2020 & 2033
- Table 80: Global Dispersing Agents Industry Volume K Tons Forecast, by Formation Type 2020 & 2033
- Table 81: Global Dispersing Agents Industry Revenue Million Forecast, by End-user Industry 2020 & 2033
- Table 82: Global Dispersing Agents Industry Volume K Tons Forecast, by End-user Industry 2020 & 2033
- Table 83: Global Dispersing Agents Industry Revenue Million Forecast, by Country 2020 & 2033
- Table 84: Global Dispersing Agents Industry Volume K Tons Forecast, by Country 2020 & 2033
- Table 85: Saudi Arabia Dispersing Agents Industry Revenue (Million) Forecast, by Application 2020 & 2033
- Table 86: Saudi Arabia Dispersing Agents Industry Volume (K Tons) Forecast, by Application 2020 & 2033
- Table 87: South Africa Dispersing Agents Industry Revenue (Million) Forecast, by Application 2020 & 2033
- Table 88: South Africa Dispersing Agents Industry Volume (K Tons) Forecast, by Application 2020 & 2033
- Table 89: Qatar Dispersing Agents Industry Revenue (Million) Forecast, by Application 2020 & 2033
- Table 90: Qatar Dispersing Agents Industry Volume (K Tons) Forecast, by Application 2020 & 2033
- Table 91: UAE Dispersing Agents Industry Revenue (Million) Forecast, by Application 2020 & 2033
- Table 92: UAE Dispersing Agents Industry Volume (K Tons) Forecast, by Application 2020 & 2033
- Table 93: Egypt Dispersing Agents Industry Revenue (Million) Forecast, by Application 2020 & 2033
- Table 94: Egypt Dispersing Agents Industry Volume (K Tons) Forecast, by Application 2020 & 2033
- Table 95: Nigeria Dispersing Agents Industry Revenue (Million) Forecast, by Application 2020 & 2033
- Table 96: Nigeria Dispersing Agents Industry Volume (K Tons) Forecast, by Application 2020 & 2033
- Table 97: Rest of Middle East and Africa Dispersing Agents Industry Revenue (Million) Forecast, by Application 2020 & 2033
- Table 98: Rest of Middle East and Africa Dispersing Agents Industry Volume (K Tons) Forecast, by Application 2020 & 2033
Frequently Asked Questions
1. What is the projected Compound Annual Growth Rate (CAGR) of the Dispersing Agents Industry?
The projected CAGR is approximately > 3.50%.
2. Which companies are prominent players in the Dispersing Agents Industry?
Key companies in the market include ATLANTA, Solvay, Evonik Industries AG, Croda International Plc, Shubh Industries, King Industries Inc, Kemipex, Ashland, BASF SE, Arkema Group, ELEMENTS PLC, Rudolf GmbH, NICCA CHEMICAL CO LTD, The Lubrizol Corporation, CLARIANT, UNIQCHEM.
3. What are the main segments of the Dispersing Agents Industry?
The market segments include Formation Type, End-user Industry.
4. Can you provide details about the market size?
The market size is estimated to be USD 5.27 Million as of 2022.
5. What are some drivers contributing to market growth?
Increasing Demand from the Paints and Coatings Industry; The Increasing Oil Drilling and Exploration Activities; Other Drivers.
6. What are the notable trends driving market growth?
Increasing demand from the Paints and Coatings Industry.
7. Are there any restraints impacting market growth?
The Increasing Prices of Raw materials; Other Restraints.
8. Can you provide examples of recent developments in the market?
July 2022: Evonik Industries AG launched its new sustainable dispersing additive, TEGO Dispers 658. The dispersing agent was readily biodegradable and improved the sustainability of pigment and colored coatings production while at the same time offering formulators a similar high-performance profile.
9. What pricing options are available for accessing the report?
Pricing options include single-user, multi-user, and enterprise licenses priced at USD 4750, USD 5250, and USD 8750 respectively.
10. Is the market size provided in terms of value or volume?
The market size is provided in terms of value, measured in Million and volume, measured in K Tons.
11. Are there any specific market keywords associated with the report?
Yes, the market keyword associated with the report is "Dispersing Agents Industry," which aids in identifying and referencing the specific market segment covered.
12. How do I determine which pricing option suits my needs best?
The pricing options vary based on user requirements and access needs. Individual users may opt for single-user licenses, while businesses requiring broader access may choose multi-user or enterprise licenses for cost-effective access to the report.
13. Are there any additional resources or data provided in the Dispersing Agents Industry report?
While the report offers comprehensive insights, it's advisable to review the specific contents or supplementary materials provided to ascertain if additional resources or data are available.
14. How can I stay updated on further developments or reports in the Dispersing Agents Industry?
To stay informed about further developments, trends, and reports in the Dispersing Agents Industry, consider subscribing to industry newsletters, following relevant companies and organizations, or regularly checking reputable industry news sources and publications.
Methodology
Step 1 - Identification of Relevant Samples Size from Population Database


Step 2 - Approaches for Defining Global Market Size (Value, Volume* & Price*)

Note*: In applicable scenarios
Step 3 - Data Sources
Primary Research
- Web Analytics
- Survey Reports
- Research Institute
- Latest Research Reports
- Opinion Leaders
Secondary Research
- Annual Reports
- White Paper
- Latest Press Release
- Industry Association
- Paid Database
- Investor Presentations

Step 4 - Data Triangulation
Involves using different sources of information in order to increase the validity of a study
These sources are likely to be stakeholders in a program - participants, other researchers, program staff, other community members, and so on.
Then we put all data in single framework & apply various statistical tools to find out the dynamic on the market.
During the analysis stage, feedback from the stakeholder groups would be compared to determine areas of agreement as well as areas of divergence