
Key Insights
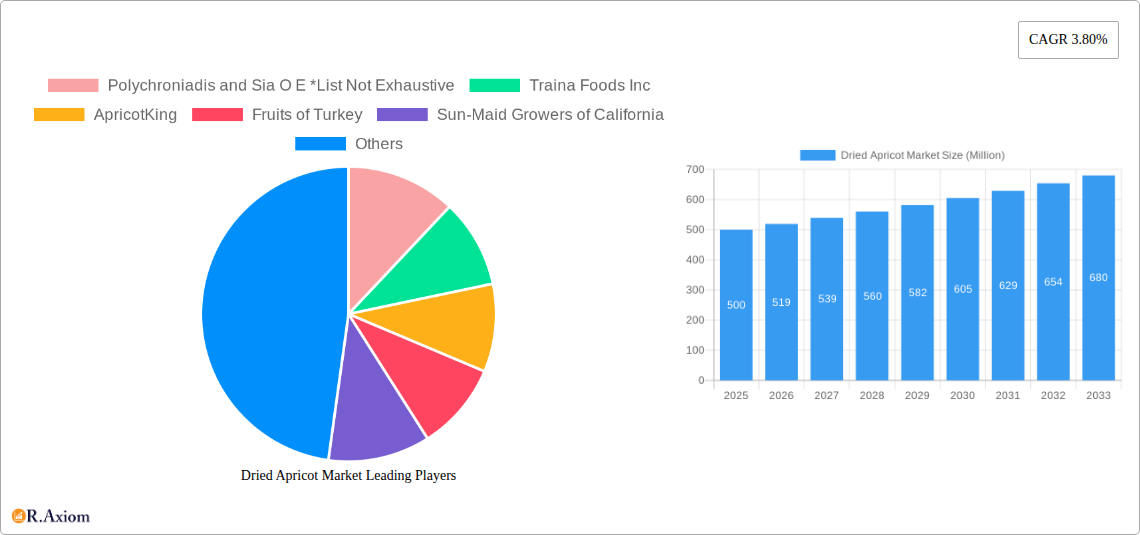
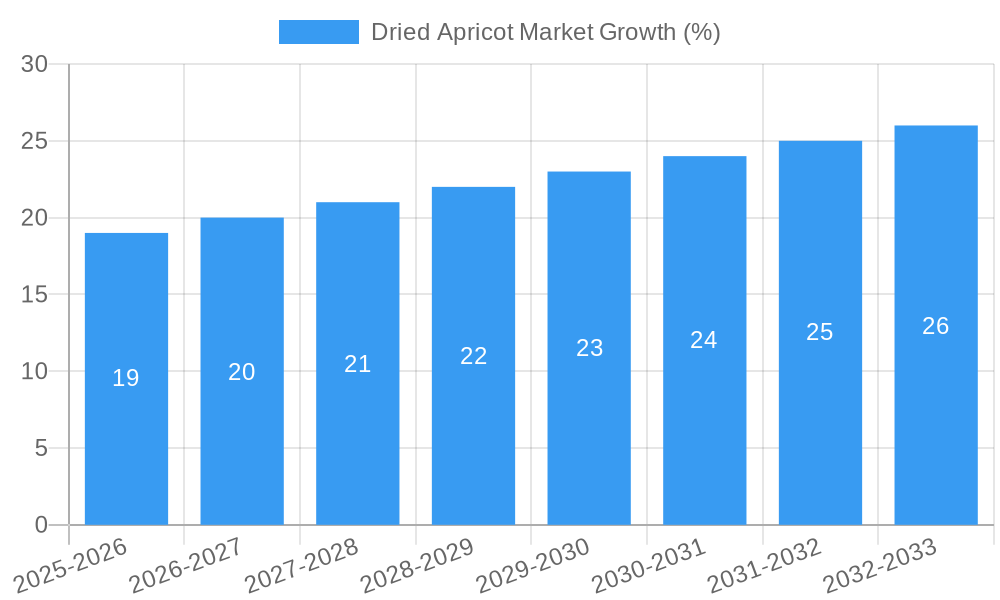
The global dried apricot market, valued at approximately $500 million in 2025, is projected to experience steady growth, exhibiting a compound annual growth rate (CAGR) of 3.80% from 2025 to 2033. This growth is fueled by several key drivers. The increasing consumer preference for convenient, healthy snacks contributes significantly, with dried apricots offering a naturally sweet and nutrient-rich alternative to processed foods. Growing awareness of the health benefits associated with apricots, including their high fiber content and antioxidant properties, further boosts demand. The expansion of the global health and wellness sector and the rise of functional foods also play a vital role. Furthermore, innovation in product formats, such as the introduction of flavored dried apricots and convenient packaging options (e.g., individual pouches), is driving market expansion across various distribution channels. The conventional segment currently dominates the market, but organic dried apricots are experiencing rapid growth driven by increasing health consciousness. Whole dried apricots retain the highest market share due to their perceived nutritional superiority, but diced and powdered forms are witnessing substantial gains as they cater to diverse applications in food processing and baking. Supermarkets and hypermarkets remain the primary distribution channels, but convenience stores and specialist retailers are increasingly becoming important avenues for sales, reflecting the evolving consumer shopping habits.
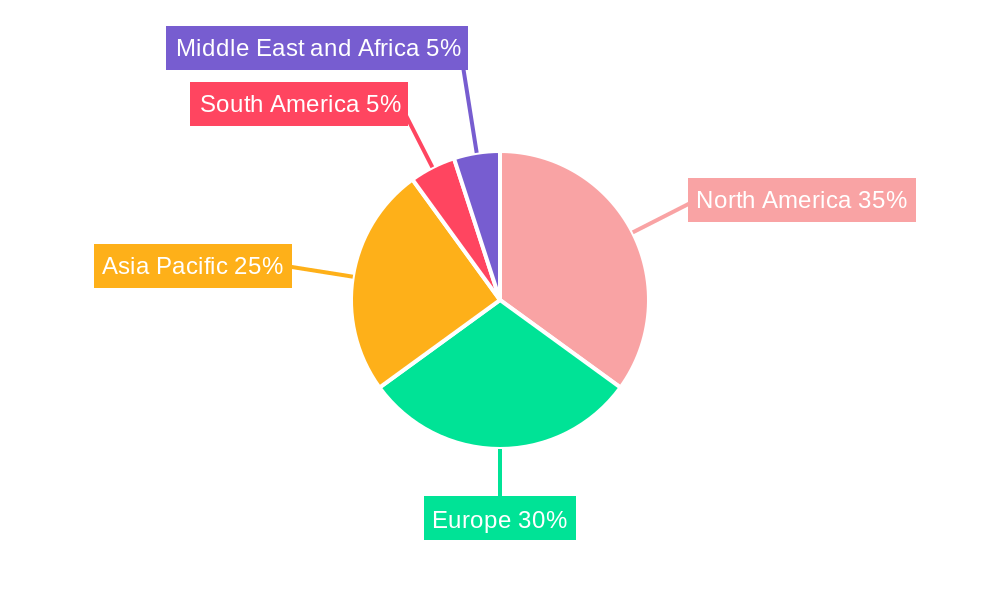
Market restraints include price fluctuations driven by factors like weather conditions and crop yields. Seasonal variations in supply can also impact market stability. Competition from other dried fruits and processed snacks presents another challenge. Nevertheless, the industry's overall outlook remains positive, driven by health-conscious consumers, product innovation, and the expansion of distribution networks. The North American and European regions currently represent significant market shares, but the Asia-Pacific region presents a lucrative growth opportunity, fueled by rising disposable incomes and changing dietary preferences. Companies are focusing on enhancing product quality, expanding their product lines, and focusing on sustainable sourcing practices to maintain a competitive edge in this dynamic market. The continued focus on health and wellness, coupled with product innovation, will be critical for continued growth in the dried apricot market.
Dried Apricot Market: A Comprehensive Report (2019-2033)
This comprehensive report provides an in-depth analysis of the global dried apricot market, covering the period from 2019 to 2033. It offers valuable insights into market dynamics, segmentation, competitive landscape, and future growth prospects, enabling stakeholders to make informed business decisions. The report utilizes data from the historical period (2019-2024), with 2025 serving as the base and estimated year, and projects the market's trajectory until 2033.
Dried Apricot Market Concentration & Innovation
This section analyzes the level of market concentration, identifying key players and their market share. It also explores the drivers of innovation within the industry, including technological advancements in processing and packaging. Regulatory frameworks impacting the dried apricot market are examined, along with the presence and impact of product substitutes. Furthermore, the report investigates end-user trends and their influence on market demand, as well as the impact of mergers and acquisitions (M&A) activity.
- Market Concentration: The market exhibits a moderately concentrated structure, with the top five players holding an estimated xx% market share in 2025. This concentration is influenced by factors such as economies of scale and brand recognition.
- Innovation Drivers: Technological advancements in drying techniques, improved packaging to enhance shelf life, and the development of value-added products (e.g., flavored dried apricots) are driving innovation.
- Regulatory Framework: Food safety regulations and labeling requirements significantly impact the industry. Compliance costs and stringent quality standards influence market dynamics.
- Product Substitutes: Other dried fruits, such as raisins and cranberries, compete with dried apricots, although dried apricots maintain a niche due to their unique flavor profile and nutritional benefits.
- End-User Trends: Growing consumer preference for healthy snacks and convenient food options fuels demand. The increasing awareness of the health benefits of apricots also contributes to market growth.
- M&A Activity: The number of M&A deals in the dried apricot market during the study period was xx, with a total deal value of approximately $xx Million. These activities have resulted in increased market consolidation and expansion of product portfolios.
Dried Apricot Market Industry Trends & Insights
This section delves into the key trends shaping the dried apricot market, including market growth drivers, technological disruptions, evolving consumer preferences, and the competitive landscape. It provides a comprehensive overview of the factors influencing market expansion and contraction. The analysis includes detailed discussion of CAGR and market penetration across various segments.
The dried apricot market is experiencing steady growth, driven by factors such as increasing health consciousness among consumers, rising disposable incomes in developing economies, and the growing popularity of dried fruits as a convenient and nutritious snack. Technological advancements in processing and packaging are also contributing to market expansion. Consumer preferences are shifting towards organic and value-added dried apricot products, resulting in increased demand for these specific segments. The competitive landscape is characterized by both large established players and smaller niche players, leading to a dynamic market environment. The CAGR for the dried apricot market during the forecast period (2025-2033) is projected to be xx%, with a market penetration rate of xx% by 2033.
Dominant Markets & Segments in Dried Apricot Market
This section identifies the leading regions, countries, and market segments within the dried apricot market. The analysis focuses on segment performance based on type (conventional, organic), form (whole, diced, powdered), and distribution channel (supermarkets/hypermarkets, convenience stores, specialist retailers, other channels). Key factors driving the dominance of particular segments are detailed.
- Leading Region/Country: [Name of leading region/country, e.g., North America] is the dominant market due to high consumption rates and strong demand for healthy snacks.
- Type: The conventional segment currently holds a larger market share, but the organic segment is experiencing faster growth due to increasing health awareness.
- Form: The whole and diced forms are the most popular, while the powdered segment is a niche market with specific applications in food processing.
- Distribution Channel: Supermarkets and hypermarkets constitute the primary distribution channel, offering wide reach and accessibility to consumers.
Key Drivers:
- Economic Policies: Favorable government policies promoting agricultural development and food processing contribute to market growth.
- Infrastructure: Efficient transportation and logistics networks facilitate the distribution of dried apricots to various markets.
Dried Apricot Market Product Developments
This section summarizes recent product innovations, applications, and competitive advantages within the dried apricot market. Emphasis is placed on technological trends and the successful integration of new products into the market. Improved drying techniques resulting in enhanced product quality and longer shelf life, combined with innovative packaging solutions, are key aspects of recent developments. The introduction of flavored and functional dried apricots further adds to the market's dynamism.
Report Scope & Segmentation Analysis
This report segments the dried apricot market based on type (conventional, organic), form (whole, diced, powdered), and distribution channel (supermarkets/hypermarkets, convenience stores, specialist retailers, other channels). Each segment’s growth projections, market sizes, and competitive dynamics are analyzed.
- Type (Conventional & Organic): The conventional segment currently dominates, but the organic segment is experiencing significant growth driven by health-conscious consumers.
- Form (Whole, Diced, Powdered): Whole and diced apricots are most prevalent, while powdered apricots cater to industrial applications.
- Distribution Channel (Supermarkets/Hypermarkets, Convenience Stores, Specialist Retailers, Other Channels): Supermarkets/hypermarkets hold the largest market share, while convenience stores and specialist retailers are also gaining importance.
Key Drivers of Dried Apricot Market Growth
The dried apricot market's growth is fueled by a combination of factors. The rising preference for healthy snacks and convenient food options drives demand. Improved processing and packaging technologies lead to better product quality and extended shelf life, increasing consumer appeal. Furthermore, favorable government policies supporting agriculture and food processing positively impact market expansion.
Challenges in the Dried Apricot Market Sector
Several challenges impact the dried apricot market. Fluctuations in raw material prices due to weather conditions can affect profitability. Stringent food safety regulations and quality standards add to operational costs. The competition from other dried fruits and snacks poses a constant threat.
Emerging Opportunities in Dried Apricot Market
The market presents significant opportunities. Expansion into new markets with growing consumer disposable incomes offers potential. The growing demand for functional foods and the development of value-added products with enhanced nutritional benefits present significant growth opportunities.
Leading Players in the Dried Apricot Market Market
- Polychroniadis and Sia O E
- Traina Foods Inc
- ApricotKing
- Fruits of Turkey
- Sun-Maid Growers of California
- Bergin Fruit and Nut Company
- Purcell Mountain Farms
Key Developments in Dried Apricot Market Industry
- 2022-06: Traina Foods Inc. launched a new line of organic dried apricots.
- 2023-03: A major merger occurred between two key players in the dried apricot market resulting in xx% increased market share. (Further details would be in the full report).
Strategic Outlook for Dried Apricot Market Market
The dried apricot market exhibits promising growth potential. The focus on healthy eating trends, combined with product innovation and expansion into new markets, will drive future expansion. The development of value-added products, catering to specific health needs and preferences, will further fuel market growth over the next decade.
Dried Apricot Market Segmentation
-
1. Type
- 1.1. Conventional
- 1.2. Organic
-
2. Form
- 2.1. Whole
- 2.2. Diced
- 2.3. Powdered
-
3. Distribution Channel
- 3.1. Supermarkets/Hypermarkets
- 3.2. Convenience Stores
- 3.3. Specialist Retailers
- 3.4. Other Channels
Dried Apricot Market Segmentation By Geography
-
1. North America
- 1.1. United States
- 1.2. Canada
- 1.3. Mexico
- 1.4. Rest of North America
-
2. Europe
- 2.1. Germany
- 2.2. United Kingdom
- 2.3. France
- 2.4. Spain
- 2.5. Russia
- 2.6. Italy
- 2.7. Rest of Europe
-
3. Asia Pacific
- 3.1. China
- 3.2. Japan
- 3.3. India
- 3.4. Australia
- 3.5. Rest of Asia Pacific
-
4. South America
- 4.1. Brazil
- 4.2. Argentina
- 4.3. Rest of South America
-
5. Middle East and Africa
- 5.1. Turkey
- 5.2. Saudi Arabia
- 5.3. South Africa
- 5.4. Rest of Middle East and Africa
Dried Apricot Market REPORT HIGHLIGHTS
| Aspects | Details |
|---|---|
| Study Period | 2019-2033 |
| Base Year | 2024 |
| Estimated Year | 2025 |
| Forecast Period | 2025-2033 |
| Historical Period | 2019-2024 |
| Growth Rate | CAGR of 3.80% from 2019-2033 |
| Segmentation |
|
Table of Contents
- 1. Introduction
- 1.1. Research Scope
- 1.2. Market Segmentation
- 1.3. Research Methodology
- 1.4. Definitions and Assumptions
- 2. Executive Summary
- 2.1. Introduction
- 3. Market Dynamics
- 3.1. Introduction
- 3.2. Market Drivers
- 3.2.1. Increasing application of Gelatin in healthcare and pharmaceutical sector
- 3.3. Market Restrains
- 3.3.1. Rising demand for clean label products
- 3.4. Market Trends
- 3.4.1. Increasing Demand for Organic Dried Apricots
- 4. Market Factor Analysis
- 4.1. Porters Five Forces
- 4.2. Supply/Value Chain
- 4.3. PESTEL analysis
- 4.4. Market Entropy
- 4.5. Patent/Trademark Analysis
- 5. Global Dried Apricot Market Analysis, Insights and Forecast, 2019-2031
- 5.1. Market Analysis, Insights and Forecast - by Type
- 5.1.1. Conventional
- 5.1.2. Organic
- 5.2. Market Analysis, Insights and Forecast - by Form
- 5.2.1. Whole
- 5.2.2. Diced
- 5.2.3. Powdered
- 5.3. Market Analysis, Insights and Forecast - by Distribution Channel
- 5.3.1. Supermarkets/Hypermarkets
- 5.3.2. Convenience Stores
- 5.3.3. Specialist Retailers
- 5.3.4. Other Channels
- 5.4. Market Analysis, Insights and Forecast - by Region
- 5.4.1. North America
- 5.4.2. Europe
- 5.4.3. Asia Pacific
- 5.4.4. South America
- 5.4.5. Middle East and Africa
- 5.1. Market Analysis, Insights and Forecast - by Type
- 6. North America Dried Apricot Market Analysis, Insights and Forecast, 2019-2031
- 6.1. Market Analysis, Insights and Forecast - by Type
- 6.1.1. Conventional
- 6.1.2. Organic
- 6.2. Market Analysis, Insights and Forecast - by Form
- 6.2.1. Whole
- 6.2.2. Diced
- 6.2.3. Powdered
- 6.3. Market Analysis, Insights and Forecast - by Distribution Channel
- 6.3.1. Supermarkets/Hypermarkets
- 6.3.2. Convenience Stores
- 6.3.3. Specialist Retailers
- 6.3.4. Other Channels
- 6.1. Market Analysis, Insights and Forecast - by Type
- 7. Europe Dried Apricot Market Analysis, Insights and Forecast, 2019-2031
- 7.1. Market Analysis, Insights and Forecast - by Type
- 7.1.1. Conventional
- 7.1.2. Organic
- 7.2. Market Analysis, Insights and Forecast - by Form
- 7.2.1. Whole
- 7.2.2. Diced
- 7.2.3. Powdered
- 7.3. Market Analysis, Insights and Forecast - by Distribution Channel
- 7.3.1. Supermarkets/Hypermarkets
- 7.3.2. Convenience Stores
- 7.3.3. Specialist Retailers
- 7.3.4. Other Channels
- 7.1. Market Analysis, Insights and Forecast - by Type
- 8. Asia Pacific Dried Apricot Market Analysis, Insights and Forecast, 2019-2031
- 8.1. Market Analysis, Insights and Forecast - by Type
- 8.1.1. Conventional
- 8.1.2. Organic
- 8.2. Market Analysis, Insights and Forecast - by Form
- 8.2.1. Whole
- 8.2.2. Diced
- 8.2.3. Powdered
- 8.3. Market Analysis, Insights and Forecast - by Distribution Channel
- 8.3.1. Supermarkets/Hypermarkets
- 8.3.2. Convenience Stores
- 8.3.3. Specialist Retailers
- 8.3.4. Other Channels
- 8.1. Market Analysis, Insights and Forecast - by Type
- 9. South America Dried Apricot Market Analysis, Insights and Forecast, 2019-2031
- 9.1. Market Analysis, Insights and Forecast - by Type
- 9.1.1. Conventional
- 9.1.2. Organic
- 9.2. Market Analysis, Insights and Forecast - by Form
- 9.2.1. Whole
- 9.2.2. Diced
- 9.2.3. Powdered
- 9.3. Market Analysis, Insights and Forecast - by Distribution Channel
- 9.3.1. Supermarkets/Hypermarkets
- 9.3.2. Convenience Stores
- 9.3.3. Specialist Retailers
- 9.3.4. Other Channels
- 9.1. Market Analysis, Insights and Forecast - by Type
- 10. Middle East and Africa Dried Apricot Market Analysis, Insights and Forecast, 2019-2031
- 10.1. Market Analysis, Insights and Forecast - by Type
- 10.1.1. Conventional
- 10.1.2. Organic
- 10.2. Market Analysis, Insights and Forecast - by Form
- 10.2.1. Whole
- 10.2.2. Diced
- 10.2.3. Powdered
- 10.3. Market Analysis, Insights and Forecast - by Distribution Channel
- 10.3.1. Supermarkets/Hypermarkets
- 10.3.2. Convenience Stores
- 10.3.3. Specialist Retailers
- 10.3.4. Other Channels
- 10.1. Market Analysis, Insights and Forecast - by Type
- 11. North America Dried Apricot Market Analysis, Insights and Forecast, 2019-2031
- 11.1. Market Analysis, Insights and Forecast - By Country/Sub-region
- 11.1.1 United States
- 11.1.2 Canada
- 11.1.3 Mexico
- 11.1.4 Rest of North America
- 12. Europe Dried Apricot Market Analysis, Insights and Forecast, 2019-2031
- 12.1. Market Analysis, Insights and Forecast - By Country/Sub-region
- 12.1.1 Germany
- 12.1.2 United Kingdom
- 12.1.3 France
- 12.1.4 Spain
- 12.1.5 Russia
- 12.1.6 Italy
- 12.1.7 Rest of Europe
- 13. Asia Pacific Dried Apricot Market Analysis, Insights and Forecast, 2019-2031
- 13.1. Market Analysis, Insights and Forecast - By Country/Sub-region
- 13.1.1 China
- 13.1.2 Japan
- 13.1.3 India
- 13.1.4 Australia
- 13.1.5 Rest of Asia Pacific
- 14. South America Dried Apricot Market Analysis, Insights and Forecast, 2019-2031
- 14.1. Market Analysis, Insights and Forecast - By Country/Sub-region
- 14.1.1 Brazil
- 14.1.2 Argentina
- 14.1.3 Rest of South America
- 15. Middle East and Africa Dried Apricot Market Analysis, Insights and Forecast, 2019-2031
- 15.1. Market Analysis, Insights and Forecast - By Country/Sub-region
- 15.1.1 Turkey
- 15.1.2 Saudi Arabia
- 15.1.3 South Africa
- 15.1.4 Rest of Middle East and Africa
- 16. Competitive Analysis
- 16.1. Global Market Share Analysis 2024
- 16.2. Company Profiles
- 16.2.1 Polychroniadis and Sia O E *List Not Exhaustive
- 16.2.1.1. Overview
- 16.2.1.2. Products
- 16.2.1.3. SWOT Analysis
- 16.2.1.4. Recent Developments
- 16.2.1.5. Financials (Based on Availability)
- 16.2.2 Traina Foods Inc
- 16.2.2.1. Overview
- 16.2.2.2. Products
- 16.2.2.3. SWOT Analysis
- 16.2.2.4. Recent Developments
- 16.2.2.5. Financials (Based on Availability)
- 16.2.3 ApricotKing
- 16.2.3.1. Overview
- 16.2.3.2. Products
- 16.2.3.3. SWOT Analysis
- 16.2.3.4. Recent Developments
- 16.2.3.5. Financials (Based on Availability)
- 16.2.4 Fruits of Turkey
- 16.2.4.1. Overview
- 16.2.4.2. Products
- 16.2.4.3. SWOT Analysis
- 16.2.4.4. Recent Developments
- 16.2.4.5. Financials (Based on Availability)
- 16.2.5 Sun-Maid Growers of California
- 16.2.5.1. Overview
- 16.2.5.2. Products
- 16.2.5.3. SWOT Analysis
- 16.2.5.4. Recent Developments
- 16.2.5.5. Financials (Based on Availability)
- 16.2.6 Bergin Fruit and Nut Company
- 16.2.6.1. Overview
- 16.2.6.2. Products
- 16.2.6.3. SWOT Analysis
- 16.2.6.4. Recent Developments
- 16.2.6.5. Financials (Based on Availability)
- 16.2.7 Purcell Mountain Farms
- 16.2.7.1. Overview
- 16.2.7.2. Products
- 16.2.7.3. SWOT Analysis
- 16.2.7.4. Recent Developments
- 16.2.7.5. Financials (Based on Availability)
- 16.2.1 Polychroniadis and Sia O E *List Not Exhaustive
List of Figures
- Figure 1: Global Dried Apricot Market Revenue Breakdown (Million, %) by Region 2024 & 2032
- Figure 2: Global Dried Apricot Market Volume Breakdown (K Units, %) by Region 2024 & 2032
- Figure 3: North America Dried Apricot Market Revenue (Million), by Country 2024 & 2032
- Figure 4: North America Dried Apricot Market Volume (K Units), by Country 2024 & 2032
- Figure 5: North America Dried Apricot Market Revenue Share (%), by Country 2024 & 2032
- Figure 6: North America Dried Apricot Market Volume Share (%), by Country 2024 & 2032
- Figure 7: Europe Dried Apricot Market Revenue (Million), by Country 2024 & 2032
- Figure 8: Europe Dried Apricot Market Volume (K Units), by Country 2024 & 2032
- Figure 9: Europe Dried Apricot Market Revenue Share (%), by Country 2024 & 2032
- Figure 10: Europe Dried Apricot Market Volume Share (%), by Country 2024 & 2032
- Figure 11: Asia Pacific Dried Apricot Market Revenue (Million), by Country 2024 & 2032
- Figure 12: Asia Pacific Dried Apricot Market Volume (K Units), by Country 2024 & 2032
- Figure 13: Asia Pacific Dried Apricot Market Revenue Share (%), by Country 2024 & 2032
- Figure 14: Asia Pacific Dried Apricot Market Volume Share (%), by Country 2024 & 2032
- Figure 15: South America Dried Apricot Market Revenue (Million), by Country 2024 & 2032
- Figure 16: South America Dried Apricot Market Volume (K Units), by Country 2024 & 2032
- Figure 17: South America Dried Apricot Market Revenue Share (%), by Country 2024 & 2032
- Figure 18: South America Dried Apricot Market Volume Share (%), by Country 2024 & 2032
- Figure 19: Middle East and Africa Dried Apricot Market Revenue (Million), by Country 2024 & 2032
- Figure 20: Middle East and Africa Dried Apricot Market Volume (K Units), by Country 2024 & 2032
- Figure 21: Middle East and Africa Dried Apricot Market Revenue Share (%), by Country 2024 & 2032
- Figure 22: Middle East and Africa Dried Apricot Market Volume Share (%), by Country 2024 & 2032
- Figure 23: North America Dried Apricot Market Revenue (Million), by Type 2024 & 2032
- Figure 24: North America Dried Apricot Market Volume (K Units), by Type 2024 & 2032
- Figure 25: North America Dried Apricot Market Revenue Share (%), by Type 2024 & 2032
- Figure 26: North America Dried Apricot Market Volume Share (%), by Type 2024 & 2032
- Figure 27: North America Dried Apricot Market Revenue (Million), by Form 2024 & 2032
- Figure 28: North America Dried Apricot Market Volume (K Units), by Form 2024 & 2032
- Figure 29: North America Dried Apricot Market Revenue Share (%), by Form 2024 & 2032
- Figure 30: North America Dried Apricot Market Volume Share (%), by Form 2024 & 2032
- Figure 31: North America Dried Apricot Market Revenue (Million), by Distribution Channel 2024 & 2032
- Figure 32: North America Dried Apricot Market Volume (K Units), by Distribution Channel 2024 & 2032
- Figure 33: North America Dried Apricot Market Revenue Share (%), by Distribution Channel 2024 & 2032
- Figure 34: North America Dried Apricot Market Volume Share (%), by Distribution Channel 2024 & 2032
- Figure 35: North America Dried Apricot Market Revenue (Million), by Country 2024 & 2032
- Figure 36: North America Dried Apricot Market Volume (K Units), by Country 2024 & 2032
- Figure 37: North America Dried Apricot Market Revenue Share (%), by Country 2024 & 2032
- Figure 38: North America Dried Apricot Market Volume Share (%), by Country 2024 & 2032
- Figure 39: Europe Dried Apricot Market Revenue (Million), by Type 2024 & 2032
- Figure 40: Europe Dried Apricot Market Volume (K Units), by Type 2024 & 2032
- Figure 41: Europe Dried Apricot Market Revenue Share (%), by Type 2024 & 2032
- Figure 42: Europe Dried Apricot Market Volume Share (%), by Type 2024 & 2032
- Figure 43: Europe Dried Apricot Market Revenue (Million), by Form 2024 & 2032
- Figure 44: Europe Dried Apricot Market Volume (K Units), by Form 2024 & 2032
- Figure 45: Europe Dried Apricot Market Revenue Share (%), by Form 2024 & 2032
- Figure 46: Europe Dried Apricot Market Volume Share (%), by Form 2024 & 2032
- Figure 47: Europe Dried Apricot Market Revenue (Million), by Distribution Channel 2024 & 2032
- Figure 48: Europe Dried Apricot Market Volume (K Units), by Distribution Channel 2024 & 2032
- Figure 49: Europe Dried Apricot Market Revenue Share (%), by Distribution Channel 2024 & 2032
- Figure 50: Europe Dried Apricot Market Volume Share (%), by Distribution Channel 2024 & 2032
- Figure 51: Europe Dried Apricot Market Revenue (Million), by Country 2024 & 2032
- Figure 52: Europe Dried Apricot Market Volume (K Units), by Country 2024 & 2032
- Figure 53: Europe Dried Apricot Market Revenue Share (%), by Country 2024 & 2032
- Figure 54: Europe Dried Apricot Market Volume Share (%), by Country 2024 & 2032
- Figure 55: Asia Pacific Dried Apricot Market Revenue (Million), by Type 2024 & 2032
- Figure 56: Asia Pacific Dried Apricot Market Volume (K Units), by Type 2024 & 2032
- Figure 57: Asia Pacific Dried Apricot Market Revenue Share (%), by Type 2024 & 2032
- Figure 58: Asia Pacific Dried Apricot Market Volume Share (%), by Type 2024 & 2032
- Figure 59: Asia Pacific Dried Apricot Market Revenue (Million), by Form 2024 & 2032
- Figure 60: Asia Pacific Dried Apricot Market Volume (K Units), by Form 2024 & 2032
- Figure 61: Asia Pacific Dried Apricot Market Revenue Share (%), by Form 2024 & 2032
- Figure 62: Asia Pacific Dried Apricot Market Volume Share (%), by Form 2024 & 2032
- Figure 63: Asia Pacific Dried Apricot Market Revenue (Million), by Distribution Channel 2024 & 2032
- Figure 64: Asia Pacific Dried Apricot Market Volume (K Units), by Distribution Channel 2024 & 2032
- Figure 65: Asia Pacific Dried Apricot Market Revenue Share (%), by Distribution Channel 2024 & 2032
- Figure 66: Asia Pacific Dried Apricot Market Volume Share (%), by Distribution Channel 2024 & 2032
- Figure 67: Asia Pacific Dried Apricot Market Revenue (Million), by Country 2024 & 2032
- Figure 68: Asia Pacific Dried Apricot Market Volume (K Units), by Country 2024 & 2032
- Figure 69: Asia Pacific Dried Apricot Market Revenue Share (%), by Country 2024 & 2032
- Figure 70: Asia Pacific Dried Apricot Market Volume Share (%), by Country 2024 & 2032
- Figure 71: South America Dried Apricot Market Revenue (Million), by Type 2024 & 2032
- Figure 72: South America Dried Apricot Market Volume (K Units), by Type 2024 & 2032
- Figure 73: South America Dried Apricot Market Revenue Share (%), by Type 2024 & 2032
- Figure 74: South America Dried Apricot Market Volume Share (%), by Type 2024 & 2032
- Figure 75: South America Dried Apricot Market Revenue (Million), by Form 2024 & 2032
- Figure 76: South America Dried Apricot Market Volume (K Units), by Form 2024 & 2032
- Figure 77: South America Dried Apricot Market Revenue Share (%), by Form 2024 & 2032
- Figure 78: South America Dried Apricot Market Volume Share (%), by Form 2024 & 2032
- Figure 79: South America Dried Apricot Market Revenue (Million), by Distribution Channel 2024 & 2032
- Figure 80: South America Dried Apricot Market Volume (K Units), by Distribution Channel 2024 & 2032
- Figure 81: South America Dried Apricot Market Revenue Share (%), by Distribution Channel 2024 & 2032
- Figure 82: South America Dried Apricot Market Volume Share (%), by Distribution Channel 2024 & 2032
- Figure 83: South America Dried Apricot Market Revenue (Million), by Country 2024 & 2032
- Figure 84: South America Dried Apricot Market Volume (K Units), by Country 2024 & 2032
- Figure 85: South America Dried Apricot Market Revenue Share (%), by Country 2024 & 2032
- Figure 86: South America Dried Apricot Market Volume Share (%), by Country 2024 & 2032
- Figure 87: Middle East and Africa Dried Apricot Market Revenue (Million), by Type 2024 & 2032
- Figure 88: Middle East and Africa Dried Apricot Market Volume (K Units), by Type 2024 & 2032
- Figure 89: Middle East and Africa Dried Apricot Market Revenue Share (%), by Type 2024 & 2032
- Figure 90: Middle East and Africa Dried Apricot Market Volume Share (%), by Type 2024 & 2032
- Figure 91: Middle East and Africa Dried Apricot Market Revenue (Million), by Form 2024 & 2032
- Figure 92: Middle East and Africa Dried Apricot Market Volume (K Units), by Form 2024 & 2032
- Figure 93: Middle East and Africa Dried Apricot Market Revenue Share (%), by Form 2024 & 2032
- Figure 94: Middle East and Africa Dried Apricot Market Volume Share (%), by Form 2024 & 2032
- Figure 95: Middle East and Africa Dried Apricot Market Revenue (Million), by Distribution Channel 2024 & 2032
- Figure 96: Middle East and Africa Dried Apricot Market Volume (K Units), by Distribution Channel 2024 & 2032
- Figure 97: Middle East and Africa Dried Apricot Market Revenue Share (%), by Distribution Channel 2024 & 2032
- Figure 98: Middle East and Africa Dried Apricot Market Volume Share (%), by Distribution Channel 2024 & 2032
- Figure 99: Middle East and Africa Dried Apricot Market Revenue (Million), by Country 2024 & 2032
- Figure 100: Middle East and Africa Dried Apricot Market Volume (K Units), by Country 2024 & 2032
- Figure 101: Middle East and Africa Dried Apricot Market Revenue Share (%), by Country 2024 & 2032
- Figure 102: Middle East and Africa Dried Apricot Market Volume Share (%), by Country 2024 & 2032
List of Tables
- Table 1: Global Dried Apricot Market Revenue Million Forecast, by Region 2019 & 2032
- Table 2: Global Dried Apricot Market Volume K Units Forecast, by Region 2019 & 2032
- Table 3: Global Dried Apricot Market Revenue Million Forecast, by Type 2019 & 2032
- Table 4: Global Dried Apricot Market Volume K Units Forecast, by Type 2019 & 2032
- Table 5: Global Dried Apricot Market Revenue Million Forecast, by Form 2019 & 2032
- Table 6: Global Dried Apricot Market Volume K Units Forecast, by Form 2019 & 2032
- Table 7: Global Dried Apricot Market Revenue Million Forecast, by Distribution Channel 2019 & 2032
- Table 8: Global Dried Apricot Market Volume K Units Forecast, by Distribution Channel 2019 & 2032
- Table 9: Global Dried Apricot Market Revenue Million Forecast, by Region 2019 & 2032
- Table 10: Global Dried Apricot Market Volume K Units Forecast, by Region 2019 & 2032
- Table 11: Global Dried Apricot Market Revenue Million Forecast, by Country 2019 & 2032
- Table 12: Global Dried Apricot Market Volume K Units Forecast, by Country 2019 & 2032
- Table 13: United States Dried Apricot Market Revenue (Million) Forecast, by Application 2019 & 2032
- Table 14: United States Dried Apricot Market Volume (K Units) Forecast, by Application 2019 & 2032
- Table 15: Canada Dried Apricot Market Revenue (Million) Forecast, by Application 2019 & 2032
- Table 16: Canada Dried Apricot Market Volume (K Units) Forecast, by Application 2019 & 2032
- Table 17: Mexico Dried Apricot Market Revenue (Million) Forecast, by Application 2019 & 2032
- Table 18: Mexico Dried Apricot Market Volume (K Units) Forecast, by Application 2019 & 2032
- Table 19: Rest of North America Dried Apricot Market Revenue (Million) Forecast, by Application 2019 & 2032
- Table 20: Rest of North America Dried Apricot Market Volume (K Units) Forecast, by Application 2019 & 2032
- Table 21: Global Dried Apricot Market Revenue Million Forecast, by Country 2019 & 2032
- Table 22: Global Dried Apricot Market Volume K Units Forecast, by Country 2019 & 2032
- Table 23: Germany Dried Apricot Market Revenue (Million) Forecast, by Application 2019 & 2032
- Table 24: Germany Dried Apricot Market Volume (K Units) Forecast, by Application 2019 & 2032
- Table 25: United Kingdom Dried Apricot Market Revenue (Million) Forecast, by Application 2019 & 2032
- Table 26: United Kingdom Dried Apricot Market Volume (K Units) Forecast, by Application 2019 & 2032
- Table 27: France Dried Apricot Market Revenue (Million) Forecast, by Application 2019 & 2032
- Table 28: France Dried Apricot Market Volume (K Units) Forecast, by Application 2019 & 2032
- Table 29: Spain Dried Apricot Market Revenue (Million) Forecast, by Application 2019 & 2032
- Table 30: Spain Dried Apricot Market Volume (K Units) Forecast, by Application 2019 & 2032
- Table 31: Russia Dried Apricot Market Revenue (Million) Forecast, by Application 2019 & 2032
- Table 32: Russia Dried Apricot Market Volume (K Units) Forecast, by Application 2019 & 2032
- Table 33: Italy Dried Apricot Market Revenue (Million) Forecast, by Application 2019 & 2032
- Table 34: Italy Dried Apricot Market Volume (K Units) Forecast, by Application 2019 & 2032
- Table 35: Rest of Europe Dried Apricot Market Revenue (Million) Forecast, by Application 2019 & 2032
- Table 36: Rest of Europe Dried Apricot Market Volume (K Units) Forecast, by Application 2019 & 2032
- Table 37: Global Dried Apricot Market Revenue Million Forecast, by Country 2019 & 2032
- Table 38: Global Dried Apricot Market Volume K Units Forecast, by Country 2019 & 2032
- Table 39: China Dried Apricot Market Revenue (Million) Forecast, by Application 2019 & 2032
- Table 40: China Dried Apricot Market Volume (K Units) Forecast, by Application 2019 & 2032
- Table 41: Japan Dried Apricot Market Revenue (Million) Forecast, by Application 2019 & 2032
- Table 42: Japan Dried Apricot Market Volume (K Units) Forecast, by Application 2019 & 2032
- Table 43: India Dried Apricot Market Revenue (Million) Forecast, by Application 2019 & 2032
- Table 44: India Dried Apricot Market Volume (K Units) Forecast, by Application 2019 & 2032
- Table 45: Australia Dried Apricot Market Revenue (Million) Forecast, by Application 2019 & 2032
- Table 46: Australia Dried Apricot Market Volume (K Units) Forecast, by Application 2019 & 2032
- Table 47: Rest of Asia Pacific Dried Apricot Market Revenue (Million) Forecast, by Application 2019 & 2032
- Table 48: Rest of Asia Pacific Dried Apricot Market Volume (K Units) Forecast, by Application 2019 & 2032
- Table 49: Global Dried Apricot Market Revenue Million Forecast, by Country 2019 & 2032
- Table 50: Global Dried Apricot Market Volume K Units Forecast, by Country 2019 & 2032
- Table 51: Brazil Dried Apricot Market Revenue (Million) Forecast, by Application 2019 & 2032
- Table 52: Brazil Dried Apricot Market Volume (K Units) Forecast, by Application 2019 & 2032
- Table 53: Argentina Dried Apricot Market Revenue (Million) Forecast, by Application 2019 & 2032
- Table 54: Argentina Dried Apricot Market Volume (K Units) Forecast, by Application 2019 & 2032
- Table 55: Rest of South America Dried Apricot Market Revenue (Million) Forecast, by Application 2019 & 2032
- Table 56: Rest of South America Dried Apricot Market Volume (K Units) Forecast, by Application 2019 & 2032
- Table 57: Global Dried Apricot Market Revenue Million Forecast, by Country 2019 & 2032
- Table 58: Global Dried Apricot Market Volume K Units Forecast, by Country 2019 & 2032
- Table 59: Turkey Dried Apricot Market Revenue (Million) Forecast, by Application 2019 & 2032
- Table 60: Turkey Dried Apricot Market Volume (K Units) Forecast, by Application 2019 & 2032
- Table 61: Saudi Arabia Dried Apricot Market Revenue (Million) Forecast, by Application 2019 & 2032
- Table 62: Saudi Arabia Dried Apricot Market Volume (K Units) Forecast, by Application 2019 & 2032
- Table 63: South Africa Dried Apricot Market Revenue (Million) Forecast, by Application 2019 & 2032
- Table 64: South Africa Dried Apricot Market Volume (K Units) Forecast, by Application 2019 & 2032
- Table 65: Rest of Middle East and Africa Dried Apricot Market Revenue (Million) Forecast, by Application 2019 & 2032
- Table 66: Rest of Middle East and Africa Dried Apricot Market Volume (K Units) Forecast, by Application 2019 & 2032
- Table 67: Global Dried Apricot Market Revenue Million Forecast, by Type 2019 & 2032
- Table 68: Global Dried Apricot Market Volume K Units Forecast, by Type 2019 & 2032
- Table 69: Global Dried Apricot Market Revenue Million Forecast, by Form 2019 & 2032
- Table 70: Global Dried Apricot Market Volume K Units Forecast, by Form 2019 & 2032
- Table 71: Global Dried Apricot Market Revenue Million Forecast, by Distribution Channel 2019 & 2032
- Table 72: Global Dried Apricot Market Volume K Units Forecast, by Distribution Channel 2019 & 2032
- Table 73: Global Dried Apricot Market Revenue Million Forecast, by Country 2019 & 2032
- Table 74: Global Dried Apricot Market Volume K Units Forecast, by Country 2019 & 2032
- Table 75: United States Dried Apricot Market Revenue (Million) Forecast, by Application 2019 & 2032
- Table 76: United States Dried Apricot Market Volume (K Units) Forecast, by Application 2019 & 2032
- Table 77: Canada Dried Apricot Market Revenue (Million) Forecast, by Application 2019 & 2032
- Table 78: Canada Dried Apricot Market Volume (K Units) Forecast, by Application 2019 & 2032
- Table 79: Mexico Dried Apricot Market Revenue (Million) Forecast, by Application 2019 & 2032
- Table 80: Mexico Dried Apricot Market Volume (K Units) Forecast, by Application 2019 & 2032
- Table 81: Rest of North America Dried Apricot Market Revenue (Million) Forecast, by Application 2019 & 2032
- Table 82: Rest of North America Dried Apricot Market Volume (K Units) Forecast, by Application 2019 & 2032
- Table 83: Global Dried Apricot Market Revenue Million Forecast, by Type 2019 & 2032
- Table 84: Global Dried Apricot Market Volume K Units Forecast, by Type 2019 & 2032
- Table 85: Global Dried Apricot Market Revenue Million Forecast, by Form 2019 & 2032
- Table 86: Global Dried Apricot Market Volume K Units Forecast, by Form 2019 & 2032
- Table 87: Global Dried Apricot Market Revenue Million Forecast, by Distribution Channel 2019 & 2032
- Table 88: Global Dried Apricot Market Volume K Units Forecast, by Distribution Channel 2019 & 2032
- Table 89: Global Dried Apricot Market Revenue Million Forecast, by Country 2019 & 2032
- Table 90: Global Dried Apricot Market Volume K Units Forecast, by Country 2019 & 2032
- Table 91: Germany Dried Apricot Market Revenue (Million) Forecast, by Application 2019 & 2032
- Table 92: Germany Dried Apricot Market Volume (K Units) Forecast, by Application 2019 & 2032
- Table 93: United Kingdom Dried Apricot Market Revenue (Million) Forecast, by Application 2019 & 2032
- Table 94: United Kingdom Dried Apricot Market Volume (K Units) Forecast, by Application 2019 & 2032
- Table 95: France Dried Apricot Market Revenue (Million) Forecast, by Application 2019 & 2032
- Table 96: France Dried Apricot Market Volume (K Units) Forecast, by Application 2019 & 2032
- Table 97: Spain Dried Apricot Market Revenue (Million) Forecast, by Application 2019 & 2032
- Table 98: Spain Dried Apricot Market Volume (K Units) Forecast, by Application 2019 & 2032
- Table 99: Russia Dried Apricot Market Revenue (Million) Forecast, by Application 2019 & 2032
- Table 100: Russia Dried Apricot Market Volume (K Units) Forecast, by Application 2019 & 2032
- Table 101: Italy Dried Apricot Market Revenue (Million) Forecast, by Application 2019 & 2032
- Table 102: Italy Dried Apricot Market Volume (K Units) Forecast, by Application 2019 & 2032
- Table 103: Rest of Europe Dried Apricot Market Revenue (Million) Forecast, by Application 2019 & 2032
- Table 104: Rest of Europe Dried Apricot Market Volume (K Units) Forecast, by Application 2019 & 2032
- Table 105: Global Dried Apricot Market Revenue Million Forecast, by Type 2019 & 2032
- Table 106: Global Dried Apricot Market Volume K Units Forecast, by Type 2019 & 2032
- Table 107: Global Dried Apricot Market Revenue Million Forecast, by Form 2019 & 2032
- Table 108: Global Dried Apricot Market Volume K Units Forecast, by Form 2019 & 2032
- Table 109: Global Dried Apricot Market Revenue Million Forecast, by Distribution Channel 2019 & 2032
- Table 110: Global Dried Apricot Market Volume K Units Forecast, by Distribution Channel 2019 & 2032
- Table 111: Global Dried Apricot Market Revenue Million Forecast, by Country 2019 & 2032
- Table 112: Global Dried Apricot Market Volume K Units Forecast, by Country 2019 & 2032
- Table 113: China Dried Apricot Market Revenue (Million) Forecast, by Application 2019 & 2032
- Table 114: China Dried Apricot Market Volume (K Units) Forecast, by Application 2019 & 2032
- Table 115: Japan Dried Apricot Market Revenue (Million) Forecast, by Application 2019 & 2032
- Table 116: Japan Dried Apricot Market Volume (K Units) Forecast, by Application 2019 & 2032
- Table 117: India Dried Apricot Market Revenue (Million) Forecast, by Application 2019 & 2032
- Table 118: India Dried Apricot Market Volume (K Units) Forecast, by Application 2019 & 2032
- Table 119: Australia Dried Apricot Market Revenue (Million) Forecast, by Application 2019 & 2032
- Table 120: Australia Dried Apricot Market Volume (K Units) Forecast, by Application 2019 & 2032
- Table 121: Rest of Asia Pacific Dried Apricot Market Revenue (Million) Forecast, by Application 2019 & 2032
- Table 122: Rest of Asia Pacific Dried Apricot Market Volume (K Units) Forecast, by Application 2019 & 2032
- Table 123: Global Dried Apricot Market Revenue Million Forecast, by Type 2019 & 2032
- Table 124: Global Dried Apricot Market Volume K Units Forecast, by Type 2019 & 2032
- Table 125: Global Dried Apricot Market Revenue Million Forecast, by Form 2019 & 2032
- Table 126: Global Dried Apricot Market Volume K Units Forecast, by Form 2019 & 2032
- Table 127: Global Dried Apricot Market Revenue Million Forecast, by Distribution Channel 2019 & 2032
- Table 128: Global Dried Apricot Market Volume K Units Forecast, by Distribution Channel 2019 & 2032
- Table 129: Global Dried Apricot Market Revenue Million Forecast, by Country 2019 & 2032
- Table 130: Global Dried Apricot Market Volume K Units Forecast, by Country 2019 & 2032
- Table 131: Brazil Dried Apricot Market Revenue (Million) Forecast, by Application 2019 & 2032
- Table 132: Brazil Dried Apricot Market Volume (K Units) Forecast, by Application 2019 & 2032
- Table 133: Argentina Dried Apricot Market Revenue (Million) Forecast, by Application 2019 & 2032
- Table 134: Argentina Dried Apricot Market Volume (K Units) Forecast, by Application 2019 & 2032
- Table 135: Rest of South America Dried Apricot Market Revenue (Million) Forecast, by Application 2019 & 2032
- Table 136: Rest of South America Dried Apricot Market Volume (K Units) Forecast, by Application 2019 & 2032
- Table 137: Global Dried Apricot Market Revenue Million Forecast, by Type 2019 & 2032
- Table 138: Global Dried Apricot Market Volume K Units Forecast, by Type 2019 & 2032
- Table 139: Global Dried Apricot Market Revenue Million Forecast, by Form 2019 & 2032
- Table 140: Global Dried Apricot Market Volume K Units Forecast, by Form 2019 & 2032
- Table 141: Global Dried Apricot Market Revenue Million Forecast, by Distribution Channel 2019 & 2032
- Table 142: Global Dried Apricot Market Volume K Units Forecast, by Distribution Channel 2019 & 2032
- Table 143: Global Dried Apricot Market Revenue Million Forecast, by Country 2019 & 2032
- Table 144: Global Dried Apricot Market Volume K Units Forecast, by Country 2019 & 2032
- Table 145: Turkey Dried Apricot Market Revenue (Million) Forecast, by Application 2019 & 2032
- Table 146: Turkey Dried Apricot Market Volume (K Units) Forecast, by Application 2019 & 2032
- Table 147: Saudi Arabia Dried Apricot Market Revenue (Million) Forecast, by Application 2019 & 2032
- Table 148: Saudi Arabia Dried Apricot Market Volume (K Units) Forecast, by Application 2019 & 2032
- Table 149: South Africa Dried Apricot Market Revenue (Million) Forecast, by Application 2019 & 2032
- Table 150: South Africa Dried Apricot Market Volume (K Units) Forecast, by Application 2019 & 2032
- Table 151: Rest of Middle East and Africa Dried Apricot Market Revenue (Million) Forecast, by Application 2019 & 2032
- Table 152: Rest of Middle East and Africa Dried Apricot Market Volume (K Units) Forecast, by Application 2019 & 2032
Frequently Asked Questions
1. What is the projected Compound Annual Growth Rate (CAGR) of the Dried Apricot Market?
The projected CAGR is approximately 3.80%.
2. Which companies are prominent players in the Dried Apricot Market?
Key companies in the market include Polychroniadis and Sia O E *List Not Exhaustive, Traina Foods Inc, ApricotKing, Fruits of Turkey, Sun-Maid Growers of California, Bergin Fruit and Nut Company, Purcell Mountain Farms.
3. What are the main segments of the Dried Apricot Market?
The market segments include Type, Form, Distribution Channel.
4. Can you provide details about the market size?
The market size is estimated to be USD XX Million as of 2022.
5. What are some drivers contributing to market growth?
Increasing application of Gelatin in healthcare and pharmaceutical sector.
6. What are the notable trends driving market growth?
Increasing Demand for Organic Dried Apricots.
7. Are there any restraints impacting market growth?
Rising demand for clean label products.
8. Can you provide examples of recent developments in the market?
N/A
9. What pricing options are available for accessing the report?
Pricing options include single-user, multi-user, and enterprise licenses priced at USD 4750, USD 5250, and USD 8750 respectively.
10. Is the market size provided in terms of value or volume?
The market size is provided in terms of value, measured in Million and volume, measured in K Units.
11. Are there any specific market keywords associated with the report?
Yes, the market keyword associated with the report is "Dried Apricot Market," which aids in identifying and referencing the specific market segment covered.
12. How do I determine which pricing option suits my needs best?
The pricing options vary based on user requirements and access needs. Individual users may opt for single-user licenses, while businesses requiring broader access may choose multi-user or enterprise licenses for cost-effective access to the report.
13. Are there any additional resources or data provided in the Dried Apricot Market report?
While the report offers comprehensive insights, it's advisable to review the specific contents or supplementary materials provided to ascertain if additional resources or data are available.
14. How can I stay updated on further developments or reports in the Dried Apricot Market?
To stay informed about further developments, trends, and reports in the Dried Apricot Market, consider subscribing to industry newsletters, following relevant companies and organizations, or regularly checking reputable industry news sources and publications.
Methodology
Step 1 - Identification of Relevant Samples Size from Population Database


Step 2 - Approaches for Defining Global Market Size (Value, Volume* & Price*)

Note*: In applicable scenarios
Step 3 - Data Sources
Primary Research
- Web Analytics
- Survey Reports
- Research Institute
- Latest Research Reports
- Opinion Leaders
Secondary Research
- Annual Reports
- White Paper
- Latest Press Release
- Industry Association
- Paid Database
- Investor Presentations

Step 4 - Data Triangulation
Involves using different sources of information in order to increase the validity of a study
These sources are likely to be stakeholders in a program - participants, other researchers, program staff, other community members, and so on.
Then we put all data in single framework & apply various statistical tools to find out the dynamic on the market.
During the analysis stage, feedback from the stakeholder groups would be compared to determine areas of agreement as well as areas of divergence


