

Key Insights
The global drilling optimization solutions market is poised for significant expansion, driven by the imperative for enhanced efficiency and cost reduction within the oil and gas sector. Technological advancements, including the integration of AI and machine learning, are pivotal in improving drilling performance, minimizing non-productive time (NPT), and optimizing well placement. The growing demand for sustainable and environmentally conscious drilling practices further accelerates the adoption of these advanced solutions. Leading market participants such as Baker Hughes, Halliburton, and Schlumberger are actively investing in R&D to innovate their offerings and meet evolving industry demands. The market is strategically segmented by technology, application, and geographic region. We project the 2025 market size at $3.57 billion, with an estimated CAGR of 6.1% from 2025 to 2033, signifying robust growth driven by increased global exploration and production activities and a heightened focus on drilling efficiency.
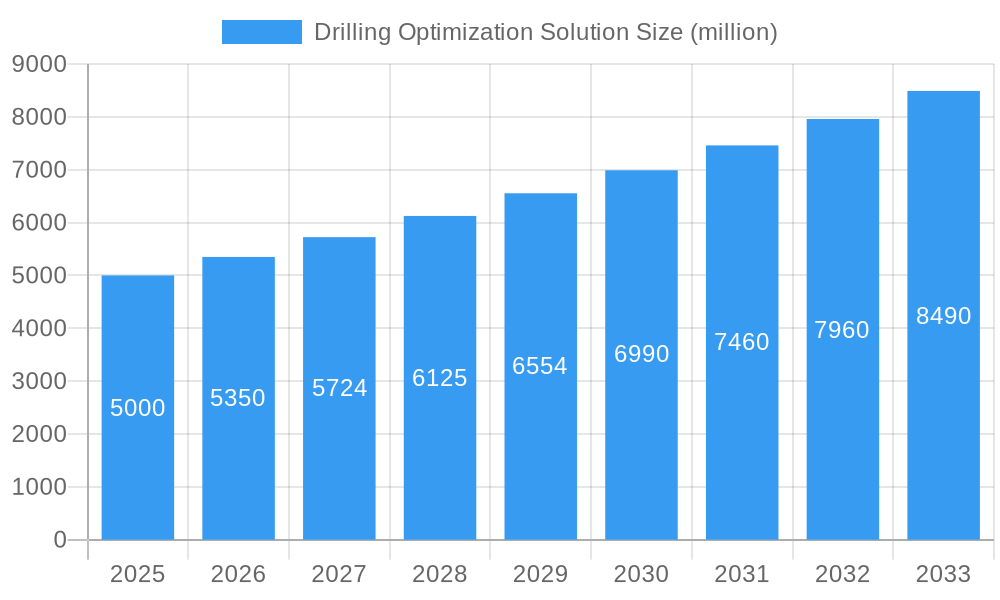
Drilling Optimization Solution Market Size (In Billion)
Key growth inhibitors include the substantial initial investment required for advanced drilling optimization solutions and the necessity for skilled personnel. However, the long-term benefits of reduced operational expenses and superior drilling performance are expected to mitigate these challenges. The proliferation of cloud-based solutions and the development of intuitive user interfaces are contributing to wider market adoption. Geographically, North America and the Middle East are anticipated to lead market growth due to extensive oil and gas exploration and production activities. Market consolidation is likely to continue as major entities acquire specialized firms, expanding their service portfolios. The future trajectory of drilling optimization will be shaped by data analytics and predictive modeling, fostering a more efficient and sustainable oil and gas industry.
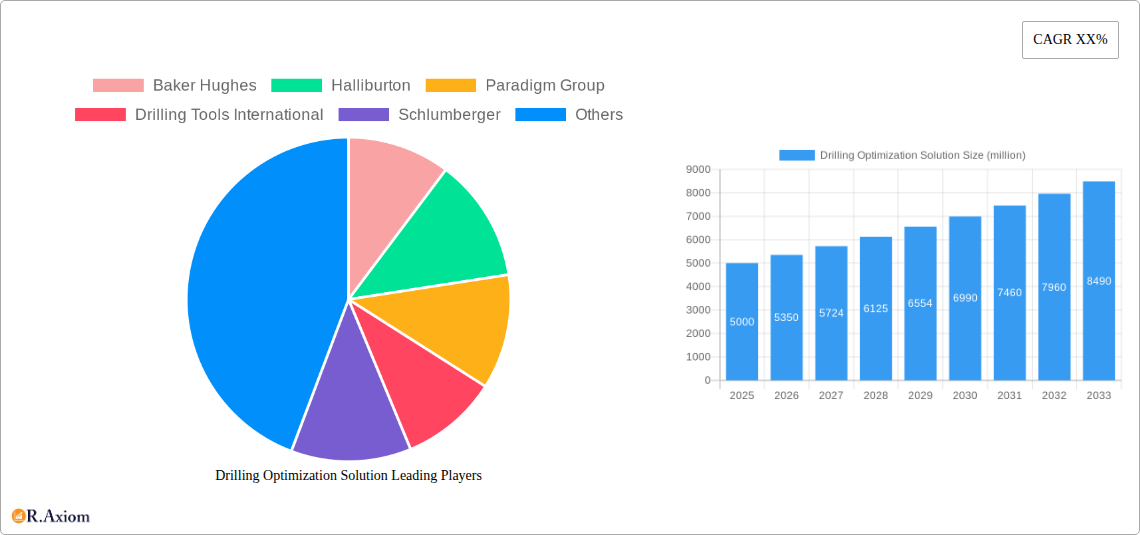
Drilling Optimization Solution Company Market Share
This comprehensive report delivers an in-depth analysis of the global drilling optimization solutions market, providing critical insights for oil and gas industry stakeholders. Spanning from 2019 to 2033, with a focus on 2025, this report presents a detailed forecast, identifying key trends, growth drivers, challenges, and opportunities. The analysis incorporates insights from major players like Baker Hughes, Halliburton, and Schlumberger, offering a holistic perspective of this dynamic market.
Drilling Optimization Solution Market Concentration & Innovation
The global drilling optimization solution market exhibits a moderately concentrated landscape, with a handful of multinational corporations commanding significant market share. Baker Hughes, Halliburton, and Schlumberger, for instance, collectively hold an estimated xx% market share as of 2025, driven by their extensive technological capabilities, global reach, and established customer bases. However, the market also features several specialized players like Paradigm Group, Drilling Tools International, and others, focusing on niche segments and innovative technologies.
Innovation Drivers: The market is driven by continuous technological advancements, including the integration of artificial intelligence (AI), machine learning (ML), and advanced data analytics for enhanced drilling efficiency and cost reduction. Furthermore, the increasing demand for improved safety standards and environmental regulations is stimulating the development of sustainable drilling solutions.
Regulatory Frameworks & M&A Activities: Stringent environmental regulations and safety standards influence technological development and adoption. The market has witnessed significant mergers and acquisitions (M&A) activity in recent years. For example, in 2022, a significant M&A deal valued at approximately $xx million involved [Insert Deal details if available, otherwise replace with "two major players in the drilling optimization sector."]. This trend reflects the industry's consolidation and pursuit of technological synergies.
- Market Share (2025): Baker Hughes (xx%), Halliburton (xx%), Schlumberger (xx%), Others (xx%).
- M&A Deal Value (2019-2024): Approximately $xx million.
- Key Innovation Areas: AI/ML integration, data analytics, automation, and sustainable solutions.
Drilling Optimization Solution Industry Trends & Insights
The global drilling optimization solution market is experiencing robust growth, driven by increasing exploration and production activities, particularly in unconventional oil and gas reserves. The market is projected to achieve a Compound Annual Growth Rate (CAGR) of xx% during the forecast period (2025-2033), reaching a market value of approximately $xx million by 2033. This growth is fueled by several factors, including the rising demand for energy, technological advancements, and the need for improved efficiency and cost reduction in drilling operations. Market penetration remains highest in North America and the Middle East, attributed to robust exploration and production activities and substantial investments in advanced drilling technologies.
Technological disruptions, primarily driven by AI, ML, and advanced sensor technologies, are reshaping the industry landscape. These technologies enable real-time data analysis, predictive modeling, and automated drilling processes, resulting in significant improvements in drilling efficiency, safety, and cost optimization. Consumer preferences are shifting towards integrated solutions that offer a comprehensive suite of optimization tools, as opposed to standalone products. Competitive dynamics are intense, marked by both aggressive price competition and strategic partnerships focused on technological advancements and market expansion.
Dominant Markets & Segments in Drilling Optimization Solution
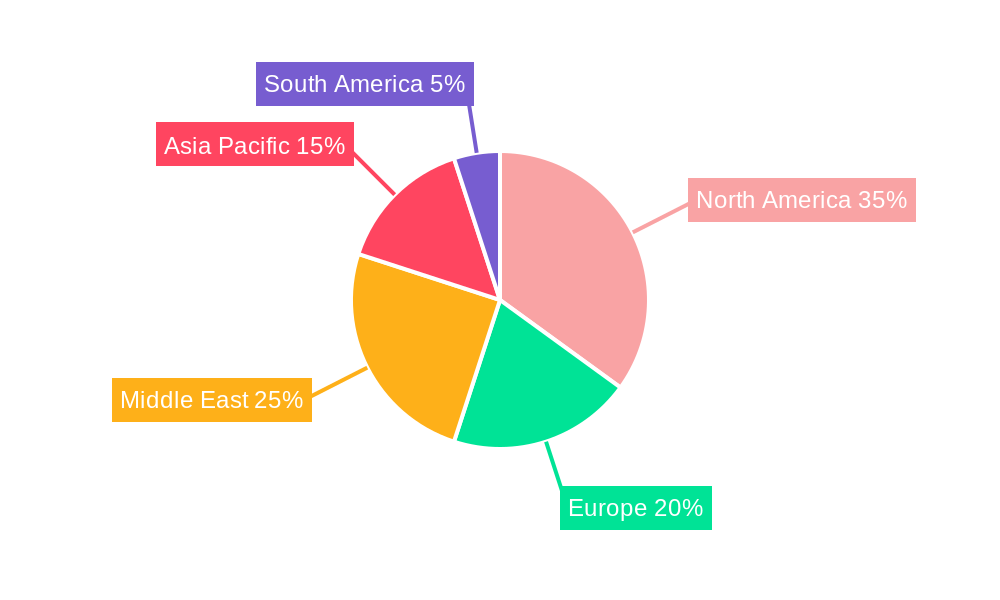
The North American region currently dominates the global drilling optimization solution market, driven by robust oil and gas production activities, substantial investments in advanced technologies, and a well-established infrastructure.
- Key Drivers in North America:
- High oil and gas production
- Significant investments in R&D and technological advancements
- Supportive regulatory framework
- Established industry infrastructure
The Middle East also represents a significant market, with substantial investments in exploration and production activities within the region fueling demand for efficient drilling solutions. Europe is expected to experience moderate growth, while the Asia-Pacific region shows promising potential for future market expansion.
- Detailed Dominance Analysis: North America's dominance stems from its mature oil and gas industry, high technological adoption rates, and extensive regulatory frameworks that promote the use of innovative drilling technologies. The Middle East, however, showcases substantial future potential due to large-scale exploration projects and increasing investment in technology upgrades.
Drilling Optimization Solution Product Developments
Recent product innovations focus on integrating AI and ML for real-time data analysis, predictive modeling, and automated drilling processes. These improvements deliver enhanced drilling efficiency, reduced operational costs, and optimized well designs. New applications include optimizing drilling parameters, predicting potential issues, and reducing non-productive time. Competitive advantages are primarily built on the ability to integrate data from diverse sources, provide accurate predictions, and offer user-friendly interfaces. The market is also witnessing a trend toward cloud-based platforms enabling efficient data sharing and collaboration.
Report Scope & Segmentation Analysis
This report segments the drilling optimization solution market based on several key factors, including technology type (e.g., drilling automation, real-time monitoring systems, data analytics platforms), application (e.g., onshore, offshore, unconventional resources), and end-user (e.g., oil and gas companies, service providers). Each segment exhibits distinct growth prospects, driven by specific market factors. For example, the data analytics platform segment is projected to grow at a CAGR of xx% due to the growing demand for real-time data analysis for drilling optimization. The offshore segment is characterized by higher capital investment and technological complexity but is projected to experience healthy growth in line with the global offshore drilling activities.
Key Drivers of Drilling Optimization Solution Growth
Several key factors drive the growth of the drilling optimization solution market. Technological advancements, particularly in AI, ML, and data analytics, are enabling enhanced drilling efficiency and cost reduction. The increasing demand for oil and gas fuels investment in improved drilling technologies. Furthermore, supportive government policies and regulatory frameworks promoting energy efficiency and safety standards drive adoption rates.
Challenges in the Drilling Optimization Solution Sector
The drilling optimization solution sector faces challenges such as high initial investment costs for advanced technologies, the complexity of data integration from various sources, and the need for skilled professionals to operate and maintain these systems. Supply chain disruptions and the volatile nature of oil and gas prices also pose significant threats. The impact of these challenges is estimated to result in xx% of projects facing delays or cost overruns, necessitating continuous innovation and adaptability within the sector.
Emerging Opportunities in Drilling Optimization Solution
Emerging opportunities include the expansion into unconventional resource extraction, the increasing adoption of cloud-based solutions for data sharing and collaboration, and the development of sustainable drilling technologies to minimize environmental impact. The growing demand for improved safety and efficiency standards opens avenues for innovative solutions that minimize risks and optimize operational costs.
Leading Players in the Drilling Optimization Solution Market
- Baker Hughes
- Halliburton
- Paradigm Group
- Drilling Tools International
- Schlumberger
- Arvand Saman Kish Drilling Services Company
- HMH
- OSA Energy Services Limited
- APS Technology
- KINETIC Upstream Technologies
- Imdex Limited (AMC Drilling Optimisation)
- Hexagon AB
- Drillsoft HDX
Key Developments in Drilling Optimization Solution Industry
- 2022 Q3: Schlumberger launches a new AI-powered drilling optimization platform.
- 2023 Q1: Baker Hughes and a major oil company announce a strategic partnership to develop advanced drilling technologies.
- 2024 Q2: Halliburton acquires a smaller drilling optimization company specializing in data analytics. [Add more if available, otherwise use placeholders with estimated values and dates.]
Strategic Outlook for Drilling Optimization Solution Market
The global drilling optimization solution market is poised for continued growth, driven by ongoing technological advancements, increasing energy demand, and rising investment in oil and gas exploration and production. The integration of AI, ML, and advanced data analytics will significantly transform the industry, enabling more efficient, safer, and cost-effective drilling operations. The focus on sustainability and environmental regulations will also shape the future trajectory of the market, promoting the development and adoption of environmentally friendly drilling solutions. The market's future growth will hinge on the industry's ability to innovate, adapt to evolving technological landscape, and effectively address the challenges posed by fluctuating oil and gas prices and supply chain disruptions.
Drilling Optimization Solution Segmentation
-
1. Application
- 1.1. Oil and Gas
- 1.2. Mineral Resources
- 1.3. Water Resources
- 1.4. Scientific Research Geology
- 1.5. Others
-
2. Types
- 2.1. Service
- 2.2. Hardware
- 2.3. Software
Drilling Optimization Solution Segmentation By Geography
-
1. North America
- 1.1. United States
- 1.2. Canada
- 1.3. Mexico
-
2. South America
- 2.1. Brazil
- 2.2. Argentina
- 2.3. Rest of South America
-
3. Europe
- 3.1. United Kingdom
- 3.2. Germany
- 3.3. France
- 3.4. Italy
- 3.5. Spain
- 3.6. Russia
- 3.7. Benelux
- 3.8. Nordics
- 3.9. Rest of Europe
-
4. Middle East & Africa
- 4.1. Turkey
- 4.2. Israel
- 4.3. GCC
- 4.4. North Africa
- 4.5. South Africa
- 4.6. Rest of Middle East & Africa
-
5. Asia Pacific
- 5.1. China
- 5.2. India
- 5.3. Japan
- 5.4. South Korea
- 5.5. ASEAN
- 5.6. Oceania
- 5.7. Rest of Asia Pacific
Drilling Optimization Solution Regional Market Share
Geographic Coverage of Drilling Optimization Solution
Drilling Optimization Solution REPORT HIGHLIGHTS
| Aspects | Details |
|---|---|
| Study Period | 2020-2034 |
| Base Year | 2025 |
| Estimated Year | 2026 |
| Forecast Period | 2026-2034 |
| Historical Period | 2020-2025 |
| Growth Rate | CAGR of 6.1% from 2020-2034 |
| Segmentation |
|
Table of Contents
- 1. Introduction
- 1.1. Research Scope
- 1.2. Market Segmentation
- 1.3. Research Objective
- 1.4. Definitions and Assumptions
- 2. Executive Summary
- 2.1. Market Snapshot
- 3. Market Dynamics
- 3.1. Market Drivers
- 3.2. Market Restrains
- 3.3. Market Trends
- 3.4. Market Opportunities
- 4. Market Factor Analysis
- 4.1. Porters Five Forces
- 4.1.1. Bargaining Power of Suppliers
- 4.1.2. Bargaining Power of Buyers
- 4.1.3. Threat of New Entrants
- 4.1.4. Threat of Substitutes
- 4.1.5. Competitive Rivalry
- 4.2. PESTEL analysis
- 4.3. BCG Analysis
- 4.3.1. Stars (High Growth, High Market Share)
- 4.3.2. Cash Cows (Low Growth, High Market Share)
- 4.3.3. Question Mark (High Growth, Low Market Share)
- 4.3.4. Dogs (Low Growth, Low Market Share)
- 4.4. Ansoff Matrix Analysis
- 4.5. Supply Chain Analysis
- 4.6. Regulatory Landscape
- 4.7. Current Market Potential and Opportunity Assessment (TAM–SAM–SOM Framework)
- 4.8. RAX Analyst Note
- 4.1. Porters Five Forces
- 5. Market Analysis, Insights and Forecast 2021-2033
- 5.1. Market Analysis, Insights and Forecast - by Application
- 5.1.1. Oil and Gas
- 5.1.2. Mineral Resources
- 5.1.3. Water Resources
- 5.1.4. Scientific Research Geology
- 5.1.5. Others
- 5.2. Market Analysis, Insights and Forecast - by Types
- 5.2.1. Service
- 5.2.2. Hardware
- 5.2.3. Software
- 5.3. Market Analysis, Insights and Forecast - by Region
- 5.3.1. North America
- 5.3.2. South America
- 5.3.3. Europe
- 5.3.4. Middle East & Africa
- 5.3.5. Asia Pacific
- 5.1. Market Analysis, Insights and Forecast - by Application
- 6. Global Drilling Optimization Solution Analysis, Insights and Forecast, 2021-2033
- 6.1. Market Analysis, Insights and Forecast - by Application
- 6.1.1. Oil and Gas
- 6.1.2. Mineral Resources
- 6.1.3. Water Resources
- 6.1.4. Scientific Research Geology
- 6.1.5. Others
- 6.2. Market Analysis, Insights and Forecast - by Types
- 6.2.1. Service
- 6.2.2. Hardware
- 6.2.3. Software
- 6.1. Market Analysis, Insights and Forecast - by Application
- 7. North America Drilling Optimization Solution Analysis, Insights and Forecast, 2020-2032
- 7.1. Market Analysis, Insights and Forecast - by Application
- 7.1.1. Oil and Gas
- 7.1.2. Mineral Resources
- 7.1.3. Water Resources
- 7.1.4. Scientific Research Geology
- 7.1.5. Others
- 7.2. Market Analysis, Insights and Forecast - by Types
- 7.2.1. Service
- 7.2.2. Hardware
- 7.2.3. Software
- 7.1. Market Analysis, Insights and Forecast - by Application
- 8. South America Drilling Optimization Solution Analysis, Insights and Forecast, 2020-2032
- 8.1. Market Analysis, Insights and Forecast - by Application
- 8.1.1. Oil and Gas
- 8.1.2. Mineral Resources
- 8.1.3. Water Resources
- 8.1.4. Scientific Research Geology
- 8.1.5. Others
- 8.2. Market Analysis, Insights and Forecast - by Types
- 8.2.1. Service
- 8.2.2. Hardware
- 8.2.3. Software
- 8.1. Market Analysis, Insights and Forecast - by Application
- 9. Europe Drilling Optimization Solution Analysis, Insights and Forecast, 2020-2032
- 9.1. Market Analysis, Insights and Forecast - by Application
- 9.1.1. Oil and Gas
- 9.1.2. Mineral Resources
- 9.1.3. Water Resources
- 9.1.4. Scientific Research Geology
- 9.1.5. Others
- 9.2. Market Analysis, Insights and Forecast - by Types
- 9.2.1. Service
- 9.2.2. Hardware
- 9.2.3. Software
- 9.1. Market Analysis, Insights and Forecast - by Application
- 10. Middle East & Africa Drilling Optimization Solution Analysis, Insights and Forecast, 2020-2032
- 10.1. Market Analysis, Insights and Forecast - by Application
- 10.1.1. Oil and Gas
- 10.1.2. Mineral Resources
- 10.1.3. Water Resources
- 10.1.4. Scientific Research Geology
- 10.1.5. Others
- 10.2. Market Analysis, Insights and Forecast - by Types
- 10.2.1. Service
- 10.2.2. Hardware
- 10.2.3. Software
- 10.1. Market Analysis, Insights and Forecast - by Application
- 11. Asia Pacific Drilling Optimization Solution Analysis, Insights and Forecast, 2020-2032
- 11.1. Market Analysis, Insights and Forecast - by Application
- 11.1.1. Oil and Gas
- 11.1.2. Mineral Resources
- 11.1.3. Water Resources
- 11.1.4. Scientific Research Geology
- 11.1.5. Others
- 11.2. Market Analysis, Insights and Forecast - by Types
- 11.2.1. Service
- 11.2.2. Hardware
- 11.2.3. Software
- 11.1. Market Analysis, Insights and Forecast - by Application
- 12. Competitive Analysis
- 12.1. Company Profiles
- 12.1.1 Baker Hughes
- 12.1.1.1. Company Overview
- 12.1.1.2. Products
- 12.1.1.3. Company Financials
- 12.1.1.4. SWOT Analysis
- 12.1.2 Halliburton
- 12.1.2.1. Company Overview
- 12.1.2.2. Products
- 12.1.2.3. Company Financials
- 12.1.2.4. SWOT Analysis
- 12.1.3 Paradigm Group
- 12.1.3.1. Company Overview
- 12.1.3.2. Products
- 12.1.3.3. Company Financials
- 12.1.3.4. SWOT Analysis
- 12.1.4 Drilling Tools International
- 12.1.4.1. Company Overview
- 12.1.4.2. Products
- 12.1.4.3. Company Financials
- 12.1.4.4. SWOT Analysis
- 12.1.5 Schlumberger
- 12.1.5.1. Company Overview
- 12.1.5.2. Products
- 12.1.5.3. Company Financials
- 12.1.5.4. SWOT Analysis
- 12.1.6 Arvand Saman Kish Drilling Services Company
- 12.1.6.1. Company Overview
- 12.1.6.2. Products
- 12.1.6.3. Company Financials
- 12.1.6.4. SWOT Analysis
- 12.1.7 HMH
- 12.1.7.1. Company Overview
- 12.1.7.2. Products
- 12.1.7.3. Company Financials
- 12.1.7.4. SWOT Analysis
- 12.1.8 OSA Energy Services Limited
- 12.1.8.1. Company Overview
- 12.1.8.2. Products
- 12.1.8.3. Company Financials
- 12.1.8.4. SWOT Analysis
- 12.1.9 APS Technology
- 12.1.9.1. Company Overview
- 12.1.9.2. Products
- 12.1.9.3. Company Financials
- 12.1.9.4. SWOT Analysis
- 12.1.10 KINETIC Upstream Technologies
- 12.1.10.1. Company Overview
- 12.1.10.2. Products
- 12.1.10.3. Company Financials
- 12.1.10.4. SWOT Analysis
- 12.1.11 Imdex Limited(AMC Drilling Optimisation)
- 12.1.11.1. Company Overview
- 12.1.11.2. Products
- 12.1.11.3. Company Financials
- 12.1.11.4. SWOT Analysis
- 12.1.12 Hexagon AB
- 12.1.12.1. Company Overview
- 12.1.12.2. Products
- 12.1.12.3. Company Financials
- 12.1.12.4. SWOT Analysis
- 12.1.13 Drillsoft HDX
- 12.1.13.1. Company Overview
- 12.1.13.2. Products
- 12.1.13.3. Company Financials
- 12.1.13.4. SWOT Analysis
- 12.1.1 Baker Hughes
- 12.2. Market Entropy
- 12.2.1 Company's Key Areas Served
- 12.2.2 Recent Developments
- 12.3. Company Market Share Analysis 2025
- 12.3.1 Top 5 Companies Market Share Analysis
- 12.3.2 Top 3 Companies Market Share Analysis
- 12.4. List of Potential Customers
- 13. Research Methodology
List of Figures
- Figure 1: Global Drilling Optimization Solution Revenue Breakdown (billion, %) by Region 2025 & 2033
- Figure 2: North America Drilling Optimization Solution Revenue (billion), by Application 2025 & 2033
- Figure 3: North America Drilling Optimization Solution Revenue Share (%), by Application 2025 & 2033
- Figure 4: North America Drilling Optimization Solution Revenue (billion), by Types 2025 & 2033
- Figure 5: North America Drilling Optimization Solution Revenue Share (%), by Types 2025 & 2033
- Figure 6: North America Drilling Optimization Solution Revenue (billion), by Country 2025 & 2033
- Figure 7: North America Drilling Optimization Solution Revenue Share (%), by Country 2025 & 2033
- Figure 8: South America Drilling Optimization Solution Revenue (billion), by Application 2025 & 2033
- Figure 9: South America Drilling Optimization Solution Revenue Share (%), by Application 2025 & 2033
- Figure 10: South America Drilling Optimization Solution Revenue (billion), by Types 2025 & 2033
- Figure 11: South America Drilling Optimization Solution Revenue Share (%), by Types 2025 & 2033
- Figure 12: South America Drilling Optimization Solution Revenue (billion), by Country 2025 & 2033
- Figure 13: South America Drilling Optimization Solution Revenue Share (%), by Country 2025 & 2033
- Figure 14: Europe Drilling Optimization Solution Revenue (billion), by Application 2025 & 2033
- Figure 15: Europe Drilling Optimization Solution Revenue Share (%), by Application 2025 & 2033
- Figure 16: Europe Drilling Optimization Solution Revenue (billion), by Types 2025 & 2033
- Figure 17: Europe Drilling Optimization Solution Revenue Share (%), by Types 2025 & 2033
- Figure 18: Europe Drilling Optimization Solution Revenue (billion), by Country 2025 & 2033
- Figure 19: Europe Drilling Optimization Solution Revenue Share (%), by Country 2025 & 2033
- Figure 20: Middle East & Africa Drilling Optimization Solution Revenue (billion), by Application 2025 & 2033
- Figure 21: Middle East & Africa Drilling Optimization Solution Revenue Share (%), by Application 2025 & 2033
- Figure 22: Middle East & Africa Drilling Optimization Solution Revenue (billion), by Types 2025 & 2033
- Figure 23: Middle East & Africa Drilling Optimization Solution Revenue Share (%), by Types 2025 & 2033
- Figure 24: Middle East & Africa Drilling Optimization Solution Revenue (billion), by Country 2025 & 2033
- Figure 25: Middle East & Africa Drilling Optimization Solution Revenue Share (%), by Country 2025 & 2033
- Figure 26: Asia Pacific Drilling Optimization Solution Revenue (billion), by Application 2025 & 2033
- Figure 27: Asia Pacific Drilling Optimization Solution Revenue Share (%), by Application 2025 & 2033
- Figure 28: Asia Pacific Drilling Optimization Solution Revenue (billion), by Types 2025 & 2033
- Figure 29: Asia Pacific Drilling Optimization Solution Revenue Share (%), by Types 2025 & 2033
- Figure 30: Asia Pacific Drilling Optimization Solution Revenue (billion), by Country 2025 & 2033
- Figure 31: Asia Pacific Drilling Optimization Solution Revenue Share (%), by Country 2025 & 2033
List of Tables
- Table 1: Global Drilling Optimization Solution Revenue billion Forecast, by Application 2020 & 2033
- Table 2: Global Drilling Optimization Solution Revenue billion Forecast, by Types 2020 & 2033
- Table 3: Global Drilling Optimization Solution Revenue billion Forecast, by Region 2020 & 2033
- Table 4: Global Drilling Optimization Solution Revenue billion Forecast, by Application 2020 & 2033
- Table 5: Global Drilling Optimization Solution Revenue billion Forecast, by Types 2020 & 2033
- Table 6: Global Drilling Optimization Solution Revenue billion Forecast, by Country 2020 & 2033
- Table 7: United States Drilling Optimization Solution Revenue (billion) Forecast, by Application 2020 & 2033
- Table 8: Canada Drilling Optimization Solution Revenue (billion) Forecast, by Application 2020 & 2033
- Table 9: Mexico Drilling Optimization Solution Revenue (billion) Forecast, by Application 2020 & 2033
- Table 10: Global Drilling Optimization Solution Revenue billion Forecast, by Application 2020 & 2033
- Table 11: Global Drilling Optimization Solution Revenue billion Forecast, by Types 2020 & 2033
- Table 12: Global Drilling Optimization Solution Revenue billion Forecast, by Country 2020 & 2033
- Table 13: Brazil Drilling Optimization Solution Revenue (billion) Forecast, by Application 2020 & 2033
- Table 14: Argentina Drilling Optimization Solution Revenue (billion) Forecast, by Application 2020 & 2033
- Table 15: Rest of South America Drilling Optimization Solution Revenue (billion) Forecast, by Application 2020 & 2033
- Table 16: Global Drilling Optimization Solution Revenue billion Forecast, by Application 2020 & 2033
- Table 17: Global Drilling Optimization Solution Revenue billion Forecast, by Types 2020 & 2033
- Table 18: Global Drilling Optimization Solution Revenue billion Forecast, by Country 2020 & 2033
- Table 19: United Kingdom Drilling Optimization Solution Revenue (billion) Forecast, by Application 2020 & 2033
- Table 20: Germany Drilling Optimization Solution Revenue (billion) Forecast, by Application 2020 & 2033
- Table 21: France Drilling Optimization Solution Revenue (billion) Forecast, by Application 2020 & 2033
- Table 22: Italy Drilling Optimization Solution Revenue (billion) Forecast, by Application 2020 & 2033
- Table 23: Spain Drilling Optimization Solution Revenue (billion) Forecast, by Application 2020 & 2033
- Table 24: Russia Drilling Optimization Solution Revenue (billion) Forecast, by Application 2020 & 2033
- Table 25: Benelux Drilling Optimization Solution Revenue (billion) Forecast, by Application 2020 & 2033
- Table 26: Nordics Drilling Optimization Solution Revenue (billion) Forecast, by Application 2020 & 2033
- Table 27: Rest of Europe Drilling Optimization Solution Revenue (billion) Forecast, by Application 2020 & 2033
- Table 28: Global Drilling Optimization Solution Revenue billion Forecast, by Application 2020 & 2033
- Table 29: Global Drilling Optimization Solution Revenue billion Forecast, by Types 2020 & 2033
- Table 30: Global Drilling Optimization Solution Revenue billion Forecast, by Country 2020 & 2033
- Table 31: Turkey Drilling Optimization Solution Revenue (billion) Forecast, by Application 2020 & 2033
- Table 32: Israel Drilling Optimization Solution Revenue (billion) Forecast, by Application 2020 & 2033
- Table 33: GCC Drilling Optimization Solution Revenue (billion) Forecast, by Application 2020 & 2033
- Table 34: North Africa Drilling Optimization Solution Revenue (billion) Forecast, by Application 2020 & 2033
- Table 35: South Africa Drilling Optimization Solution Revenue (billion) Forecast, by Application 2020 & 2033
- Table 36: Rest of Middle East & Africa Drilling Optimization Solution Revenue (billion) Forecast, by Application 2020 & 2033
- Table 37: Global Drilling Optimization Solution Revenue billion Forecast, by Application 2020 & 2033
- Table 38: Global Drilling Optimization Solution Revenue billion Forecast, by Types 2020 & 2033
- Table 39: Global Drilling Optimization Solution Revenue billion Forecast, by Country 2020 & 2033
- Table 40: China Drilling Optimization Solution Revenue (billion) Forecast, by Application 2020 & 2033
- Table 41: India Drilling Optimization Solution Revenue (billion) Forecast, by Application 2020 & 2033
- Table 42: Japan Drilling Optimization Solution Revenue (billion) Forecast, by Application 2020 & 2033
- Table 43: South Korea Drilling Optimization Solution Revenue (billion) Forecast, by Application 2020 & 2033
- Table 44: ASEAN Drilling Optimization Solution Revenue (billion) Forecast, by Application 2020 & 2033
- Table 45: Oceania Drilling Optimization Solution Revenue (billion) Forecast, by Application 2020 & 2033
- Table 46: Rest of Asia Pacific Drilling Optimization Solution Revenue (billion) Forecast, by Application 2020 & 2033
Frequently Asked Questions
1. What is the projected Compound Annual Growth Rate (CAGR) of the Drilling Optimization Solution?
The projected CAGR is approximately 6.1%.
2. Which companies are prominent players in the Drilling Optimization Solution?
Key companies in the market include Baker Hughes, Halliburton, Paradigm Group, Drilling Tools International, Schlumberger, Arvand Saman Kish Drilling Services Company, HMH, OSA Energy Services Limited, APS Technology, KINETIC Upstream Technologies, Imdex Limited(AMC Drilling Optimisation), Hexagon AB, Drillsoft HDX.
3. What are the main segments of the Drilling Optimization Solution?
The market segments include Application, Types.
4. Can you provide details about the market size?
The market size is estimated to be USD 3.57 billion as of 2022.
5. What are some drivers contributing to market growth?
N/A
6. What are the notable trends driving market growth?
N/A
7. Are there any restraints impacting market growth?
N/A
8. Can you provide examples of recent developments in the market?
N/A
9. What pricing options are available for accessing the report?
Pricing options include single-user, multi-user, and enterprise licenses priced at USD 4900.00, USD 7350.00, and USD 9800.00 respectively.
10. Is the market size provided in terms of value or volume?
The market size is provided in terms of value, measured in billion.
11. Are there any specific market keywords associated with the report?
Yes, the market keyword associated with the report is "Drilling Optimization Solution," which aids in identifying and referencing the specific market segment covered.
12. How do I determine which pricing option suits my needs best?
The pricing options vary based on user requirements and access needs. Individual users may opt for single-user licenses, while businesses requiring broader access may choose multi-user or enterprise licenses for cost-effective access to the report.
13. Are there any additional resources or data provided in the Drilling Optimization Solution report?
While the report offers comprehensive insights, it's advisable to review the specific contents or supplementary materials provided to ascertain if additional resources or data are available.
14. How can I stay updated on further developments or reports in the Drilling Optimization Solution?
To stay informed about further developments, trends, and reports in the Drilling Optimization Solution, consider subscribing to industry newsletters, following relevant companies and organizations, or regularly checking reputable industry news sources and publications.
Methodology
Step 1 - Identification of Relevant Samples Size from Population Database


Step 2 - Approaches for Defining Global Market Size (Value, Volume* & Price*)

Note*: In applicable scenarios
Step 3 - Data Sources
Primary Research
- Web Analytics
- Survey Reports
- Research Institute
- Latest Research Reports
- Opinion Leaders
Secondary Research
- Annual Reports
- White Paper
- Latest Press Release
- Industry Association
- Paid Database
- Investor Presentations

Step 4 - Data Triangulation
Involves using different sources of information in order to increase the validity of a study
These sources are likely to be stakeholders in a program - participants, other researchers, program staff, other community members, and so on.
Then we put all data in single framework & apply various statistical tools to find out the dynamic on the market.
During the analysis stage, feedback from the stakeholder groups would be compared to determine areas of agreement as well as areas of divergence