

Key Insights
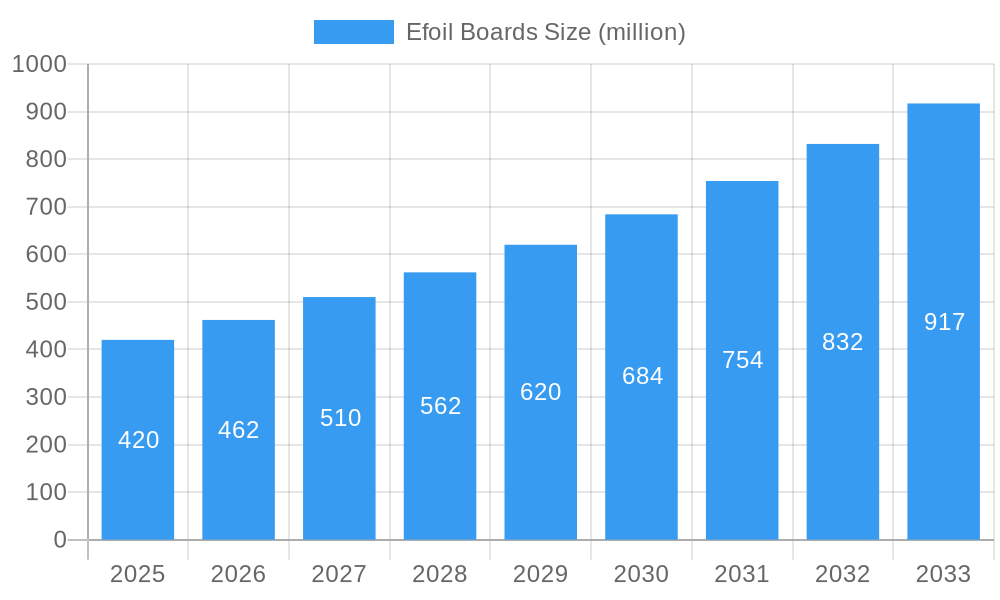
The global Efoil Boards market is poised for significant expansion, projected to reach a substantial USD 420 million in 2025. This impressive growth is driven by a compound annual growth rate (CAGR) of 10.3%, indicating a robust and accelerating demand for electric hydrofoil boards. Key drivers for this surge include the escalating popularity of watersports and a growing consumer interest in environmentally friendly and innovative recreational activities. The entertainment sector, in particular, is a major catalyst, with efoils offering a unique and thrilling experience for leisure and tourism. Furthermore, the rental business segment is also witnessing considerable traction, as operators leverage the novelty and appeal of efoils to attract customers. This increasing adoption across diverse applications underscores the market's dynamic nature and its potential to redefine aquatic recreation.
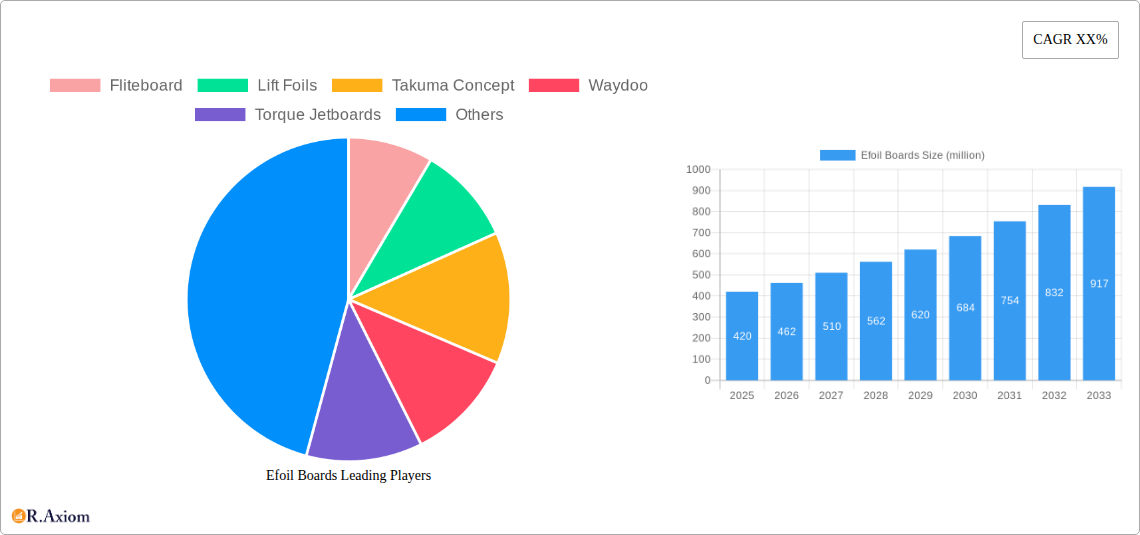
Efoil Boards Market Size (In Million)
The Efoil Boards market is characterized by rapid technological advancements and evolving consumer preferences. The market is segmented by speed capabilities, with categories like "Up to 25mph," "Up to 35mph," and "Up to 45mph" catering to a spectrum of user skill levels and desired experiences. While the market is fueled by innovation and growing adoption, certain restraints may influence its trajectory. These could include the current high cost of efoil boards, which can be a barrier to entry for some consumers, and the need for adequate training and safety infrastructure. However, ongoing research and development are expected to address these challenges, potentially leading to more affordable and accessible Efoil solutions. Leading companies like Fliteboard, Lift Foils, and Takuma Concept are at the forefront of this innovation, driving competition and product refinement.
Efoil Boards Company Market Share
This comprehensive market research report delves into the dynamic Efoil Boards industry, offering unparalleled insights into market concentration, innovation drivers, and future growth trajectories. Spanning a study period from 2019 to 2033, with a base year of 2025 and a forecast period extending to 2033, this report meticulously analyzes historical trends, current market dynamics, and projected advancements. It provides actionable intelligence for industry stakeholders, investors, and manufacturers seeking to capitalize on the burgeoning electric hydrofoil market. Our analysis encompasses a detailed examination of key players, technological innovations, regulatory landscapes, and consumer preferences, painting a vivid picture of the market's evolution.
Efoil Boards Market Concentration & Innovation
The Efoil Boards market, while experiencing rapid expansion, exhibits a moderate level of concentration, with a few key players holding significant market share. Innovation remains a paramount driver, fueled by continuous advancements in battery technology, motor efficiency, and board design. Companies are investing heavily in R&D to enhance performance, durability, and user experience, leading to the introduction of lighter, more powerful, and intuitive efoil boards. Regulatory frameworks are gradually evolving to accommodate this emerging water sport, focusing on safety standards and environmental impact. Product substitutes, such as traditional surfboards, jet skis, and other personal watercraft, exist, but the unique thrill and accessibility of efoiling present a distinct value proposition. End-user trends indicate a growing demand from recreational users for exhilarating experiences and from commercial entities for rental business applications. Merger and acquisition (M&A) activities, while not yet at peak levels, are anticipated to increase as larger marine or sporting goods companies seek to enter or expand their presence in this high-growth sector. We project M&A deal values to reach approximately xx million by the end of the forecast period, reflecting strategic consolidation and market expansion initiatives.
Efoil Boards Industry Trends & Insights
The global Efoil Boards market is poised for robust expansion, driven by an increasing global disposable income and a growing appetite for unique recreational activities. Technological disruptions, particularly in the realm of battery energy density and waterproof motor designs, are continuously pushing the boundaries of performance and affordability. Consumer preferences are shifting towards eco-friendly and emission-free water sports, further bolstering the appeal of electric hydrofoils. The competitive landscape is intensifying, with both established brands and emerging startups vying for market dominance. Key growth drivers include the inherent appeal of effortless gliding over water, the reduced physical exertion compared to traditional watersports, and the expanding accessibility through rental services. The market penetration of efoil boards, currently at approximately xx%, is expected to surge by xx% annually in the coming years. The compound annual growth rate (CAGR) for the Efoil Boards market is projected to be xx% over the forecast period. We anticipate the market size to reach over xxx million by 2033, up from xxx million in the historical year of 2024.
Dominant Markets & Segments in Efoil Boards
North America currently holds the dominant position in the global Efoil Boards market, driven by a well-established watersports culture, high disposable incomes, and favorable coastal infrastructure. Within North America, the United States leads in market penetration and sales volume, supported by extensive coastlines and a strong recreational tourism sector. The "Entertainment" segment is the primary driver of market demand, accounting for over xx% of total sales. This segment is characterized by individual consumers seeking recreational enjoyment and adventure. The "Rental Business" segment is exhibiting rapid growth, particularly in popular tourist destinations, as operators leverage efoil boards to offer novel experiences.
- Key Drivers of Regional Dominance (North America):
- Economic Policies: Favorable economic conditions and strong consumer spending power.
- Infrastructure: Extensive coastlines, readily available marinas, and a developed tourism industry.
- Consumer Trends: High adoption rates for new and innovative recreational technologies and a strong emphasis on outdoor activities.
- Regulatory Environment: While evolving, the regulatory framework in key North American markets is becoming more accommodating to the growth of efoiling.
In terms of product types, the "Up to 25mph" segment currently dominates due to its accessibility and beginner-friendliness, representing approximately xx% of the market. However, the "Up to 35mph" segment is experiencing significant growth as users gain experience and seek more thrilling rides. The "Up to 45mph" segment, while niche, appeals to adrenaline seekers and professional riders. The projected growth in the "Up to 35mph" and "Up to 45mph" segments signifies a maturation of the market and a rising demand for higher performance.
Efoil Boards Product Developments
Product development in the Efoil Boards market is characterized by a relentless pursuit of enhanced performance, extended battery life, and improved user ergonomics. Innovations focus on lighter, more durable board materials, integrated propulsion systems, and intuitive control mechanisms. Manufacturers are actively developing more powerful yet efficient electric motors and advanced battery management systems to provide longer ride times and quicker charging capabilities. The integration of smart features, such as GPS tracking and performance data logging, is also becoming a key competitive advantage, catering to both recreational and performance-oriented riders. These advancements are crucial for expanding the appeal of efoiling to a broader audience and for solidifying its position as a leading personal watercraft option.
Report Scope & Segmentation Analysis
This report provides an in-depth analysis of the Efoil Boards market, meticulously segmented to offer granular insights. The segmentation covers key applications, including Entertainment and Rental Business. The Entertainment segment is projected to grow at a CAGR of xx%, driven by individual recreational use and the pursuit of novel watersports experiences. The Rental Business segment is anticipated to witness a higher CAGR of xx%, fueled by the increasing popularity of adventure tourism and the demand for accessible water activities. Product types are categorized as Up to 25mph, Up to 35mph, and Up to 45mph. The Up to 25mph segment is expected to maintain a steady growth rate of xx%, serving as a gateway for new users. The Up to 35mph segment is poised for significant expansion at xx% CAGR, reflecting user progression and demand for enhanced speed. The high-performance Up to 45mph segment is projected to grow at xx% CAGR, catering to experienced riders and competitive use.
Key Drivers of Efoil Boards Growth
The Efoil Boards market is propelled by several potent growth drivers. Technologically, advancements in lithium-ion battery technology have significantly improved ride duration and reduced charging times, making efoiling more practical. The increasing global focus on sustainable and eco-friendly recreational activities aligns perfectly with the emission-free nature of efoil boards, attracting environmentally conscious consumers. Economically, rising disposable incomes in emerging markets and a strong desire for unique leisure experiences are fueling demand. Furthermore, the growing popularity of watersports and adventure tourism worldwide provides a fertile ground for efoil board adoption. The continuous innovation in board design and motor efficiency also contributes to making these products more accessible and user-friendly, broadening their appeal.
Challenges in the Efoil Boards Sector
Despite its promising growth, the Efoil Boards sector faces several challenges. Regulatory hurdles remain a significant restraint, as different regions have varying rules regarding the operation of powered personal watercraft, leading to market fragmentation. High initial purchase costs for efoil boards can be a barrier for some consumers, limiting mass adoption. Supply chain disruptions, particularly for specialized electronic components and battery cells, can impact production volumes and lead times. Intense competition from established personal watercraft manufacturers and other emerging watersports technologies also poses a challenge. The perceived learning curve for some users and the need for specialized training can also slow down market penetration.
Emerging Opportunities in Efoil Boards
The Efoil Boards market is ripe with emerging opportunities. The development of more affordable and modular efoil systems could unlock new market segments, including entry-level consumers and developing regions. The expansion of the rental business model to more diverse locations, such as lakes and rivers, beyond coastal areas, presents a significant opportunity. Advancements in battery technology, leading to even longer ride times and faster charging, will further enhance user experience and market appeal. Collaboration between efoil manufacturers and tourism boards or hospitality businesses can create integrated recreational packages, driving demand. The integration of smart technology for performance tracking and social sharing could also foster a community around efoiling, boosting engagement.
Leading Players in the Efoil Boards Market
- Fliteboard
- Lift Foils
- Takuma Concept
- Waydoo
- Torque Jetboards
- Kymera
- Get Foil
- Manta Foils
- SiFly
- Pulseer
- Awake
- PWR-Foil
Key Developments in Efoil Boards Industry
- 2023/05: Fliteboard launches the "Ultra L" for enhanced maneuverability and performance, targeting advanced riders.
- 2023/08: Lift Foils introduces the "eFoil Pro," featuring a lighter construction and improved battery efficiency, extending ride times by approximately 20%.
- 2024/01: Waydoo unveils the "Flyer ONE Plus" with an upgraded motor and integrated safety features, aimed at broader consumer appeal.
- 2024/03: Takuma Concept announces strategic partnerships with several international distributors to expand its global reach.
- 2024/06: The "eFoil World Cup" gains traction, fostering competitive efoiling and increasing market visibility.
- 2024/09: Several manufacturers begin integrating advanced GPS tracking and performance analytics into their boards, enhancing user experience.
Strategic Outlook for Efoil Boards Market
The strategic outlook for the Efoil Boards market is exceptionally positive, driven by sustained innovation and increasing consumer interest in unique and sustainable watersports. Future growth will be fueled by advancements in battery technology, leading to longer ride times and reduced charging durations, making efoiling more accessible and practical for extended recreational use. Expansion into new geographic markets and the development of more affordable product lines will further broaden the consumer base. The growth of the rental business sector, coupled with strategic partnerships, will play a crucial role in driving market penetration. Continuous investment in R&D to enhance performance, safety, and user-friendliness will remain paramount for market leaders to maintain their competitive edge and capitalize on the significant growth potential.
Efoil Boards Segmentation
-
1. Application
- 1.1. Entertainment
- 1.2. Rental Business
-
2. Types
- 2.1. Up to 25mph
- 2.2. Up to 35mph
- 2.3. Up to 45mph
Efoil Boards Segmentation By Geography
-
1. North America
- 1.1. United States
- 1.2. Canada
- 1.3. Mexico
-
2. South America
- 2.1. Brazil
- 2.2. Argentina
- 2.3. Rest of South America
-
3. Europe
- 3.1. United Kingdom
- 3.2. Germany
- 3.3. France
- 3.4. Italy
- 3.5. Spain
- 3.6. Russia
- 3.7. Benelux
- 3.8. Nordics
- 3.9. Rest of Europe
-
4. Middle East & Africa
- 4.1. Turkey
- 4.2. Israel
- 4.3. GCC
- 4.4. North Africa
- 4.5. South Africa
- 4.6. Rest of Middle East & Africa
-
5. Asia Pacific
- 5.1. China
- 5.2. India
- 5.3. Japan
- 5.4. South Korea
- 5.5. ASEAN
- 5.6. Oceania
- 5.7. Rest of Asia Pacific
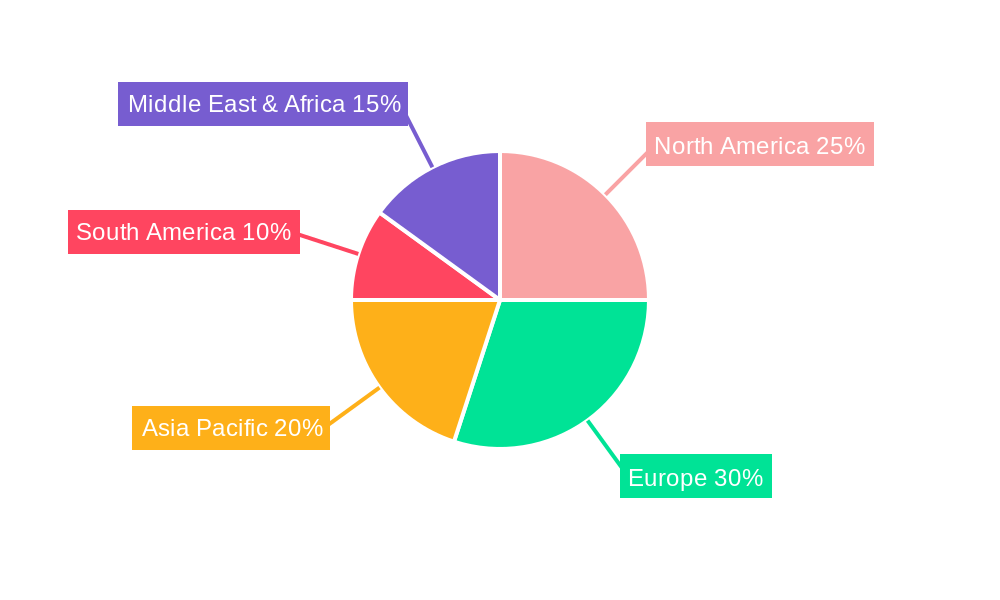
Efoil Boards Regional Market Share
Geographic Coverage of Efoil Boards
Efoil Boards REPORT HIGHLIGHTS
| Aspects | Details |
|---|---|
| Study Period | 2020-2034 |
| Base Year | 2025 |
| Estimated Year | 2026 |
| Forecast Period | 2026-2034 |
| Historical Period | 2020-2025 |
| Growth Rate | CAGR of 10.3% from 2020-2034 |
| Segmentation |
|
Table of Contents
- 1. Introduction
- 1.1. Research Scope
- 1.2. Market Segmentation
- 1.3. Research Methodology
- 1.4. Definitions and Assumptions
- 2. Executive Summary
- 2.1. Introduction
- 3. Market Dynamics
- 3.1. Introduction
- 3.2. Market Drivers
- 3.3. Market Restrains
- 3.4. Market Trends
- 4. Market Factor Analysis
- 4.1. Porters Five Forces
- 4.2. Supply/Value Chain
- 4.3. PESTEL analysis
- 4.4. Market Entropy
- 4.5. Patent/Trademark Analysis
- 5. Global Efoil Boards Analysis, Insights and Forecast, 2020-2032
- 5.1. Market Analysis, Insights and Forecast - by Application
- 5.1.1. Entertainment
- 5.1.2. Rental Business
- 5.2. Market Analysis, Insights and Forecast - by Types
- 5.2.1. Up to 25mph
- 5.2.2. Up to 35mph
- 5.2.3. Up to 45mph
- 5.3. Market Analysis, Insights and Forecast - by Region
- 5.3.1. North America
- 5.3.2. South America
- 5.3.3. Europe
- 5.3.4. Middle East & Africa
- 5.3.5. Asia Pacific
- 5.1. Market Analysis, Insights and Forecast - by Application
- 6. North America Efoil Boards Analysis, Insights and Forecast, 2020-2032
- 6.1. Market Analysis, Insights and Forecast - by Application
- 6.1.1. Entertainment
- 6.1.2. Rental Business
- 6.2. Market Analysis, Insights and Forecast - by Types
- 6.2.1. Up to 25mph
- 6.2.2. Up to 35mph
- 6.2.3. Up to 45mph
- 6.1. Market Analysis, Insights and Forecast - by Application
- 7. South America Efoil Boards Analysis, Insights and Forecast, 2020-2032
- 7.1. Market Analysis, Insights and Forecast - by Application
- 7.1.1. Entertainment
- 7.1.2. Rental Business
- 7.2. Market Analysis, Insights and Forecast - by Types
- 7.2.1. Up to 25mph
- 7.2.2. Up to 35mph
- 7.2.3. Up to 45mph
- 7.1. Market Analysis, Insights and Forecast - by Application
- 8. Europe Efoil Boards Analysis, Insights and Forecast, 2020-2032
- 8.1. Market Analysis, Insights and Forecast - by Application
- 8.1.1. Entertainment
- 8.1.2. Rental Business
- 8.2. Market Analysis, Insights and Forecast - by Types
- 8.2.1. Up to 25mph
- 8.2.2. Up to 35mph
- 8.2.3. Up to 45mph
- 8.1. Market Analysis, Insights and Forecast - by Application
- 9. Middle East & Africa Efoil Boards Analysis, Insights and Forecast, 2020-2032
- 9.1. Market Analysis, Insights and Forecast - by Application
- 9.1.1. Entertainment
- 9.1.2. Rental Business
- 9.2. Market Analysis, Insights and Forecast - by Types
- 9.2.1. Up to 25mph
- 9.2.2. Up to 35mph
- 9.2.3. Up to 45mph
- 9.1. Market Analysis, Insights and Forecast - by Application
- 10. Asia Pacific Efoil Boards Analysis, Insights and Forecast, 2020-2032
- 10.1. Market Analysis, Insights and Forecast - by Application
- 10.1.1. Entertainment
- 10.1.2. Rental Business
- 10.2. Market Analysis, Insights and Forecast - by Types
- 10.2.1. Up to 25mph
- 10.2.2. Up to 35mph
- 10.2.3. Up to 45mph
- 10.1. Market Analysis, Insights and Forecast - by Application
- 11. Competitive Analysis
- 11.1. Global Market Share Analysis 2025
- 11.2. Company Profiles
- 11.2.1 Fliteboard
- 11.2.1.1. Overview
- 11.2.1.2. Products
- 11.2.1.3. SWOT Analysis
- 11.2.1.4. Recent Developments
- 11.2.1.5. Financials (Based on Availability)
- 11.2.2 Lift Foils
- 11.2.2.1. Overview
- 11.2.2.2. Products
- 11.2.2.3. SWOT Analysis
- 11.2.2.4. Recent Developments
- 11.2.2.5. Financials (Based on Availability)
- 11.2.3 Takuma Concept
- 11.2.3.1. Overview
- 11.2.3.2. Products
- 11.2.3.3. SWOT Analysis
- 11.2.3.4. Recent Developments
- 11.2.3.5. Financials (Based on Availability)
- 11.2.4 Waydoo
- 11.2.4.1. Overview
- 11.2.4.2. Products
- 11.2.4.3. SWOT Analysis
- 11.2.4.4. Recent Developments
- 11.2.4.5. Financials (Based on Availability)
- 11.2.5 Torque Jetboards
- 11.2.5.1. Overview
- 11.2.5.2. Products
- 11.2.5.3. SWOT Analysis
- 11.2.5.4. Recent Developments
- 11.2.5.5. Financials (Based on Availability)
- 11.2.6 Kymera
- 11.2.6.1. Overview
- 11.2.6.2. Products
- 11.2.6.3. SWOT Analysis
- 11.2.6.4. Recent Developments
- 11.2.6.5. Financials (Based on Availability)
- 11.2.7 Get Foil
- 11.2.7.1. Overview
- 11.2.7.2. Products
- 11.2.7.3. SWOT Analysis
- 11.2.7.4. Recent Developments
- 11.2.7.5. Financials (Based on Availability)
- 11.2.8 Manta Foils
- 11.2.8.1. Overview
- 11.2.8.2. Products
- 11.2.8.3. SWOT Analysis
- 11.2.8.4. Recent Developments
- 11.2.8.5. Financials (Based on Availability)
- 11.2.9 SiFly
- 11.2.9.1. Overview
- 11.2.9.2. Products
- 11.2.9.3. SWOT Analysis
- 11.2.9.4. Recent Developments
- 11.2.9.5. Financials (Based on Availability)
- 11.2.10 Pulseer
- 11.2.10.1. Overview
- 11.2.10.2. Products
- 11.2.10.3. SWOT Analysis
- 11.2.10.4. Recent Developments
- 11.2.10.5. Financials (Based on Availability)
- 11.2.11 Awake
- 11.2.11.1. Overview
- 11.2.11.2. Products
- 11.2.11.3. SWOT Analysis
- 11.2.11.4. Recent Developments
- 11.2.11.5. Financials (Based on Availability)
- 11.2.12 PWR-Foil
- 11.2.12.1. Overview
- 11.2.12.2. Products
- 11.2.12.3. SWOT Analysis
- 11.2.12.4. Recent Developments
- 11.2.12.5. Financials (Based on Availability)
- 11.2.1 Fliteboard
List of Figures
- Figure 1: Global Efoil Boards Revenue Breakdown (undefined, %) by Region 2025 & 2033
- Figure 2: Global Efoil Boards Volume Breakdown (K, %) by Region 2025 & 2033
- Figure 3: North America Efoil Boards Revenue (undefined), by Application 2025 & 2033
- Figure 4: North America Efoil Boards Volume (K), by Application 2025 & 2033
- Figure 5: North America Efoil Boards Revenue Share (%), by Application 2025 & 2033
- Figure 6: North America Efoil Boards Volume Share (%), by Application 2025 & 2033
- Figure 7: North America Efoil Boards Revenue (undefined), by Types 2025 & 2033
- Figure 8: North America Efoil Boards Volume (K), by Types 2025 & 2033
- Figure 9: North America Efoil Boards Revenue Share (%), by Types 2025 & 2033
- Figure 10: North America Efoil Boards Volume Share (%), by Types 2025 & 2033
- Figure 11: North America Efoil Boards Revenue (undefined), by Country 2025 & 2033
- Figure 12: North America Efoil Boards Volume (K), by Country 2025 & 2033
- Figure 13: North America Efoil Boards Revenue Share (%), by Country 2025 & 2033
- Figure 14: North America Efoil Boards Volume Share (%), by Country 2025 & 2033
- Figure 15: South America Efoil Boards Revenue (undefined), by Application 2025 & 2033
- Figure 16: South America Efoil Boards Volume (K), by Application 2025 & 2033
- Figure 17: South America Efoil Boards Revenue Share (%), by Application 2025 & 2033
- Figure 18: South America Efoil Boards Volume Share (%), by Application 2025 & 2033
- Figure 19: South America Efoil Boards Revenue (undefined), by Types 2025 & 2033
- Figure 20: South America Efoil Boards Volume (K), by Types 2025 & 2033
- Figure 21: South America Efoil Boards Revenue Share (%), by Types 2025 & 2033
- Figure 22: South America Efoil Boards Volume Share (%), by Types 2025 & 2033
- Figure 23: South America Efoil Boards Revenue (undefined), by Country 2025 & 2033
- Figure 24: South America Efoil Boards Volume (K), by Country 2025 & 2033
- Figure 25: South America Efoil Boards Revenue Share (%), by Country 2025 & 2033
- Figure 26: South America Efoil Boards Volume Share (%), by Country 2025 & 2033
- Figure 27: Europe Efoil Boards Revenue (undefined), by Application 2025 & 2033
- Figure 28: Europe Efoil Boards Volume (K), by Application 2025 & 2033
- Figure 29: Europe Efoil Boards Revenue Share (%), by Application 2025 & 2033
- Figure 30: Europe Efoil Boards Volume Share (%), by Application 2025 & 2033
- Figure 31: Europe Efoil Boards Revenue (undefined), by Types 2025 & 2033
- Figure 32: Europe Efoil Boards Volume (K), by Types 2025 & 2033
- Figure 33: Europe Efoil Boards Revenue Share (%), by Types 2025 & 2033
- Figure 34: Europe Efoil Boards Volume Share (%), by Types 2025 & 2033
- Figure 35: Europe Efoil Boards Revenue (undefined), by Country 2025 & 2033
- Figure 36: Europe Efoil Boards Volume (K), by Country 2025 & 2033
- Figure 37: Europe Efoil Boards Revenue Share (%), by Country 2025 & 2033
- Figure 38: Europe Efoil Boards Volume Share (%), by Country 2025 & 2033
- Figure 39: Middle East & Africa Efoil Boards Revenue (undefined), by Application 2025 & 2033
- Figure 40: Middle East & Africa Efoil Boards Volume (K), by Application 2025 & 2033
- Figure 41: Middle East & Africa Efoil Boards Revenue Share (%), by Application 2025 & 2033
- Figure 42: Middle East & Africa Efoil Boards Volume Share (%), by Application 2025 & 2033
- Figure 43: Middle East & Africa Efoil Boards Revenue (undefined), by Types 2025 & 2033
- Figure 44: Middle East & Africa Efoil Boards Volume (K), by Types 2025 & 2033
- Figure 45: Middle East & Africa Efoil Boards Revenue Share (%), by Types 2025 & 2033
- Figure 46: Middle East & Africa Efoil Boards Volume Share (%), by Types 2025 & 2033
- Figure 47: Middle East & Africa Efoil Boards Revenue (undefined), by Country 2025 & 2033
- Figure 48: Middle East & Africa Efoil Boards Volume (K), by Country 2025 & 2033
- Figure 49: Middle East & Africa Efoil Boards Revenue Share (%), by Country 2025 & 2033
- Figure 50: Middle East & Africa Efoil Boards Volume Share (%), by Country 2025 & 2033
- Figure 51: Asia Pacific Efoil Boards Revenue (undefined), by Application 2025 & 2033
- Figure 52: Asia Pacific Efoil Boards Volume (K), by Application 2025 & 2033
- Figure 53: Asia Pacific Efoil Boards Revenue Share (%), by Application 2025 & 2033
- Figure 54: Asia Pacific Efoil Boards Volume Share (%), by Application 2025 & 2033
- Figure 55: Asia Pacific Efoil Boards Revenue (undefined), by Types 2025 & 2033
- Figure 56: Asia Pacific Efoil Boards Volume (K), by Types 2025 & 2033
- Figure 57: Asia Pacific Efoil Boards Revenue Share (%), by Types 2025 & 2033
- Figure 58: Asia Pacific Efoil Boards Volume Share (%), by Types 2025 & 2033
- Figure 59: Asia Pacific Efoil Boards Revenue (undefined), by Country 2025 & 2033
- Figure 60: Asia Pacific Efoil Boards Volume (K), by Country 2025 & 2033
- Figure 61: Asia Pacific Efoil Boards Revenue Share (%), by Country 2025 & 2033
- Figure 62: Asia Pacific Efoil Boards Volume Share (%), by Country 2025 & 2033
List of Tables
- Table 1: Global Efoil Boards Revenue undefined Forecast, by Application 2020 & 2033
- Table 2: Global Efoil Boards Volume K Forecast, by Application 2020 & 2033
- Table 3: Global Efoil Boards Revenue undefined Forecast, by Types 2020 & 2033
- Table 4: Global Efoil Boards Volume K Forecast, by Types 2020 & 2033
- Table 5: Global Efoil Boards Revenue undefined Forecast, by Region 2020 & 2033
- Table 6: Global Efoil Boards Volume K Forecast, by Region 2020 & 2033
- Table 7: Global Efoil Boards Revenue undefined Forecast, by Application 2020 & 2033
- Table 8: Global Efoil Boards Volume K Forecast, by Application 2020 & 2033
- Table 9: Global Efoil Boards Revenue undefined Forecast, by Types 2020 & 2033
- Table 10: Global Efoil Boards Volume K Forecast, by Types 2020 & 2033
- Table 11: Global Efoil Boards Revenue undefined Forecast, by Country 2020 & 2033
- Table 12: Global Efoil Boards Volume K Forecast, by Country 2020 & 2033
- Table 13: United States Efoil Boards Revenue (undefined) Forecast, by Application 2020 & 2033
- Table 14: United States Efoil Boards Volume (K) Forecast, by Application 2020 & 2033
- Table 15: Canada Efoil Boards Revenue (undefined) Forecast, by Application 2020 & 2033
- Table 16: Canada Efoil Boards Volume (K) Forecast, by Application 2020 & 2033
- Table 17: Mexico Efoil Boards Revenue (undefined) Forecast, by Application 2020 & 2033
- Table 18: Mexico Efoil Boards Volume (K) Forecast, by Application 2020 & 2033
- Table 19: Global Efoil Boards Revenue undefined Forecast, by Application 2020 & 2033
- Table 20: Global Efoil Boards Volume K Forecast, by Application 2020 & 2033
- Table 21: Global Efoil Boards Revenue undefined Forecast, by Types 2020 & 2033
- Table 22: Global Efoil Boards Volume K Forecast, by Types 2020 & 2033
- Table 23: Global Efoil Boards Revenue undefined Forecast, by Country 2020 & 2033
- Table 24: Global Efoil Boards Volume K Forecast, by Country 2020 & 2033
- Table 25: Brazil Efoil Boards Revenue (undefined) Forecast, by Application 2020 & 2033
- Table 26: Brazil Efoil Boards Volume (K) Forecast, by Application 2020 & 2033
- Table 27: Argentina Efoil Boards Revenue (undefined) Forecast, by Application 2020 & 2033
- Table 28: Argentina Efoil Boards Volume (K) Forecast, by Application 2020 & 2033
- Table 29: Rest of South America Efoil Boards Revenue (undefined) Forecast, by Application 2020 & 2033
- Table 30: Rest of South America Efoil Boards Volume (K) Forecast, by Application 2020 & 2033
- Table 31: Global Efoil Boards Revenue undefined Forecast, by Application 2020 & 2033
- Table 32: Global Efoil Boards Volume K Forecast, by Application 2020 & 2033
- Table 33: Global Efoil Boards Revenue undefined Forecast, by Types 2020 & 2033
- Table 34: Global Efoil Boards Volume K Forecast, by Types 2020 & 2033
- Table 35: Global Efoil Boards Revenue undefined Forecast, by Country 2020 & 2033
- Table 36: Global Efoil Boards Volume K Forecast, by Country 2020 & 2033
- Table 37: United Kingdom Efoil Boards Revenue (undefined) Forecast, by Application 2020 & 2033
- Table 38: United Kingdom Efoil Boards Volume (K) Forecast, by Application 2020 & 2033
- Table 39: Germany Efoil Boards Revenue (undefined) Forecast, by Application 2020 & 2033
- Table 40: Germany Efoil Boards Volume (K) Forecast, by Application 2020 & 2033
- Table 41: France Efoil Boards Revenue (undefined) Forecast, by Application 2020 & 2033
- Table 42: France Efoil Boards Volume (K) Forecast, by Application 2020 & 2033
- Table 43: Italy Efoil Boards Revenue (undefined) Forecast, by Application 2020 & 2033
- Table 44: Italy Efoil Boards Volume (K) Forecast, by Application 2020 & 2033
- Table 45: Spain Efoil Boards Revenue (undefined) Forecast, by Application 2020 & 2033
- Table 46: Spain Efoil Boards Volume (K) Forecast, by Application 2020 & 2033
- Table 47: Russia Efoil Boards Revenue (undefined) Forecast, by Application 2020 & 2033
- Table 48: Russia Efoil Boards Volume (K) Forecast, by Application 2020 & 2033
- Table 49: Benelux Efoil Boards Revenue (undefined) Forecast, by Application 2020 & 2033
- Table 50: Benelux Efoil Boards Volume (K) Forecast, by Application 2020 & 2033
- Table 51: Nordics Efoil Boards Revenue (undefined) Forecast, by Application 2020 & 2033
- Table 52: Nordics Efoil Boards Volume (K) Forecast, by Application 2020 & 2033
- Table 53: Rest of Europe Efoil Boards Revenue (undefined) Forecast, by Application 2020 & 2033
- Table 54: Rest of Europe Efoil Boards Volume (K) Forecast, by Application 2020 & 2033
- Table 55: Global Efoil Boards Revenue undefined Forecast, by Application 2020 & 2033
- Table 56: Global Efoil Boards Volume K Forecast, by Application 2020 & 2033
- Table 57: Global Efoil Boards Revenue undefined Forecast, by Types 2020 & 2033
- Table 58: Global Efoil Boards Volume K Forecast, by Types 2020 & 2033
- Table 59: Global Efoil Boards Revenue undefined Forecast, by Country 2020 & 2033
- Table 60: Global Efoil Boards Volume K Forecast, by Country 2020 & 2033
- Table 61: Turkey Efoil Boards Revenue (undefined) Forecast, by Application 2020 & 2033
- Table 62: Turkey Efoil Boards Volume (K) Forecast, by Application 2020 & 2033
- Table 63: Israel Efoil Boards Revenue (undefined) Forecast, by Application 2020 & 2033
- Table 64: Israel Efoil Boards Volume (K) Forecast, by Application 2020 & 2033
- Table 65: GCC Efoil Boards Revenue (undefined) Forecast, by Application 2020 & 2033
- Table 66: GCC Efoil Boards Volume (K) Forecast, by Application 2020 & 2033
- Table 67: North Africa Efoil Boards Revenue (undefined) Forecast, by Application 2020 & 2033
- Table 68: North Africa Efoil Boards Volume (K) Forecast, by Application 2020 & 2033
- Table 69: South Africa Efoil Boards Revenue (undefined) Forecast, by Application 2020 & 2033
- Table 70: South Africa Efoil Boards Volume (K) Forecast, by Application 2020 & 2033
- Table 71: Rest of Middle East & Africa Efoil Boards Revenue (undefined) Forecast, by Application 2020 & 2033
- Table 72: Rest of Middle East & Africa Efoil Boards Volume (K) Forecast, by Application 2020 & 2033
- Table 73: Global Efoil Boards Revenue undefined Forecast, by Application 2020 & 2033
- Table 74: Global Efoil Boards Volume K Forecast, by Application 2020 & 2033
- Table 75: Global Efoil Boards Revenue undefined Forecast, by Types 2020 & 2033
- Table 76: Global Efoil Boards Volume K Forecast, by Types 2020 & 2033
- Table 77: Global Efoil Boards Revenue undefined Forecast, by Country 2020 & 2033
- Table 78: Global Efoil Boards Volume K Forecast, by Country 2020 & 2033
- Table 79: China Efoil Boards Revenue (undefined) Forecast, by Application 2020 & 2033
- Table 80: China Efoil Boards Volume (K) Forecast, by Application 2020 & 2033
- Table 81: India Efoil Boards Revenue (undefined) Forecast, by Application 2020 & 2033
- Table 82: India Efoil Boards Volume (K) Forecast, by Application 2020 & 2033
- Table 83: Japan Efoil Boards Revenue (undefined) Forecast, by Application 2020 & 2033
- Table 84: Japan Efoil Boards Volume (K) Forecast, by Application 2020 & 2033
- Table 85: South Korea Efoil Boards Revenue (undefined) Forecast, by Application 2020 & 2033
- Table 86: South Korea Efoil Boards Volume (K) Forecast, by Application 2020 & 2033
- Table 87: ASEAN Efoil Boards Revenue (undefined) Forecast, by Application 2020 & 2033
- Table 88: ASEAN Efoil Boards Volume (K) Forecast, by Application 2020 & 2033
- Table 89: Oceania Efoil Boards Revenue (undefined) Forecast, by Application 2020 & 2033
- Table 90: Oceania Efoil Boards Volume (K) Forecast, by Application 2020 & 2033
- Table 91: Rest of Asia Pacific Efoil Boards Revenue (undefined) Forecast, by Application 2020 & 2033
- Table 92: Rest of Asia Pacific Efoil Boards Volume (K) Forecast, by Application 2020 & 2033
Frequently Asked Questions
1. What is the projected Compound Annual Growth Rate (CAGR) of the Efoil Boards?
The projected CAGR is approximately 10.3%.
2. Which companies are prominent players in the Efoil Boards?
Key companies in the market include Fliteboard, Lift Foils, Takuma Concept, Waydoo, Torque Jetboards, Kymera, Get Foil, Manta Foils, SiFly, Pulseer, Awake, PWR-Foil.
3. What are the main segments of the Efoil Boards?
The market segments include Application, Types.
4. Can you provide details about the market size?
The market size is estimated to be USD XXX N/A as of 2022.
5. What are some drivers contributing to market growth?
N/A
6. What are the notable trends driving market growth?
N/A
7. Are there any restraints impacting market growth?
N/A
8. Can you provide examples of recent developments in the market?
N/A
9. What pricing options are available for accessing the report?
Pricing options include single-user, multi-user, and enterprise licenses priced at USD 4350.00, USD 6525.00, and USD 8700.00 respectively.
10. Is the market size provided in terms of value or volume?
The market size is provided in terms of value, measured in N/A and volume, measured in K.
11. Are there any specific market keywords associated with the report?
Yes, the market keyword associated with the report is "Efoil Boards," which aids in identifying and referencing the specific market segment covered.
12. How do I determine which pricing option suits my needs best?
The pricing options vary based on user requirements and access needs. Individual users may opt for single-user licenses, while businesses requiring broader access may choose multi-user or enterprise licenses for cost-effective access to the report.
13. Are there any additional resources or data provided in the Efoil Boards report?
While the report offers comprehensive insights, it's advisable to review the specific contents or supplementary materials provided to ascertain if additional resources or data are available.
14. How can I stay updated on further developments or reports in the Efoil Boards?
To stay informed about further developments, trends, and reports in the Efoil Boards, consider subscribing to industry newsletters, following relevant companies and organizations, or regularly checking reputable industry news sources and publications.
Methodology
Step 1 - Identification of Relevant Samples Size from Population Database


Step 2 - Approaches for Defining Global Market Size (Value, Volume* & Price*)

Note*: In applicable scenarios
Step 3 - Data Sources
Primary Research
- Web Analytics
- Survey Reports
- Research Institute
- Latest Research Reports
- Opinion Leaders
Secondary Research
- Annual Reports
- White Paper
- Latest Press Release
- Industry Association
- Paid Database
- Investor Presentations

Step 4 - Data Triangulation
Involves using different sources of information in order to increase the validity of a study
These sources are likely to be stakeholders in a program - participants, other researchers, program staff, other community members, and so on.
Then we put all data in single framework & apply various statistical tools to find out the dynamic on the market.
During the analysis stage, feedback from the stakeholder groups would be compared to determine areas of agreement as well as areas of divergence