

Key Insights
The electric skateboard market, while relatively niche, exhibits strong growth potential. The market is driven by increasing consumer preference for eco-friendly and convenient personal transportation solutions, particularly in urban environments. Technological advancements, such as improved battery life, enhanced motor performance, and innovative designs are further fueling market expansion. The rise of e-commerce and online retail channels is also facilitating increased accessibility and sales of electric skateboards. While the initial investment cost can be a deterrent for some consumers, the ongoing trend towards micromobility and the increasing affordability of electric skateboards are expected to mitigate this restraint. The market is segmented by product type (e.g., single-motor, dual-motor), battery capacity, price range, and target user (beginner, intermediate, advanced). Key players like Marbel Technology, Evolve Skateboards, and Boosted Boards are constantly innovating to cater to diverse consumer needs and maintain their competitive edge. The market is seeing a shift towards smarter, connected electric skateboards with features like smartphone integration and GPS tracking.
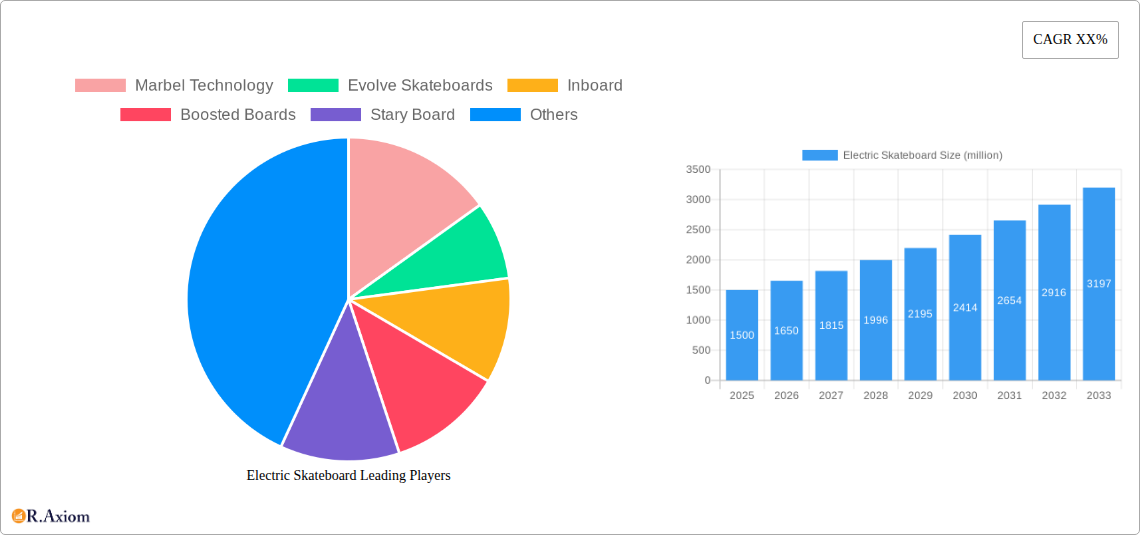
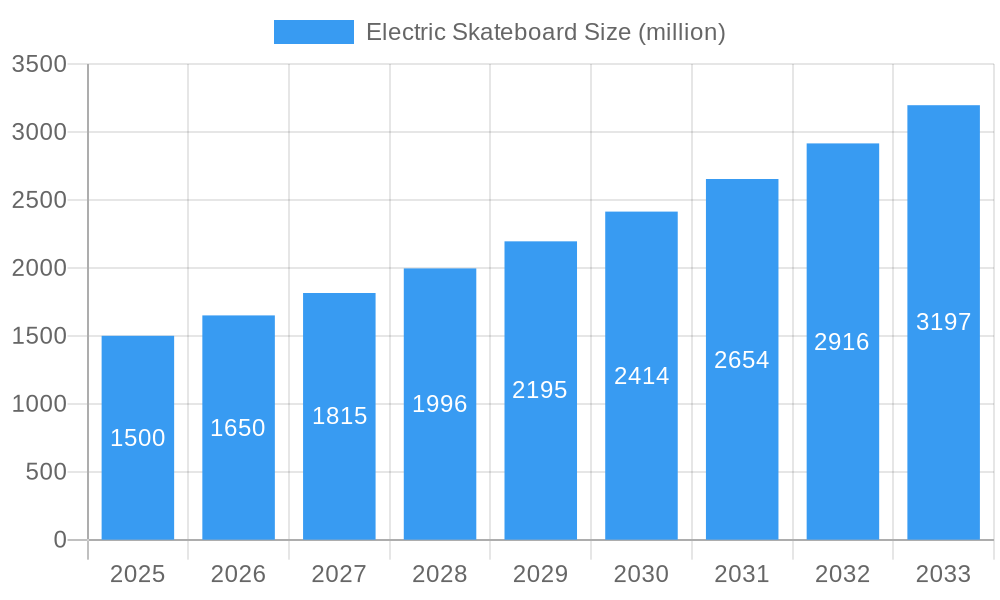
Electric Skateboard Market Size (In Billion)
The forecast period (2025-2033) anticipates sustained growth driven by continued technological improvements and increased consumer adoption. Regional variations in market penetration are expected, with developed nations in North America and Europe leading the way, followed by emerging markets in Asia-Pacific and South America. Factors such as government regulations concerning e-scooter and e-skateboard use, as well as safety concerns, will play a role in shaping future market trends. However, the overall outlook remains positive, with continuous innovation and increasing consumer acceptance projected to propel market expansion throughout the forecast period. Competitive landscape analysis suggests a potential for mergers and acquisitions as established players consolidate their market share and emerging companies strive to make inroads.
Electric Skateboard Company Market Share
Electric Skateboard Market Report: 2019-2033 - A Comprehensive Analysis
This comprehensive report provides an in-depth analysis of the global electric skateboard market, covering the period 2019-2033. The study meticulously examines market dynamics, including market size, growth drivers, challenges, and opportunities. With a base year of 2025 and an estimated year of 2025, this report offers valuable insights for industry stakeholders, investors, and anyone seeking to understand this rapidly evolving sector. The forecast period spans from 2025 to 2033, building upon historical data from 2019-2024. The report features detailed analysis of key players like Marbel Technology, Evolve Skateboards, Inboard, Boosted Boards, Stary Board, Yuneec International, Mellow Board, Zboard, LEIF Tech, Bolt Motion, FiiK, Melonboard, Magneto, and Genesis. The total market value is projected to reach xx million by 2033.
Electric Skateboard Market Concentration & Innovation
The electric skateboard market exhibits a moderately concentrated landscape, with several key players vying for market share. While exact market share figures for individual companies are proprietary, Evolve Skateboards, Boosted Boards (now defunct), and Yuneec International historically held significant portions of the market. However, the market has seen considerable entry and exit of players in the historical period. The reported value of M&A activities within the sector during 2019-2024 totaled approximately xx million, signaling consolidation and strategic shifts within the industry. Innovation is a crucial driver, fueled by advancements in battery technology (longer range, faster charging), motor efficiency, and smart features (connectivity, app integration). Regulatory frameworks concerning safety standards and usage regulations vary across different regions, posing both challenges and opportunities for market expansion. Product substitutes, including traditional skateboards and other forms of micro-mobility, pose ongoing competitive pressure. End-user trends reveal a growing preference for higher performance, durable, and technologically advanced boards.
- Market Concentration: Moderately Concentrated
- Top 3 Players (Historical): Evolve Skateboards, Boosted Boards, Yuneec International (Approximate Market Share: xx%)
- M&A Activity (2019-2024): xx million
- Key Innovation Drivers: Battery Technology, Motor Efficiency, Smart Features
Electric Skateboard Industry Trends & Insights
The global electric skateboard market experienced significant growth during the historical period (2019-2024), driven by increasing consumer adoption, technological advancements, and favorable trends in urban mobility. The CAGR during this period is estimated at xx%. Technological disruptions, particularly in battery technology, have extended range and reduced charging times, enhancing the practicality and appeal of electric skateboards. Consumer preferences are shifting towards higher performance, integrated safety features, and aesthetically pleasing designs. The competitive dynamics are characterized by fierce competition, product differentiation, and continuous innovation. Market penetration remains relatively low compared to other micro-mobility solutions, presenting significant growth opportunities. The projected CAGR for the forecast period (2025-2033) is xx%, indicating sustained growth potential.
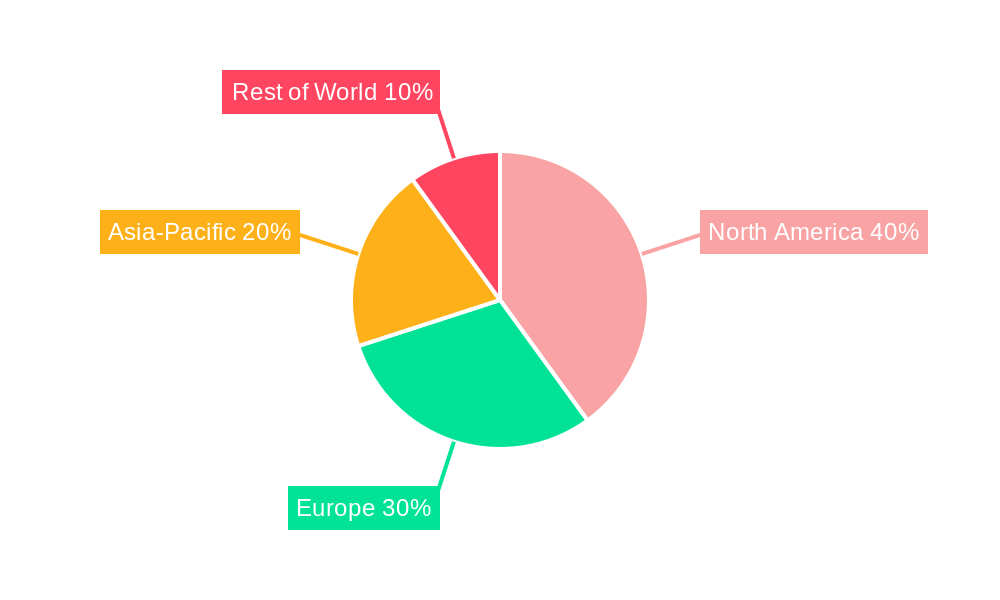
Dominant Markets & Segments in Electric Skateboard
The North American market, particularly the United States, historically dominated the electric skateboard market, driven by strong consumer demand, early adoption of technology, and well-established distribution channels. However, the Asian market, especially China, is predicted to exhibit rapid growth during the forecast period due to the increasing disposable income of the middle class and the growing focus on urban mobility solutions.
- Key Drivers in North America: High disposable income, early adoption of new technologies, established distribution networks.
- Key Drivers in Asia (China): Rising middle class, growing urban populations, government initiatives promoting sustainable transportation.
- Dominant Segment: High-Performance Electric Skateboards
Electric Skateboard Product Developments
Recent product developments focus on enhancing range, speed, safety, and connectivity. We are witnessing improvements in battery technology, leading to longer ride times and faster charging. Integrated safety features, such as regenerative braking and improved suspension systems, are becoming increasingly common. The integration of smart features, including smartphone connectivity and GPS tracking, enhances the user experience. This trend reflects the market's growing demand for advanced, convenient, and safe electric skateboards.
Report Scope & Segmentation Analysis
This report segments the electric skateboard market by product type (e.g., longboard, cruiser, off-road), battery technology (e.g., lithium-ion, lead-acid), price range, and region. Each segment offers distinct growth projections and competitive dynamics. The high-performance segment is expected to witness substantial growth due to its appeal to tech-savvy consumers seeking speed and advanced features. The market for affordable electric skateboards will see steady growth catering to the price-sensitive consumer segment. Geographical segmentation includes North America, Europe, Asia-Pacific, and the Rest of the World, each offering unique market characteristics and growth potentials.
Key Drivers of Electric Skateboard Growth
Several key factors fuel the growth of the electric skateboard market. Technological advancements in battery technology and motor efficiency have increased range and performance. Growing urban populations and increasing congestion are driving the demand for efficient and eco-friendly personal transportation options. Government initiatives promoting sustainable transportation in various regions also contribute significantly to market expansion. The increasing disposable income in emerging markets creates a substantial consumer base for electric skateboards.
Challenges in the Electric Skateboard Sector
The electric skateboard sector faces several challenges. Regulatory uncertainties concerning safety standards and usage restrictions vary across different regions. Supply chain disruptions and the increasing cost of raw materials, especially battery components, can impact production costs and market profitability. Intense competition from established players and new entrants creates pressure on pricing and profit margins. Safety concerns surrounding the use of electric skateboards, particularly related to accidents and injuries, also need to be addressed.
Emerging Opportunities in Electric Skateboard
Emerging markets, particularly in Asia and Latin America, offer significant growth opportunities for electric skateboards. The integration of advanced technologies, such as artificial intelligence and augmented reality, can enhance safety and user experience. The development of electric skateboards with specialized features, such as off-road capabilities or integration with other smart devices, creates new market niches. Sustainable and eco-friendly manufacturing processes are gaining traction among environmentally conscious consumers, presenting opportunities for companies to differentiate themselves.
Leading Players in the Electric Skateboard Market
- Evolve Skateboards
- Inboard
- Boosted Boards (Defunct)
- Stary Board
- Yuneec International
- Mellow Board
- Zboard
- LEIF Tech
- Bolt Motion
- FiiK
- Melonboard
- Magneto
- Genesis
Key Developments in Electric Skateboard Industry
- 2020 Q3: Evolve Skateboards launches a new high-performance electric skateboard with extended range.
- 2021 Q1: Increased regulatory scrutiny on safety standards in Europe.
- 2022 Q2: A major battery supplier announces price increases impacting several manufacturers.
- 2023 Q4: Several companies announced new partnerships with app developers for improved connectivity features.
Strategic Outlook for Electric Skateboard Market
The electric skateboard market is poised for continued growth, driven by technological advancements, rising consumer demand, and supportive government policies. Opportunities exist in expanding into new markets, developing innovative products, and focusing on sustainable manufacturing practices. Companies that can effectively navigate the challenges of regulation, competition, and supply chain disruptions are well-positioned to capitalize on this dynamic market's long-term potential. The overall market is expected to reach xx million by 2033, demonstrating strong future growth.
Electric Skateboard Segmentation
-
1. Application
- 1.1. Online Store
- 1.2. Offline Chain Store
- 1.3. Other
-
2. Types
- 2.1. Maple Deck
- 2.2. Carbon Fiber Composite Deck
- 2.3. Other
Electric Skateboard Segmentation By Geography
-
1. North America
- 1.1. United States
- 1.2. Canada
- 1.3. Mexico
-
2. South America
- 2.1. Brazil
- 2.2. Argentina
- 2.3. Rest of South America
-
3. Europe
- 3.1. United Kingdom
- 3.2. Germany
- 3.3. France
- 3.4. Italy
- 3.5. Spain
- 3.6. Russia
- 3.7. Benelux
- 3.8. Nordics
- 3.9. Rest of Europe
-
4. Middle East & Africa
- 4.1. Turkey
- 4.2. Israel
- 4.3. GCC
- 4.4. North Africa
- 4.5. South Africa
- 4.6. Rest of Middle East & Africa
-
5. Asia Pacific
- 5.1. China
- 5.2. India
- 5.3. Japan
- 5.4. South Korea
- 5.5. ASEAN
- 5.6. Oceania
- 5.7. Rest of Asia Pacific
Electric Skateboard Regional Market Share
Geographic Coverage of Electric Skateboard
Electric Skateboard REPORT HIGHLIGHTS
| Aspects | Details |
|---|---|
| Study Period | 2020-2034 |
| Base Year | 2025 |
| Estimated Year | 2026 |
| Forecast Period | 2026-2034 |
| Historical Period | 2020-2025 |
| Growth Rate | CAGR of XX% from 2020-2034 |
| Segmentation |
|
Table of Contents
- 1. Introduction
- 1.1. Research Scope
- 1.2. Market Segmentation
- 1.3. Research Methodology
- 1.4. Definitions and Assumptions
- 2. Executive Summary
- 2.1. Introduction
- 3. Market Dynamics
- 3.1. Introduction
- 3.2. Market Drivers
- 3.3. Market Restrains
- 3.4. Market Trends
- 4. Market Factor Analysis
- 4.1. Porters Five Forces
- 4.2. Supply/Value Chain
- 4.3. PESTEL analysis
- 4.4. Market Entropy
- 4.5. Patent/Trademark Analysis
- 5. Global Electric Skateboard Analysis, Insights and Forecast, 2020-2032
- 5.1. Market Analysis, Insights and Forecast - by Application
- 5.1.1. Online Store
- 5.1.2. Offline Chain Store
- 5.1.3. Other
- 5.2. Market Analysis, Insights and Forecast - by Types
- 5.2.1. Maple Deck
- 5.2.2. Carbon Fiber Composite Deck
- 5.2.3. Other
- 5.3. Market Analysis, Insights and Forecast - by Region
- 5.3.1. North America
- 5.3.2. South America
- 5.3.3. Europe
- 5.3.4. Middle East & Africa
- 5.3.5. Asia Pacific
- 5.1. Market Analysis, Insights and Forecast - by Application
- 6. North America Electric Skateboard Analysis, Insights and Forecast, 2020-2032
- 6.1. Market Analysis, Insights and Forecast - by Application
- 6.1.1. Online Store
- 6.1.2. Offline Chain Store
- 6.1.3. Other
- 6.2. Market Analysis, Insights and Forecast - by Types
- 6.2.1. Maple Deck
- 6.2.2. Carbon Fiber Composite Deck
- 6.2.3. Other
- 6.1. Market Analysis, Insights and Forecast - by Application
- 7. South America Electric Skateboard Analysis, Insights and Forecast, 2020-2032
- 7.1. Market Analysis, Insights and Forecast - by Application
- 7.1.1. Online Store
- 7.1.2. Offline Chain Store
- 7.1.3. Other
- 7.2. Market Analysis, Insights and Forecast - by Types
- 7.2.1. Maple Deck
- 7.2.2. Carbon Fiber Composite Deck
- 7.2.3. Other
- 7.1. Market Analysis, Insights and Forecast - by Application
- 8. Europe Electric Skateboard Analysis, Insights and Forecast, 2020-2032
- 8.1. Market Analysis, Insights and Forecast - by Application
- 8.1.1. Online Store
- 8.1.2. Offline Chain Store
- 8.1.3. Other
- 8.2. Market Analysis, Insights and Forecast - by Types
- 8.2.1. Maple Deck
- 8.2.2. Carbon Fiber Composite Deck
- 8.2.3. Other
- 8.1. Market Analysis, Insights and Forecast - by Application
- 9. Middle East & Africa Electric Skateboard Analysis, Insights and Forecast, 2020-2032
- 9.1. Market Analysis, Insights and Forecast - by Application
- 9.1.1. Online Store
- 9.1.2. Offline Chain Store
- 9.1.3. Other
- 9.2. Market Analysis, Insights and Forecast - by Types
- 9.2.1. Maple Deck
- 9.2.2. Carbon Fiber Composite Deck
- 9.2.3. Other
- 9.1. Market Analysis, Insights and Forecast - by Application
- 10. Asia Pacific Electric Skateboard Analysis, Insights and Forecast, 2020-2032
- 10.1. Market Analysis, Insights and Forecast - by Application
- 10.1.1. Online Store
- 10.1.2. Offline Chain Store
- 10.1.3. Other
- 10.2. Market Analysis, Insights and Forecast - by Types
- 10.2.1. Maple Deck
- 10.2.2. Carbon Fiber Composite Deck
- 10.2.3. Other
- 10.1. Market Analysis, Insights and Forecast - by Application
- 11. Competitive Analysis
- 11.1. Global Market Share Analysis 2025
- 11.2. Company Profiles
- 11.2.1 Marbel Technology
- 11.2.1.1. Overview
- 11.2.1.2. Products
- 11.2.1.3. SWOT Analysis
- 11.2.1.4. Recent Developments
- 11.2.1.5. Financials (Based on Availability)
- 11.2.2 Evolve Skateboards
- 11.2.2.1. Overview
- 11.2.2.2. Products
- 11.2.2.3. SWOT Analysis
- 11.2.2.4. Recent Developments
- 11.2.2.5. Financials (Based on Availability)
- 11.2.3 Inboard
- 11.2.3.1. Overview
- 11.2.3.2. Products
- 11.2.3.3. SWOT Analysis
- 11.2.3.4. Recent Developments
- 11.2.3.5. Financials (Based on Availability)
- 11.2.4 Boosted Boards
- 11.2.4.1. Overview
- 11.2.4.2. Products
- 11.2.4.3. SWOT Analysis
- 11.2.4.4. Recent Developments
- 11.2.4.5. Financials (Based on Availability)
- 11.2.5 Stary Board
- 11.2.5.1. Overview
- 11.2.5.2. Products
- 11.2.5.3. SWOT Analysis
- 11.2.5.4. Recent Developments
- 11.2.5.5. Financials (Based on Availability)
- 11.2.6 Yuneec International
- 11.2.6.1. Overview
- 11.2.6.2. Products
- 11.2.6.3. SWOT Analysis
- 11.2.6.4. Recent Developments
- 11.2.6.5. Financials (Based on Availability)
- 11.2.7 Mellow Board
- 11.2.7.1. Overview
- 11.2.7.2. Products
- 11.2.7.3. SWOT Analysis
- 11.2.7.4. Recent Developments
- 11.2.7.5. Financials (Based on Availability)
- 11.2.8 Zboard
- 11.2.8.1. Overview
- 11.2.8.2. Products
- 11.2.8.3. SWOT Analysis
- 11.2.8.4. Recent Developments
- 11.2.8.5. Financials (Based on Availability)
- 11.2.9 LEIF Tech
- 11.2.9.1. Overview
- 11.2.9.2. Products
- 11.2.9.3. SWOT Analysis
- 11.2.9.4. Recent Developments
- 11.2.9.5. Financials (Based on Availability)
- 11.2.10 Bolt Motion
- 11.2.10.1. Overview
- 11.2.10.2. Products
- 11.2.10.3. SWOT Analysis
- 11.2.10.4. Recent Developments
- 11.2.10.5. Financials (Based on Availability)
- 11.2.11 FiiK
- 11.2.11.1. Overview
- 11.2.11.2. Products
- 11.2.11.3. SWOT Analysis
- 11.2.11.4. Recent Developments
- 11.2.11.5. Financials (Based on Availability)
- 11.2.12 Melonboard
- 11.2.12.1. Overview
- 11.2.12.2. Products
- 11.2.12.3. SWOT Analysis
- 11.2.12.4. Recent Developments
- 11.2.12.5. Financials (Based on Availability)
- 11.2.13 Magneto
- 11.2.13.1. Overview
- 11.2.13.2. Products
- 11.2.13.3. SWOT Analysis
- 11.2.13.4. Recent Developments
- 11.2.13.5. Financials (Based on Availability)
- 11.2.14 Genesis
- 11.2.14.1. Overview
- 11.2.14.2. Products
- 11.2.14.3. SWOT Analysis
- 11.2.14.4. Recent Developments
- 11.2.14.5. Financials (Based on Availability)
- 11.2.1 Marbel Technology
List of Figures
- Figure 1: Global Electric Skateboard Revenue Breakdown (million, %) by Region 2025 & 2033
- Figure 2: Global Electric Skateboard Volume Breakdown (K, %) by Region 2025 & 2033
- Figure 3: North America Electric Skateboard Revenue (million), by Application 2025 & 2033
- Figure 4: North America Electric Skateboard Volume (K), by Application 2025 & 2033
- Figure 5: North America Electric Skateboard Revenue Share (%), by Application 2025 & 2033
- Figure 6: North America Electric Skateboard Volume Share (%), by Application 2025 & 2033
- Figure 7: North America Electric Skateboard Revenue (million), by Types 2025 & 2033
- Figure 8: North America Electric Skateboard Volume (K), by Types 2025 & 2033
- Figure 9: North America Electric Skateboard Revenue Share (%), by Types 2025 & 2033
- Figure 10: North America Electric Skateboard Volume Share (%), by Types 2025 & 2033
- Figure 11: North America Electric Skateboard Revenue (million), by Country 2025 & 2033
- Figure 12: North America Electric Skateboard Volume (K), by Country 2025 & 2033
- Figure 13: North America Electric Skateboard Revenue Share (%), by Country 2025 & 2033
- Figure 14: North America Electric Skateboard Volume Share (%), by Country 2025 & 2033
- Figure 15: South America Electric Skateboard Revenue (million), by Application 2025 & 2033
- Figure 16: South America Electric Skateboard Volume (K), by Application 2025 & 2033
- Figure 17: South America Electric Skateboard Revenue Share (%), by Application 2025 & 2033
- Figure 18: South America Electric Skateboard Volume Share (%), by Application 2025 & 2033
- Figure 19: South America Electric Skateboard Revenue (million), by Types 2025 & 2033
- Figure 20: South America Electric Skateboard Volume (K), by Types 2025 & 2033
- Figure 21: South America Electric Skateboard Revenue Share (%), by Types 2025 & 2033
- Figure 22: South America Electric Skateboard Volume Share (%), by Types 2025 & 2033
- Figure 23: South America Electric Skateboard Revenue (million), by Country 2025 & 2033
- Figure 24: South America Electric Skateboard Volume (K), by Country 2025 & 2033
- Figure 25: South America Electric Skateboard Revenue Share (%), by Country 2025 & 2033
- Figure 26: South America Electric Skateboard Volume Share (%), by Country 2025 & 2033
- Figure 27: Europe Electric Skateboard Revenue (million), by Application 2025 & 2033
- Figure 28: Europe Electric Skateboard Volume (K), by Application 2025 & 2033
- Figure 29: Europe Electric Skateboard Revenue Share (%), by Application 2025 & 2033
- Figure 30: Europe Electric Skateboard Volume Share (%), by Application 2025 & 2033
- Figure 31: Europe Electric Skateboard Revenue (million), by Types 2025 & 2033
- Figure 32: Europe Electric Skateboard Volume (K), by Types 2025 & 2033
- Figure 33: Europe Electric Skateboard Revenue Share (%), by Types 2025 & 2033
- Figure 34: Europe Electric Skateboard Volume Share (%), by Types 2025 & 2033
- Figure 35: Europe Electric Skateboard Revenue (million), by Country 2025 & 2033
- Figure 36: Europe Electric Skateboard Volume (K), by Country 2025 & 2033
- Figure 37: Europe Electric Skateboard Revenue Share (%), by Country 2025 & 2033
- Figure 38: Europe Electric Skateboard Volume Share (%), by Country 2025 & 2033
- Figure 39: Middle East & Africa Electric Skateboard Revenue (million), by Application 2025 & 2033
- Figure 40: Middle East & Africa Electric Skateboard Volume (K), by Application 2025 & 2033
- Figure 41: Middle East & Africa Electric Skateboard Revenue Share (%), by Application 2025 & 2033
- Figure 42: Middle East & Africa Electric Skateboard Volume Share (%), by Application 2025 & 2033
- Figure 43: Middle East & Africa Electric Skateboard Revenue (million), by Types 2025 & 2033
- Figure 44: Middle East & Africa Electric Skateboard Volume (K), by Types 2025 & 2033
- Figure 45: Middle East & Africa Electric Skateboard Revenue Share (%), by Types 2025 & 2033
- Figure 46: Middle East & Africa Electric Skateboard Volume Share (%), by Types 2025 & 2033
- Figure 47: Middle East & Africa Electric Skateboard Revenue (million), by Country 2025 & 2033
- Figure 48: Middle East & Africa Electric Skateboard Volume (K), by Country 2025 & 2033
- Figure 49: Middle East & Africa Electric Skateboard Revenue Share (%), by Country 2025 & 2033
- Figure 50: Middle East & Africa Electric Skateboard Volume Share (%), by Country 2025 & 2033
- Figure 51: Asia Pacific Electric Skateboard Revenue (million), by Application 2025 & 2033
- Figure 52: Asia Pacific Electric Skateboard Volume (K), by Application 2025 & 2033
- Figure 53: Asia Pacific Electric Skateboard Revenue Share (%), by Application 2025 & 2033
- Figure 54: Asia Pacific Electric Skateboard Volume Share (%), by Application 2025 & 2033
- Figure 55: Asia Pacific Electric Skateboard Revenue (million), by Types 2025 & 2033
- Figure 56: Asia Pacific Electric Skateboard Volume (K), by Types 2025 & 2033
- Figure 57: Asia Pacific Electric Skateboard Revenue Share (%), by Types 2025 & 2033
- Figure 58: Asia Pacific Electric Skateboard Volume Share (%), by Types 2025 & 2033
- Figure 59: Asia Pacific Electric Skateboard Revenue (million), by Country 2025 & 2033
- Figure 60: Asia Pacific Electric Skateboard Volume (K), by Country 2025 & 2033
- Figure 61: Asia Pacific Electric Skateboard Revenue Share (%), by Country 2025 & 2033
- Figure 62: Asia Pacific Electric Skateboard Volume Share (%), by Country 2025 & 2033
List of Tables
- Table 1: Global Electric Skateboard Revenue million Forecast, by Application 2020 & 2033
- Table 2: Global Electric Skateboard Volume K Forecast, by Application 2020 & 2033
- Table 3: Global Electric Skateboard Revenue million Forecast, by Types 2020 & 2033
- Table 4: Global Electric Skateboard Volume K Forecast, by Types 2020 & 2033
- Table 5: Global Electric Skateboard Revenue million Forecast, by Region 2020 & 2033
- Table 6: Global Electric Skateboard Volume K Forecast, by Region 2020 & 2033
- Table 7: Global Electric Skateboard Revenue million Forecast, by Application 2020 & 2033
- Table 8: Global Electric Skateboard Volume K Forecast, by Application 2020 & 2033
- Table 9: Global Electric Skateboard Revenue million Forecast, by Types 2020 & 2033
- Table 10: Global Electric Skateboard Volume K Forecast, by Types 2020 & 2033
- Table 11: Global Electric Skateboard Revenue million Forecast, by Country 2020 & 2033
- Table 12: Global Electric Skateboard Volume K Forecast, by Country 2020 & 2033
- Table 13: United States Electric Skateboard Revenue (million) Forecast, by Application 2020 & 2033
- Table 14: United States Electric Skateboard Volume (K) Forecast, by Application 2020 & 2033
- Table 15: Canada Electric Skateboard Revenue (million) Forecast, by Application 2020 & 2033
- Table 16: Canada Electric Skateboard Volume (K) Forecast, by Application 2020 & 2033
- Table 17: Mexico Electric Skateboard Revenue (million) Forecast, by Application 2020 & 2033
- Table 18: Mexico Electric Skateboard Volume (K) Forecast, by Application 2020 & 2033
- Table 19: Global Electric Skateboard Revenue million Forecast, by Application 2020 & 2033
- Table 20: Global Electric Skateboard Volume K Forecast, by Application 2020 & 2033
- Table 21: Global Electric Skateboard Revenue million Forecast, by Types 2020 & 2033
- Table 22: Global Electric Skateboard Volume K Forecast, by Types 2020 & 2033
- Table 23: Global Electric Skateboard Revenue million Forecast, by Country 2020 & 2033
- Table 24: Global Electric Skateboard Volume K Forecast, by Country 2020 & 2033
- Table 25: Brazil Electric Skateboard Revenue (million) Forecast, by Application 2020 & 2033
- Table 26: Brazil Electric Skateboard Volume (K) Forecast, by Application 2020 & 2033
- Table 27: Argentina Electric Skateboard Revenue (million) Forecast, by Application 2020 & 2033
- Table 28: Argentina Electric Skateboard Volume (K) Forecast, by Application 2020 & 2033
- Table 29: Rest of South America Electric Skateboard Revenue (million) Forecast, by Application 2020 & 2033
- Table 30: Rest of South America Electric Skateboard Volume (K) Forecast, by Application 2020 & 2033
- Table 31: Global Electric Skateboard Revenue million Forecast, by Application 2020 & 2033
- Table 32: Global Electric Skateboard Volume K Forecast, by Application 2020 & 2033
- Table 33: Global Electric Skateboard Revenue million Forecast, by Types 2020 & 2033
- Table 34: Global Electric Skateboard Volume K Forecast, by Types 2020 & 2033
- Table 35: Global Electric Skateboard Revenue million Forecast, by Country 2020 & 2033
- Table 36: Global Electric Skateboard Volume K Forecast, by Country 2020 & 2033
- Table 37: United Kingdom Electric Skateboard Revenue (million) Forecast, by Application 2020 & 2033
- Table 38: United Kingdom Electric Skateboard Volume (K) Forecast, by Application 2020 & 2033
- Table 39: Germany Electric Skateboard Revenue (million) Forecast, by Application 2020 & 2033
- Table 40: Germany Electric Skateboard Volume (K) Forecast, by Application 2020 & 2033
- Table 41: France Electric Skateboard Revenue (million) Forecast, by Application 2020 & 2033
- Table 42: France Electric Skateboard Volume (K) Forecast, by Application 2020 & 2033
- Table 43: Italy Electric Skateboard Revenue (million) Forecast, by Application 2020 & 2033
- Table 44: Italy Electric Skateboard Volume (K) Forecast, by Application 2020 & 2033
- Table 45: Spain Electric Skateboard Revenue (million) Forecast, by Application 2020 & 2033
- Table 46: Spain Electric Skateboard Volume (K) Forecast, by Application 2020 & 2033
- Table 47: Russia Electric Skateboard Revenue (million) Forecast, by Application 2020 & 2033
- Table 48: Russia Electric Skateboard Volume (K) Forecast, by Application 2020 & 2033
- Table 49: Benelux Electric Skateboard Revenue (million) Forecast, by Application 2020 & 2033
- Table 50: Benelux Electric Skateboard Volume (K) Forecast, by Application 2020 & 2033
- Table 51: Nordics Electric Skateboard Revenue (million) Forecast, by Application 2020 & 2033
- Table 52: Nordics Electric Skateboard Volume (K) Forecast, by Application 2020 & 2033
- Table 53: Rest of Europe Electric Skateboard Revenue (million) Forecast, by Application 2020 & 2033
- Table 54: Rest of Europe Electric Skateboard Volume (K) Forecast, by Application 2020 & 2033
- Table 55: Global Electric Skateboard Revenue million Forecast, by Application 2020 & 2033
- Table 56: Global Electric Skateboard Volume K Forecast, by Application 2020 & 2033
- Table 57: Global Electric Skateboard Revenue million Forecast, by Types 2020 & 2033
- Table 58: Global Electric Skateboard Volume K Forecast, by Types 2020 & 2033
- Table 59: Global Electric Skateboard Revenue million Forecast, by Country 2020 & 2033
- Table 60: Global Electric Skateboard Volume K Forecast, by Country 2020 & 2033
- Table 61: Turkey Electric Skateboard Revenue (million) Forecast, by Application 2020 & 2033
- Table 62: Turkey Electric Skateboard Volume (K) Forecast, by Application 2020 & 2033
- Table 63: Israel Electric Skateboard Revenue (million) Forecast, by Application 2020 & 2033
- Table 64: Israel Electric Skateboard Volume (K) Forecast, by Application 2020 & 2033
- Table 65: GCC Electric Skateboard Revenue (million) Forecast, by Application 2020 & 2033
- Table 66: GCC Electric Skateboard Volume (K) Forecast, by Application 2020 & 2033
- Table 67: North Africa Electric Skateboard Revenue (million) Forecast, by Application 2020 & 2033
- Table 68: North Africa Electric Skateboard Volume (K) Forecast, by Application 2020 & 2033
- Table 69: South Africa Electric Skateboard Revenue (million) Forecast, by Application 2020 & 2033
- Table 70: South Africa Electric Skateboard Volume (K) Forecast, by Application 2020 & 2033
- Table 71: Rest of Middle East & Africa Electric Skateboard Revenue (million) Forecast, by Application 2020 & 2033
- Table 72: Rest of Middle East & Africa Electric Skateboard Volume (K) Forecast, by Application 2020 & 2033
- Table 73: Global Electric Skateboard Revenue million Forecast, by Application 2020 & 2033
- Table 74: Global Electric Skateboard Volume K Forecast, by Application 2020 & 2033
- Table 75: Global Electric Skateboard Revenue million Forecast, by Types 2020 & 2033
- Table 76: Global Electric Skateboard Volume K Forecast, by Types 2020 & 2033
- Table 77: Global Electric Skateboard Revenue million Forecast, by Country 2020 & 2033
- Table 78: Global Electric Skateboard Volume K Forecast, by Country 2020 & 2033
- Table 79: China Electric Skateboard Revenue (million) Forecast, by Application 2020 & 2033
- Table 80: China Electric Skateboard Volume (K) Forecast, by Application 2020 & 2033
- Table 81: India Electric Skateboard Revenue (million) Forecast, by Application 2020 & 2033
- Table 82: India Electric Skateboard Volume (K) Forecast, by Application 2020 & 2033
- Table 83: Japan Electric Skateboard Revenue (million) Forecast, by Application 2020 & 2033
- Table 84: Japan Electric Skateboard Volume (K) Forecast, by Application 2020 & 2033
- Table 85: South Korea Electric Skateboard Revenue (million) Forecast, by Application 2020 & 2033
- Table 86: South Korea Electric Skateboard Volume (K) Forecast, by Application 2020 & 2033
- Table 87: ASEAN Electric Skateboard Revenue (million) Forecast, by Application 2020 & 2033
- Table 88: ASEAN Electric Skateboard Volume (K) Forecast, by Application 2020 & 2033
- Table 89: Oceania Electric Skateboard Revenue (million) Forecast, by Application 2020 & 2033
- Table 90: Oceania Electric Skateboard Volume (K) Forecast, by Application 2020 & 2033
- Table 91: Rest of Asia Pacific Electric Skateboard Revenue (million) Forecast, by Application 2020 & 2033
- Table 92: Rest of Asia Pacific Electric Skateboard Volume (K) Forecast, by Application 2020 & 2033
Frequently Asked Questions
1. What is the projected Compound Annual Growth Rate (CAGR) of the Electric Skateboard?
The projected CAGR is approximately XX%.
2. Which companies are prominent players in the Electric Skateboard?
Key companies in the market include Marbel Technology, Evolve Skateboards, Inboard, Boosted Boards, Stary Board, Yuneec International, Mellow Board, Zboard, LEIF Tech, Bolt Motion, FiiK, Melonboard, Magneto, Genesis.
3. What are the main segments of the Electric Skateboard?
The market segments include Application, Types.
4. Can you provide details about the market size?
The market size is estimated to be USD XXX million as of 2022.
5. What are some drivers contributing to market growth?
N/A
6. What are the notable trends driving market growth?
N/A
7. Are there any restraints impacting market growth?
N/A
8. Can you provide examples of recent developments in the market?
N/A
9. What pricing options are available for accessing the report?
Pricing options include single-user, multi-user, and enterprise licenses priced at USD 3350.00, USD 5025.00, and USD 6700.00 respectively.
10. Is the market size provided in terms of value or volume?
The market size is provided in terms of value, measured in million and volume, measured in K.
11. Are there any specific market keywords associated with the report?
Yes, the market keyword associated with the report is "Electric Skateboard," which aids in identifying and referencing the specific market segment covered.
12. How do I determine which pricing option suits my needs best?
The pricing options vary based on user requirements and access needs. Individual users may opt for single-user licenses, while businesses requiring broader access may choose multi-user or enterprise licenses for cost-effective access to the report.
13. Are there any additional resources or data provided in the Electric Skateboard report?
While the report offers comprehensive insights, it's advisable to review the specific contents or supplementary materials provided to ascertain if additional resources or data are available.
14. How can I stay updated on further developments or reports in the Electric Skateboard?
To stay informed about further developments, trends, and reports in the Electric Skateboard, consider subscribing to industry newsletters, following relevant companies and organizations, or regularly checking reputable industry news sources and publications.
Methodology
Step 1 - Identification of Relevant Samples Size from Population Database


Step 2 - Approaches for Defining Global Market Size (Value, Volume* & Price*)

Note*: In applicable scenarios
Step 3 - Data Sources
Primary Research
- Web Analytics
- Survey Reports
- Research Institute
- Latest Research Reports
- Opinion Leaders
Secondary Research
- Annual Reports
- White Paper
- Latest Press Release
- Industry Association
- Paid Database
- Investor Presentations

Step 4 - Data Triangulation
Involves using different sources of information in order to increase the validity of a study
These sources are likely to be stakeholders in a program - participants, other researchers, program staff, other community members, and so on.
Then we put all data in single framework & apply various statistical tools to find out the dynamic on the market.
During the analysis stage, feedback from the stakeholder groups would be compared to determine areas of agreement as well as areas of divergence