Key Insights
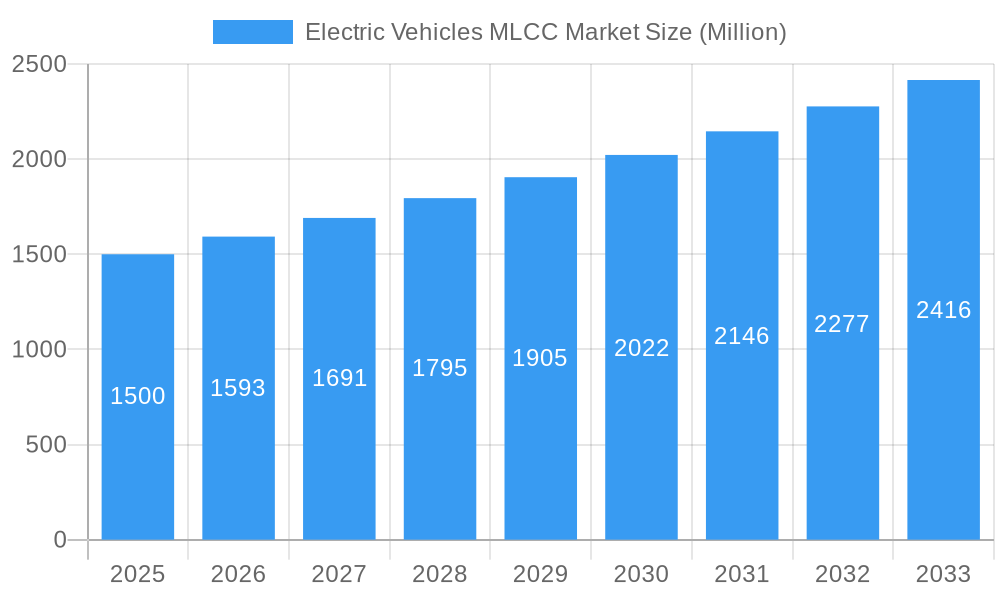
The Electric Vehicles (EV) Multilayer Ceramic Capacitor (MLCC) market is experiencing robust growth, driven by the surging demand for electric vehicles globally. The market's Compound Annual Growth Rate (CAGR) of 5.91% from 2019 to 2024 indicates a significant upward trajectory, projected to continue into the forecast period (2025-2033). This growth is fueled by several key factors. Firstly, the increasing adoption of EVs due to environmental concerns and government incentives is directly translating into higher demand for MLCCs, which are crucial components in EV powertrains, inverters, and onboard chargers. Secondly, advancements in EV technology, such as the development of higher-voltage systems and increased energy density batteries, are necessitating the use of more sophisticated and higher-capacity MLCCs. This trend is further amplified by the miniaturization of electronic components in EVs, pushing for smaller, yet more efficient MLCCs. The market segmentation reveals significant opportunities across various case sizes, voltages, and capacitances. The preference for specific dielectric types further shapes the market landscape, with Class 1 and Class 2 materials catering to diverse application requirements. While challenges remain, such as supply chain constraints and material costs, the overall market outlook for EV MLCCs remains optimistic, with continuous innovation and increasing demand set to propel significant growth in the coming years. Major players, including Vishay Intertechnology, Kyocera AVX, and Murata Manufacturing, are actively engaged in expanding their production capacities and developing advanced MLCC technologies to meet the burgeoning market demands.
Electric Vehicles MLCC Market Market Size (In Billion)
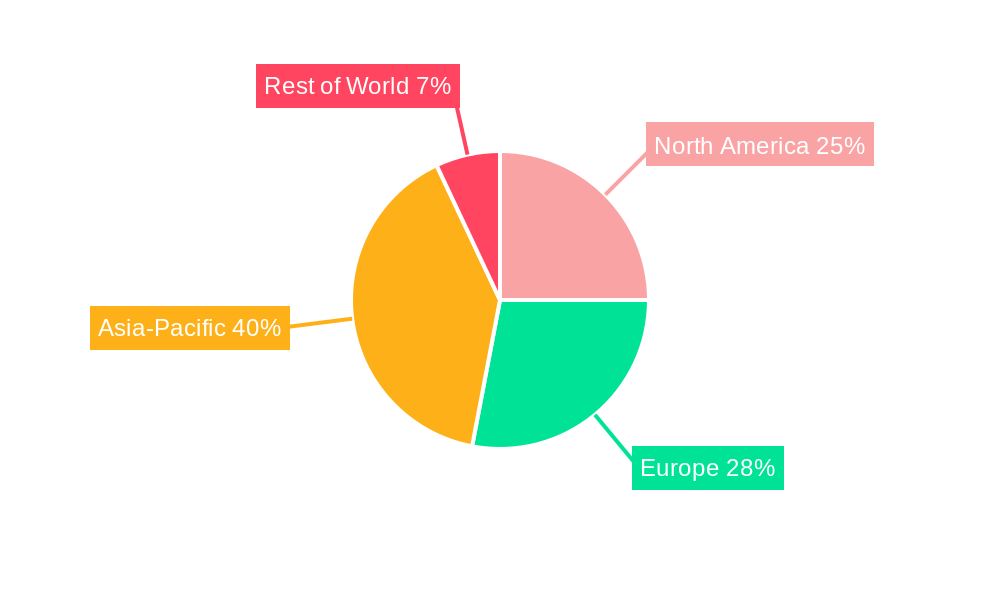
The competitive landscape is characterized by a mix of established industry giants and smaller specialized manufacturers. The geographical distribution of the market is expected to be broadly spread, with North America, Europe, and Asia-Pacific representing significant regional markets. However, the rapidly expanding EV industry in Asia-Pacific is likely to drive substantial growth in that region. The ongoing research and development efforts focused on improving MLCC performance parameters—such as temperature stability, reliability, and miniaturization—will shape future market dynamics. The integration of smart functionalities and advanced materials in MLCCs further enhances their appeal in the demanding environment of electric vehicles. Overall, the EV MLCC market presents compelling investment opportunities for companies that can effectively navigate the evolving technological landscape and meet the stringent quality and reliability standards demanded by the automotive industry.
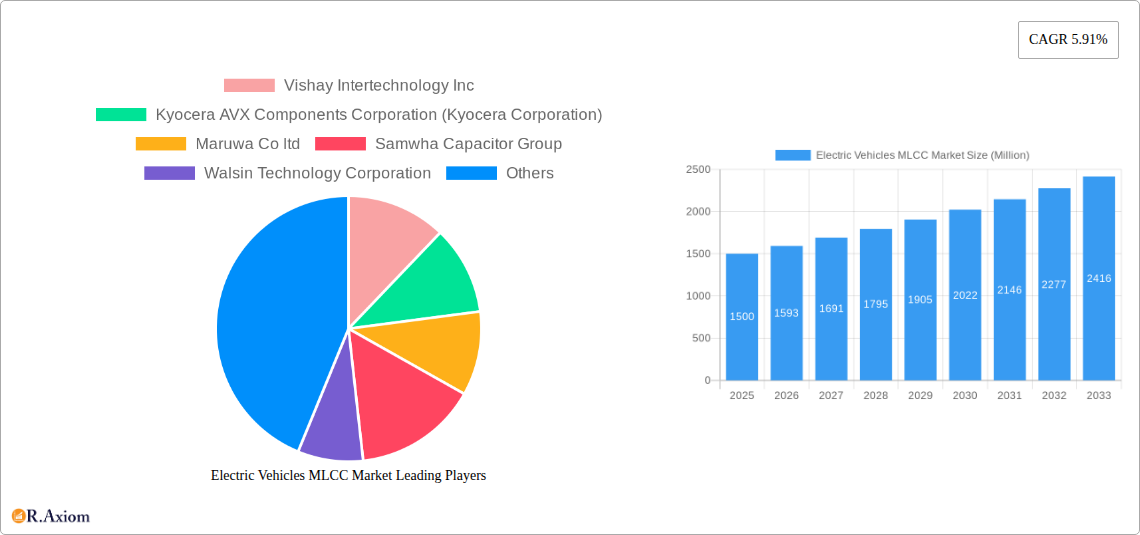
Electric Vehicles MLCC Market Company Market Share
Electric Vehicles MLCC Market: A Comprehensive Report (2019-2033)
This in-depth report provides a comprehensive analysis of the Electric Vehicles MLCC (Multilayer Ceramic Capacitor) market, offering invaluable insights for stakeholders across the industry. The report covers the period from 2019 to 2033, with a focus on market segmentation, key players, technological advancements, and future growth projections. The analysis incorporates data from the historical period (2019-2024), the base year (2025), and the forecast period (2025-2033), providing a robust understanding of market dynamics. The total market size is estimated to reach xx Million by 2033.
Electric Vehicles MLCC Market Concentration & Innovation
The Electric Vehicles MLCC market exhibits a moderately concentrated landscape, with several major players holding significant market share. The top ten companies – including Vishay Intertechnology Inc, Kyocera AVX Components Corporation (Kyocera Corporation), Murata Manufacturing Co Ltd, TDK Corporation, Samsung Electro-Mechanics, Taiyo Yuden Co Ltd, Yageo Corporation, Würth Elektronik GmbH & Co KG, Samwha Capacitor Group, and Walsin Technology Corporation – control approximately xx% of the global market. Competition is intense, driven by ongoing innovation in material science, miniaturization, and improved performance characteristics.
- Market Share: Murata Manufacturing Co Ltd and TDK Corporation are estimated to hold the largest market share individually, each exceeding xx%, while other players hold a smaller but still significant percentage.
- M&A Activities: The market has witnessed several mergers and acquisitions in recent years, primarily focused on expanding product portfolios and geographical reach. The total value of these deals is estimated at xx Million over the past five years. Strategic alliances and joint ventures are also common, reflecting the collaborative nature of technological advancements in this sector.
- Innovation Drivers: The demand for higher energy density, improved efficiency, and enhanced reliability in EVs is driving innovation in MLCC technology. Research and development efforts are focused on developing smaller, higher-voltage, and higher-capacitance MLCCs tailored to the specific needs of electric vehicle powertrains and ancillary systems.
- Regulatory Frameworks: Stringent automotive safety standards and environmental regulations are influencing the design and manufacturing of MLCCs for EVs. This includes stricter quality control measures, certifications, and compliance requirements.
- Product Substitutes: While MLCCs currently dominate the market, alternative capacitor technologies are under development. However, the established performance and cost advantages of MLCCs are expected to maintain their market dominance in the foreseeable future.
- End-User Trends: The global shift towards electric mobility is the primary driver of market growth, with the demand for EVs projected to significantly increase in the coming years. The push for higher energy density in batteries translates into a corresponding need for improved power electronics components, including MLCCs.
Electric Vehicles MLCC Market Industry Trends & Insights
The Electric Vehicles MLCC market is experiencing robust growth, driven primarily by the burgeoning EV industry. The market is poised for significant expansion as governments worldwide implement stricter emission regulations and promote electric vehicle adoption. This is further accelerated by advancements in battery technology leading to greater energy density and range. The market is characterized by intense competition, technological innovation, and shifting consumer preferences towards higher-performance and energy-efficient vehicles.
The CAGR for the Electric Vehicles MLCC market during the forecast period (2025-2033) is estimated at xx%. Market penetration is steadily increasing, as MLCCs become integral components in various EV subsystems. Technological advancements, such as the development of high-voltage MLCCs and miniaturized designs, are contributing to this growth. Consumer preferences towards longer driving ranges and faster charging times are also driving demand for high-performance MLCCs capable of supporting more efficient and powerful powertrains. Moreover, the increased adoption of autonomous driving features requires advanced electronic systems that rely heavily on efficient and reliable MLCCs.
Dominant Markets & Segments in Electric Vehicles MLCC Market
The Asia-Pacific region, particularly China, Japan, and South Korea, dominates the Electric Vehicles MLCC market. This dominance is attributable to robust EV production, the presence of major MLCC manufacturers, and favorable government policies supporting EV adoption.
- Key Drivers in Asia-Pacific:
- Strong government support for the EV industry through subsidies and tax incentives.
- Significant investments in charging infrastructure.
- High population density and increased urbanization leading to higher demand for personal transportation.
- Presence of major EV manufacturers and a robust supply chain.
Segment Dominance:
- Case Size: The 0603 and 1206 case sizes currently hold the largest market share due to their suitability for miniaturized designs. However, larger case sizes are gaining traction for high-power applications.
- Voltage: The 50V to 200V segment is currently dominant, driven by the widespread use of this voltage range in on-board chargers and DC-DC converters. The demand for higher voltage MLCCs (above 200V) is increasing alongside the adoption of 800V powertrains.
- Capacitance: The 10 µF to 1000 µF segment holds the largest share, catering to the needs of various EV subsystems. The demand for higher capacitance MLCCs will grow with higher-power applications.
- Dielectric Type: X7R dielectric type MLCCs dominate due to their excellent temperature stability and reliability characteristics.
Electric Vehicles MLCC Market Product Developments
Recent product innovations focus on enhancing voltage capability, miniaturization, and improving temperature stability. Manufacturers are actively developing MLCCs that can withstand higher voltages, exceeding 500V, to meet the requirements of increasingly powerful electric vehicle powertrains. Miniaturization is another key trend, allowing for higher component density in EVs, leading to reduced vehicle size and weight. Advanced dielectric materials and improved manufacturing processes are enhancing the reliability and performance of MLCCs, ensuring that they can operate reliably under demanding conditions. This ensures seamless integration into EV powertrains and various automotive applications.
Report Scope & Segmentation Analysis
This report segments the Electric Vehicles MLCC market based on case size (0, 0603, 1206, 1210, Others), voltage (Less than 50V, 50V to 200V, More than 200V), capacitance (Less than 10 µF, 10 µF to 1000 µF, More than 1000 µF), and dielectric type (Class I, Class II). Each segment's growth projections, market size estimations, and competitive dynamics are analyzed in detail. The growth projection for each segment varies depending on technological advancements and the overall demand for EVs. Competitive dynamics are influenced by factors like pricing strategies, product differentiation, and geographic reach.
Key Drivers of Electric Vehicles MLCC Market Growth
The growth of the Electric Vehicles MLCC market is fueled by several key drivers:
- Increasing demand for EVs: Government regulations and consumer preferences are driving a surge in EV adoption globally.
- Technological advancements: Developments in MLCC technology, including higher voltage and capacitance capabilities, are crucial for advanced power electronics systems in EVs.
- Stringent emission standards: Governments worldwide are implementing strict regulations to reduce carbon emissions, pushing the adoption of EVs.
Challenges in the Electric Vehicles MLCC Market Sector
Several challenges impede the growth of the Electric Vehicles MLCC market:
- Supply chain disruptions: Global supply chain vulnerabilities can impact the availability and cost of raw materials.
- High production costs: The manufacturing process of MLCCs, particularly those with high-voltage and high-capacitance capabilities, can be complex and expensive.
- Intense competition: The market is highly competitive, with numerous established and emerging players vying for market share.
Emerging Opportunities in Electric Vehicles MLCC Market
Several emerging opportunities exist in the Electric Vehicles MLCC market:
- Growth of the 800V powertrain: The adoption of 800V powertrains requires high-voltage MLCCs, creating a significant opportunity for manufacturers.
- Development of new materials: Research into novel dielectric materials could lead to MLCCs with enhanced performance and reliability.
- Expansion into new geographic markets: The adoption of EVs is rapidly expanding in emerging markets, presenting significant growth opportunities.
Leading Players in the Electric Vehicles MLCC Market Market
- Vishay Intertechnology Inc
- Kyocera AVX Components Corporation (Kyocera Corporation)
- Maruwa Co ltd
- Samwha Capacitor Group
- Walsin Technology Corporation
- Samsung Electro-Mechanics
- Würth Elektronik GmbH & Co KG
- Yageo Corporation
- Taiyo Yuden Co Ltd
- TDK Corporation
- Murata Manufacturing Co Ltd
- Nippon Chemi-Con Corporation
Key Developments in Electric Vehicles MLCC Market Industry
- July 2023: KEMET (part of Yageo Corporation) launched the X7R automotive-grade MLCC, designed for high-voltage automotive subsystems (100pF-0.1uF, 500V-1kV), available in EIA 0603-1210 cases.
- June 2023: A major manufacturer introduced the NTS/NTF Series of SMD type MLCCs, rated 25-500 Vdc with capacitance ranging from 0.010 to 47µF, for use in on-board power supplies, voltage regulators, and DC-DC converters.
- May 2023: Murata launched the EVA series of MLCCs, versatile for EV applications like OBCs, inverters, DC/DC converters, BMS, and WPT, suitable for 800V powertrain systems.
Strategic Outlook for Electric Vehicles MLCC Market Market
The Electric Vehicles MLCC market is poised for sustained growth, driven by the continued expansion of the EV industry and advancements in MLCC technology. The development of higher-voltage and higher-capacitance MLCCs will be crucial in supporting the development of more powerful and efficient electric vehicles. The focus on miniaturization and improved reliability will also be key factors driving future market growth. The market's strategic outlook is highly positive, with significant opportunities for established players and new entrants alike.
Electric Vehicles MLCC Market Segmentation
-
1. Case Size
- 1.1. 0 603
- 1.2. 0 805
- 1.3. 1 206
- 1.4. 1 210
- 1.5. 1 812
- 1.6. Others
-
2. Voltage
- 2.1. 50V to 200V
- 2.2. Less than 50V
- 2.3. More than 200V
-
3. Capacitance
- 3.1. 10 µF to 1000 µF
- 3.2. Less than 10 µF
- 3.3. More than 1000µF
-
4. Dielectric Type
- 4.1. Class 1
- 4.2. Class 2
Electric Vehicles MLCC Market Segmentation By Geography
-
1. North America
- 1.1. United States
- 1.2. Canada
- 1.3. Mexico
-
2. South America
- 2.1. Brazil
- 2.2. Argentina
- 2.3. Rest of South America
-
3. Europe
- 3.1. United Kingdom
- 3.2. Germany
- 3.3. France
- 3.4. Italy
- 3.5. Spain
- 3.6. Russia
- 3.7. Benelux
- 3.8. Nordics
- 3.9. Rest of Europe
-
4. Middle East & Africa
- 4.1. Turkey
- 4.2. Israel
- 4.3. GCC
- 4.4. North Africa
- 4.5. South Africa
- 4.6. Rest of Middle East & Africa
-
5. Asia Pacific
- 5.1. China
- 5.2. India
- 5.3. Japan
- 5.4. South Korea
- 5.5. ASEAN
- 5.6. Oceania
- 5.7. Rest of Asia Pacific
Electric Vehicles MLCC Market Regional Market Share
Geographic Coverage of Electric Vehicles MLCC Market
Electric Vehicles MLCC Market REPORT HIGHLIGHTS
| Aspects | Details |
|---|---|
| Study Period | 2020-2034 |
| Base Year | 2025 |
| Estimated Year | 2026 |
| Forecast Period | 2026-2034 |
| Historical Period | 2020-2025 |
| Growth Rate | CAGR of 15.2% from 2020-2034 |
| Segmentation |
|
Table of Contents
- 1. Introduction
- 1.1. Research Scope
- 1.2. Market Segmentation
- 1.3. Research Methodology
- 1.4. Definitions and Assumptions
- 2. Executive Summary
- 2.1. Introduction
- 3. Market Dynamics
- 3.1. Introduction
- 3.2. Market Drivers
- 3.2.1. Rise in the Applications of Semiconductors; Advancement in Technology Such as Magnetron Sputtering Technology
- 3.3. Market Restrains
- 3.3.1. Rise of Alternative Technologies Such as Thermal Evaporation
- 3.4. Market Trends
- 3.4.1. OTHER KEY INDUSTRY TRENDS COVERED IN THE REPORT
- 4. Market Factor Analysis
- 4.1. Porters Five Forces
- 4.2. Supply/Value Chain
- 4.3. PESTEL analysis
- 4.4. Market Entropy
- 4.5. Patent/Trademark Analysis
- 5. Global Electric Vehicles MLCC Market Analysis, Insights and Forecast, 2020-2032
- 5.1. Market Analysis, Insights and Forecast - by Case Size
- 5.1.1. 0 603
- 5.1.2. 0 805
- 5.1.3. 1 206
- 5.1.4. 1 210
- 5.1.5. 1 812
- 5.1.6. Others
- 5.2. Market Analysis, Insights and Forecast - by Voltage
- 5.2.1. 50V to 200V
- 5.2.2. Less than 50V
- 5.2.3. More than 200V
- 5.3. Market Analysis, Insights and Forecast - by Capacitance
- 5.3.1. 10 µF to 1000 µF
- 5.3.2. Less than 10 µF
- 5.3.3. More than 1000µF
- 5.4. Market Analysis, Insights and Forecast - by Dielectric Type
- 5.4.1. Class 1
- 5.4.2. Class 2
- 5.5. Market Analysis, Insights and Forecast - by Region
- 5.5.1. North America
- 5.5.2. South America
- 5.5.3. Europe
- 5.5.4. Middle East & Africa
- 5.5.5. Asia Pacific
- 5.1. Market Analysis, Insights and Forecast - by Case Size
- 6. North America Electric Vehicles MLCC Market Analysis, Insights and Forecast, 2020-2032
- 6.1. Market Analysis, Insights and Forecast - by Case Size
- 6.1.1. 0 603
- 6.1.2. 0 805
- 6.1.3. 1 206
- 6.1.4. 1 210
- 6.1.5. 1 812
- 6.1.6. Others
- 6.2. Market Analysis, Insights and Forecast - by Voltage
- 6.2.1. 50V to 200V
- 6.2.2. Less than 50V
- 6.2.3. More than 200V
- 6.3. Market Analysis, Insights and Forecast - by Capacitance
- 6.3.1. 10 µF to 1000 µF
- 6.3.2. Less than 10 µF
- 6.3.3. More than 1000µF
- 6.4. Market Analysis, Insights and Forecast - by Dielectric Type
- 6.4.1. Class 1
- 6.4.2. Class 2
- 6.1. Market Analysis, Insights and Forecast - by Case Size
- 7. South America Electric Vehicles MLCC Market Analysis, Insights and Forecast, 2020-2032
- 7.1. Market Analysis, Insights and Forecast - by Case Size
- 7.1.1. 0 603
- 7.1.2. 0 805
- 7.1.3. 1 206
- 7.1.4. 1 210
- 7.1.5. 1 812
- 7.1.6. Others
- 7.2. Market Analysis, Insights and Forecast - by Voltage
- 7.2.1. 50V to 200V
- 7.2.2. Less than 50V
- 7.2.3. More than 200V
- 7.3. Market Analysis, Insights and Forecast - by Capacitance
- 7.3.1. 10 µF to 1000 µF
- 7.3.2. Less than 10 µF
- 7.3.3. More than 1000µF
- 7.4. Market Analysis, Insights and Forecast - by Dielectric Type
- 7.4.1. Class 1
- 7.4.2. Class 2
- 7.1. Market Analysis, Insights and Forecast - by Case Size
- 8. Europe Electric Vehicles MLCC Market Analysis, Insights and Forecast, 2020-2032
- 8.1. Market Analysis, Insights and Forecast - by Case Size
- 8.1.1. 0 603
- 8.1.2. 0 805
- 8.1.3. 1 206
- 8.1.4. 1 210
- 8.1.5. 1 812
- 8.1.6. Others
- 8.2. Market Analysis, Insights and Forecast - by Voltage
- 8.2.1. 50V to 200V
- 8.2.2. Less than 50V
- 8.2.3. More than 200V
- 8.3. Market Analysis, Insights and Forecast - by Capacitance
- 8.3.1. 10 µF to 1000 µF
- 8.3.2. Less than 10 µF
- 8.3.3. More than 1000µF
- 8.4. Market Analysis, Insights and Forecast - by Dielectric Type
- 8.4.1. Class 1
- 8.4.2. Class 2
- 8.1. Market Analysis, Insights and Forecast - by Case Size
- 9. Middle East & Africa Electric Vehicles MLCC Market Analysis, Insights and Forecast, 2020-2032
- 9.1. Market Analysis, Insights and Forecast - by Case Size
- 9.1.1. 0 603
- 9.1.2. 0 805
- 9.1.3. 1 206
- 9.1.4. 1 210
- 9.1.5. 1 812
- 9.1.6. Others
- 9.2. Market Analysis, Insights and Forecast - by Voltage
- 9.2.1. 50V to 200V
- 9.2.2. Less than 50V
- 9.2.3. More than 200V
- 9.3. Market Analysis, Insights and Forecast - by Capacitance
- 9.3.1. 10 µF to 1000 µF
- 9.3.2. Less than 10 µF
- 9.3.3. More than 1000µF
- 9.4. Market Analysis, Insights and Forecast - by Dielectric Type
- 9.4.1. Class 1
- 9.4.2. Class 2
- 9.1. Market Analysis, Insights and Forecast - by Case Size
- 10. Asia Pacific Electric Vehicles MLCC Market Analysis, Insights and Forecast, 2020-2032
- 10.1. Market Analysis, Insights and Forecast - by Case Size
- 10.1.1. 0 603
- 10.1.2. 0 805
- 10.1.3. 1 206
- 10.1.4. 1 210
- 10.1.5. 1 812
- 10.1.6. Others
- 10.2. Market Analysis, Insights and Forecast - by Voltage
- 10.2.1. 50V to 200V
- 10.2.2. Less than 50V
- 10.2.3. More than 200V
- 10.3. Market Analysis, Insights and Forecast - by Capacitance
- 10.3.1. 10 µF to 1000 µF
- 10.3.2. Less than 10 µF
- 10.3.3. More than 1000µF
- 10.4. Market Analysis, Insights and Forecast - by Dielectric Type
- 10.4.1. Class 1
- 10.4.2. Class 2
- 10.1. Market Analysis, Insights and Forecast - by Case Size
- 11. Competitive Analysis
- 11.1. Global Market Share Analysis 2025
- 11.2. Company Profiles
- 11.2.1 Vishay Intertechnology Inc
- 11.2.1.1. Overview
- 11.2.1.2. Products
- 11.2.1.3. SWOT Analysis
- 11.2.1.4. Recent Developments
- 11.2.1.5. Financials (Based on Availability)
- 11.2.2 Kyocera AVX Components Corporation (Kyocera Corporation)
- 11.2.2.1. Overview
- 11.2.2.2. Products
- 11.2.2.3. SWOT Analysis
- 11.2.2.4. Recent Developments
- 11.2.2.5. Financials (Based on Availability)
- 11.2.3 Maruwa Co ltd
- 11.2.3.1. Overview
- 11.2.3.2. Products
- 11.2.3.3. SWOT Analysis
- 11.2.3.4. Recent Developments
- 11.2.3.5. Financials (Based on Availability)
- 11.2.4 Samwha Capacitor Group
- 11.2.4.1. Overview
- 11.2.4.2. Products
- 11.2.4.3. SWOT Analysis
- 11.2.4.4. Recent Developments
- 11.2.4.5. Financials (Based on Availability)
- 11.2.5 Walsin Technology Corporation
- 11.2.5.1. Overview
- 11.2.5.2. Products
- 11.2.5.3. SWOT Analysis
- 11.2.5.4. Recent Developments
- 11.2.5.5. Financials (Based on Availability)
- 11.2.6 Samsung Electro-Mechanics
- 11.2.6.1. Overview
- 11.2.6.2. Products
- 11.2.6.3. SWOT Analysis
- 11.2.6.4. Recent Developments
- 11.2.6.5. Financials (Based on Availability)
- 11.2.7 Würth Elektronik GmbH & Co KG
- 11.2.7.1. Overview
- 11.2.7.2. Products
- 11.2.7.3. SWOT Analysis
- 11.2.7.4. Recent Developments
- 11.2.7.5. Financials (Based on Availability)
- 11.2.8 Yageo Corporatio
- 11.2.8.1. Overview
- 11.2.8.2. Products
- 11.2.8.3. SWOT Analysis
- 11.2.8.4. Recent Developments
- 11.2.8.5. Financials (Based on Availability)
- 11.2.9 Taiyo Yuden Co Ltd
- 11.2.9.1. Overview
- 11.2.9.2. Products
- 11.2.9.3. SWOT Analysis
- 11.2.9.4. Recent Developments
- 11.2.9.5. Financials (Based on Availability)
- 11.2.10 TDK Corporation
- 11.2.10.1. Overview
- 11.2.10.2. Products
- 11.2.10.3. SWOT Analysis
- 11.2.10.4. Recent Developments
- 11.2.10.5. Financials (Based on Availability)
- 11.2.11 Murata Manufacturing Co Ltd
- 11.2.11.1. Overview
- 11.2.11.2. Products
- 11.2.11.3. SWOT Analysis
- 11.2.11.4. Recent Developments
- 11.2.11.5. Financials (Based on Availability)
- 11.2.12 Nippon Chemi-Con Corporation
- 11.2.12.1. Overview
- 11.2.12.2. Products
- 11.2.12.3. SWOT Analysis
- 11.2.12.4. Recent Developments
- 11.2.12.5. Financials (Based on Availability)
- 11.2.1 Vishay Intertechnology Inc
List of Figures
- Figure 1: Global Electric Vehicles MLCC Market Revenue Breakdown (undefined, %) by Region 2025 & 2033
- Figure 2: North America Electric Vehicles MLCC Market Revenue (undefined), by Case Size 2025 & 2033
- Figure 3: North America Electric Vehicles MLCC Market Revenue Share (%), by Case Size 2025 & 2033
- Figure 4: North America Electric Vehicles MLCC Market Revenue (undefined), by Voltage 2025 & 2033
- Figure 5: North America Electric Vehicles MLCC Market Revenue Share (%), by Voltage 2025 & 2033
- Figure 6: North America Electric Vehicles MLCC Market Revenue (undefined), by Capacitance 2025 & 2033
- Figure 7: North America Electric Vehicles MLCC Market Revenue Share (%), by Capacitance 2025 & 2033
- Figure 8: North America Electric Vehicles MLCC Market Revenue (undefined), by Dielectric Type 2025 & 2033
- Figure 9: North America Electric Vehicles MLCC Market Revenue Share (%), by Dielectric Type 2025 & 2033
- Figure 10: North America Electric Vehicles MLCC Market Revenue (undefined), by Country 2025 & 2033
- Figure 11: North America Electric Vehicles MLCC Market Revenue Share (%), by Country 2025 & 2033
- Figure 12: South America Electric Vehicles MLCC Market Revenue (undefined), by Case Size 2025 & 2033
- Figure 13: South America Electric Vehicles MLCC Market Revenue Share (%), by Case Size 2025 & 2033
- Figure 14: South America Electric Vehicles MLCC Market Revenue (undefined), by Voltage 2025 & 2033
- Figure 15: South America Electric Vehicles MLCC Market Revenue Share (%), by Voltage 2025 & 2033
- Figure 16: South America Electric Vehicles MLCC Market Revenue (undefined), by Capacitance 2025 & 2033
- Figure 17: South America Electric Vehicles MLCC Market Revenue Share (%), by Capacitance 2025 & 2033
- Figure 18: South America Electric Vehicles MLCC Market Revenue (undefined), by Dielectric Type 2025 & 2033
- Figure 19: South America Electric Vehicles MLCC Market Revenue Share (%), by Dielectric Type 2025 & 2033
- Figure 20: South America Electric Vehicles MLCC Market Revenue (undefined), by Country 2025 & 2033
- Figure 21: South America Electric Vehicles MLCC Market Revenue Share (%), by Country 2025 & 2033
- Figure 22: Europe Electric Vehicles MLCC Market Revenue (undefined), by Case Size 2025 & 2033
- Figure 23: Europe Electric Vehicles MLCC Market Revenue Share (%), by Case Size 2025 & 2033
- Figure 24: Europe Electric Vehicles MLCC Market Revenue (undefined), by Voltage 2025 & 2033
- Figure 25: Europe Electric Vehicles MLCC Market Revenue Share (%), by Voltage 2025 & 2033
- Figure 26: Europe Electric Vehicles MLCC Market Revenue (undefined), by Capacitance 2025 & 2033
- Figure 27: Europe Electric Vehicles MLCC Market Revenue Share (%), by Capacitance 2025 & 2033
- Figure 28: Europe Electric Vehicles MLCC Market Revenue (undefined), by Dielectric Type 2025 & 2033
- Figure 29: Europe Electric Vehicles MLCC Market Revenue Share (%), by Dielectric Type 2025 & 2033
- Figure 30: Europe Electric Vehicles MLCC Market Revenue (undefined), by Country 2025 & 2033
- Figure 31: Europe Electric Vehicles MLCC Market Revenue Share (%), by Country 2025 & 2033
- Figure 32: Middle East & Africa Electric Vehicles MLCC Market Revenue (undefined), by Case Size 2025 & 2033
- Figure 33: Middle East & Africa Electric Vehicles MLCC Market Revenue Share (%), by Case Size 2025 & 2033
- Figure 34: Middle East & Africa Electric Vehicles MLCC Market Revenue (undefined), by Voltage 2025 & 2033
- Figure 35: Middle East & Africa Electric Vehicles MLCC Market Revenue Share (%), by Voltage 2025 & 2033
- Figure 36: Middle East & Africa Electric Vehicles MLCC Market Revenue (undefined), by Capacitance 2025 & 2033
- Figure 37: Middle East & Africa Electric Vehicles MLCC Market Revenue Share (%), by Capacitance 2025 & 2033
- Figure 38: Middle East & Africa Electric Vehicles MLCC Market Revenue (undefined), by Dielectric Type 2025 & 2033
- Figure 39: Middle East & Africa Electric Vehicles MLCC Market Revenue Share (%), by Dielectric Type 2025 & 2033
- Figure 40: Middle East & Africa Electric Vehicles MLCC Market Revenue (undefined), by Country 2025 & 2033
- Figure 41: Middle East & Africa Electric Vehicles MLCC Market Revenue Share (%), by Country 2025 & 2033
- Figure 42: Asia Pacific Electric Vehicles MLCC Market Revenue (undefined), by Case Size 2025 & 2033
- Figure 43: Asia Pacific Electric Vehicles MLCC Market Revenue Share (%), by Case Size 2025 & 2033
- Figure 44: Asia Pacific Electric Vehicles MLCC Market Revenue (undefined), by Voltage 2025 & 2033
- Figure 45: Asia Pacific Electric Vehicles MLCC Market Revenue Share (%), by Voltage 2025 & 2033
- Figure 46: Asia Pacific Electric Vehicles MLCC Market Revenue (undefined), by Capacitance 2025 & 2033
- Figure 47: Asia Pacific Electric Vehicles MLCC Market Revenue Share (%), by Capacitance 2025 & 2033
- Figure 48: Asia Pacific Electric Vehicles MLCC Market Revenue (undefined), by Dielectric Type 2025 & 2033
- Figure 49: Asia Pacific Electric Vehicles MLCC Market Revenue Share (%), by Dielectric Type 2025 & 2033
- Figure 50: Asia Pacific Electric Vehicles MLCC Market Revenue (undefined), by Country 2025 & 2033
- Figure 51: Asia Pacific Electric Vehicles MLCC Market Revenue Share (%), by Country 2025 & 2033
List of Tables
- Table 1: Global Electric Vehicles MLCC Market Revenue undefined Forecast, by Case Size 2020 & 2033
- Table 2: Global Electric Vehicles MLCC Market Revenue undefined Forecast, by Voltage 2020 & 2033
- Table 3: Global Electric Vehicles MLCC Market Revenue undefined Forecast, by Capacitance 2020 & 2033
- Table 4: Global Electric Vehicles MLCC Market Revenue undefined Forecast, by Dielectric Type 2020 & 2033
- Table 5: Global Electric Vehicles MLCC Market Revenue undefined Forecast, by Region 2020 & 2033
- Table 6: Global Electric Vehicles MLCC Market Revenue undefined Forecast, by Case Size 2020 & 2033
- Table 7: Global Electric Vehicles MLCC Market Revenue undefined Forecast, by Voltage 2020 & 2033
- Table 8: Global Electric Vehicles MLCC Market Revenue undefined Forecast, by Capacitance 2020 & 2033
- Table 9: Global Electric Vehicles MLCC Market Revenue undefined Forecast, by Dielectric Type 2020 & 2033
- Table 10: Global Electric Vehicles MLCC Market Revenue undefined Forecast, by Country 2020 & 2033
- Table 11: United States Electric Vehicles MLCC Market Revenue (undefined) Forecast, by Application 2020 & 2033
- Table 12: Canada Electric Vehicles MLCC Market Revenue (undefined) Forecast, by Application 2020 & 2033
- Table 13: Mexico Electric Vehicles MLCC Market Revenue (undefined) Forecast, by Application 2020 & 2033
- Table 14: Global Electric Vehicles MLCC Market Revenue undefined Forecast, by Case Size 2020 & 2033
- Table 15: Global Electric Vehicles MLCC Market Revenue undefined Forecast, by Voltage 2020 & 2033
- Table 16: Global Electric Vehicles MLCC Market Revenue undefined Forecast, by Capacitance 2020 & 2033
- Table 17: Global Electric Vehicles MLCC Market Revenue undefined Forecast, by Dielectric Type 2020 & 2033
- Table 18: Global Electric Vehicles MLCC Market Revenue undefined Forecast, by Country 2020 & 2033
- Table 19: Brazil Electric Vehicles MLCC Market Revenue (undefined) Forecast, by Application 2020 & 2033
- Table 20: Argentina Electric Vehicles MLCC Market Revenue (undefined) Forecast, by Application 2020 & 2033
- Table 21: Rest of South America Electric Vehicles MLCC Market Revenue (undefined) Forecast, by Application 2020 & 2033
- Table 22: Global Electric Vehicles MLCC Market Revenue undefined Forecast, by Case Size 2020 & 2033
- Table 23: Global Electric Vehicles MLCC Market Revenue undefined Forecast, by Voltage 2020 & 2033
- Table 24: Global Electric Vehicles MLCC Market Revenue undefined Forecast, by Capacitance 2020 & 2033
- Table 25: Global Electric Vehicles MLCC Market Revenue undefined Forecast, by Dielectric Type 2020 & 2033
- Table 26: Global Electric Vehicles MLCC Market Revenue undefined Forecast, by Country 2020 & 2033
- Table 27: United Kingdom Electric Vehicles MLCC Market Revenue (undefined) Forecast, by Application 2020 & 2033
- Table 28: Germany Electric Vehicles MLCC Market Revenue (undefined) Forecast, by Application 2020 & 2033
- Table 29: France Electric Vehicles MLCC Market Revenue (undefined) Forecast, by Application 2020 & 2033
- Table 30: Italy Electric Vehicles MLCC Market Revenue (undefined) Forecast, by Application 2020 & 2033
- Table 31: Spain Electric Vehicles MLCC Market Revenue (undefined) Forecast, by Application 2020 & 2033
- Table 32: Russia Electric Vehicles MLCC Market Revenue (undefined) Forecast, by Application 2020 & 2033
- Table 33: Benelux Electric Vehicles MLCC Market Revenue (undefined) Forecast, by Application 2020 & 2033
- Table 34: Nordics Electric Vehicles MLCC Market Revenue (undefined) Forecast, by Application 2020 & 2033
- Table 35: Rest of Europe Electric Vehicles MLCC Market Revenue (undefined) Forecast, by Application 2020 & 2033
- Table 36: Global Electric Vehicles MLCC Market Revenue undefined Forecast, by Case Size 2020 & 2033
- Table 37: Global Electric Vehicles MLCC Market Revenue undefined Forecast, by Voltage 2020 & 2033
- Table 38: Global Electric Vehicles MLCC Market Revenue undefined Forecast, by Capacitance 2020 & 2033
- Table 39: Global Electric Vehicles MLCC Market Revenue undefined Forecast, by Dielectric Type 2020 & 2033
- Table 40: Global Electric Vehicles MLCC Market Revenue undefined Forecast, by Country 2020 & 2033
- Table 41: Turkey Electric Vehicles MLCC Market Revenue (undefined) Forecast, by Application 2020 & 2033
- Table 42: Israel Electric Vehicles MLCC Market Revenue (undefined) Forecast, by Application 2020 & 2033
- Table 43: GCC Electric Vehicles MLCC Market Revenue (undefined) Forecast, by Application 2020 & 2033
- Table 44: North Africa Electric Vehicles MLCC Market Revenue (undefined) Forecast, by Application 2020 & 2033
- Table 45: South Africa Electric Vehicles MLCC Market Revenue (undefined) Forecast, by Application 2020 & 2033
- Table 46: Rest of Middle East & Africa Electric Vehicles MLCC Market Revenue (undefined) Forecast, by Application 2020 & 2033
- Table 47: Global Electric Vehicles MLCC Market Revenue undefined Forecast, by Case Size 2020 & 2033
- Table 48: Global Electric Vehicles MLCC Market Revenue undefined Forecast, by Voltage 2020 & 2033
- Table 49: Global Electric Vehicles MLCC Market Revenue undefined Forecast, by Capacitance 2020 & 2033
- Table 50: Global Electric Vehicles MLCC Market Revenue undefined Forecast, by Dielectric Type 2020 & 2033
- Table 51: Global Electric Vehicles MLCC Market Revenue undefined Forecast, by Country 2020 & 2033
- Table 52: China Electric Vehicles MLCC Market Revenue (undefined) Forecast, by Application 2020 & 2033
- Table 53: India Electric Vehicles MLCC Market Revenue (undefined) Forecast, by Application 2020 & 2033
- Table 54: Japan Electric Vehicles MLCC Market Revenue (undefined) Forecast, by Application 2020 & 2033
- Table 55: South Korea Electric Vehicles MLCC Market Revenue (undefined) Forecast, by Application 2020 & 2033
- Table 56: ASEAN Electric Vehicles MLCC Market Revenue (undefined) Forecast, by Application 2020 & 2033
- Table 57: Oceania Electric Vehicles MLCC Market Revenue (undefined) Forecast, by Application 2020 & 2033
- Table 58: Rest of Asia Pacific Electric Vehicles MLCC Market Revenue (undefined) Forecast, by Application 2020 & 2033
Frequently Asked Questions
1. What is the projected Compound Annual Growth Rate (CAGR) of the Electric Vehicles MLCC Market?
The projected CAGR is approximately 15.2%.
2. Which companies are prominent players in the Electric Vehicles MLCC Market?
Key companies in the market include Vishay Intertechnology Inc, Kyocera AVX Components Corporation (Kyocera Corporation), Maruwa Co ltd, Samwha Capacitor Group, Walsin Technology Corporation, Samsung Electro-Mechanics, Würth Elektronik GmbH & Co KG, Yageo Corporatio, Taiyo Yuden Co Ltd, TDK Corporation, Murata Manufacturing Co Ltd, Nippon Chemi-Con Corporation.
3. What are the main segments of the Electric Vehicles MLCC Market?
The market segments include Case Size, Voltage, Capacitance, Dielectric Type.
4. Can you provide details about the market size?
The market size is estimated to be USD XXX N/A as of 2022.
5. What are some drivers contributing to market growth?
Rise in the Applications of Semiconductors; Advancement in Technology Such as Magnetron Sputtering Technology.
6. What are the notable trends driving market growth?
OTHER KEY INDUSTRY TRENDS COVERED IN THE REPORT.
7. Are there any restraints impacting market growth?
Rise of Alternative Technologies Such as Thermal Evaporation.
8. Can you provide examples of recent developments in the market?
July 2023: KEMET, part of the Yageo Corporation developed the X7R automotive grade MLCC X7R. This MLCC is designed to meet the high voltage requirements of automotive subsystems, ranging from 100pF-0.1uF and with a DC voltage range of 500V-1kV. The range of cases available is EIA 0603-1210, and is suitable for both automotive under hoods and in-cabin applications. These MLCCs demonstrate the essential and reliable nature of capacitors, which are essential for the mission and safety of automotive subsystems.June 2023: The growing demand for industrial equipments has driven the company to introduce NTS/NTF NTS/NTF Series of SMD type MLCC. These capacitors are rated with 25 to 500 Vdc with a capacitance ranging from 0.010 to 47µF. These MLCCs are used in on-board power supplies,voltage regulators for computers,smoothing circuit of DC-DC converters,etc.May 2023: Murata has introduced the EVA series of MLCC, which are beneficial to EV manufacturers due to their versatility. These MLCC's can be used in a variety of applications, including OBC (On-Board Charger), inverter and DC/DC Converter, BMS (Battery Management System), and WPT (Wireless Power Transfer) implementations. As a result, they are ideal to the increased isolation that the 800V powertrain migration will require, while also meeting the miniaturization requirements of modern automotive systems.
9. What pricing options are available for accessing the report?
Pricing options include single-user, multi-user, and enterprise licenses priced at USD 3800, USD 4500, and USD 5800 respectively.
10. Is the market size provided in terms of value or volume?
The market size is provided in terms of value, measured in N/A.
11. Are there any specific market keywords associated with the report?
Yes, the market keyword associated with the report is "Electric Vehicles MLCC Market," which aids in identifying and referencing the specific market segment covered.
12. How do I determine which pricing option suits my needs best?
The pricing options vary based on user requirements and access needs. Individual users may opt for single-user licenses, while businesses requiring broader access may choose multi-user or enterprise licenses for cost-effective access to the report.
13. Are there any additional resources or data provided in the Electric Vehicles MLCC Market report?
While the report offers comprehensive insights, it's advisable to review the specific contents or supplementary materials provided to ascertain if additional resources or data are available.
14. How can I stay updated on further developments or reports in the Electric Vehicles MLCC Market?
To stay informed about further developments, trends, and reports in the Electric Vehicles MLCC Market, consider subscribing to industry newsletters, following relevant companies and organizations, or regularly checking reputable industry news sources and publications.
Methodology
Step 1 - Identification of Relevant Samples Size from Population Database


Step 2 - Approaches for Defining Global Market Size (Value, Volume* & Price*)

Note*: In applicable scenarios
Step 3 - Data Sources
Primary Research
- Web Analytics
- Survey Reports
- Research Institute
- Latest Research Reports
- Opinion Leaders
Secondary Research
- Annual Reports
- White Paper
- Latest Press Release
- Industry Association
- Paid Database
- Investor Presentations

Step 4 - Data Triangulation
Involves using different sources of information in order to increase the validity of a study
These sources are likely to be stakeholders in a program - participants, other researchers, program staff, other community members, and so on.
Then we put all data in single framework & apply various statistical tools to find out the dynamic on the market.
During the analysis stage, feedback from the stakeholder groups would be compared to determine areas of agreement as well as areas of divergence

