Key Insights
The global electrical insulation materials market is experiencing robust growth, driven by the increasing demand for electricity across various sectors and the expansion of renewable energy infrastructure. The market's Compound Annual Growth Rate (CAGR) exceeding 6% signifies a consistent upward trajectory projected through 2033. Key drivers include the burgeoning adoption of electric vehicles, the proliferation of smart grids, and the rising need for energy-efficient power transmission and distribution systems. Technological advancements in materials science, leading to the development of high-performance insulators with improved dielectric strength, thermal stability, and durability, further fuel market expansion. The market is segmented by material type (glass, porcelain, polymer), voltage level (low, medium, high), and application (transformers, cables, rotating machines, surge protectors). Polymer insulators, owing to their lightweight, cost-effective nature, and ease of installation, are witnessing significant adoption, while high-voltage applications represent a lucrative segment driven by the expansion of long-distance power transmission networks. Geographic expansion, particularly in rapidly developing economies of Asia-Pacific, further contributes to the market's growth. However, the market faces challenges including fluctuations in raw material prices and environmental concerns associated with certain insulator types. Companies like General Electric, Siemens, and NGK Insulators are at the forefront of innovation and market share, leveraging their established presence and technological expertise to meet the evolving demands of the industry.
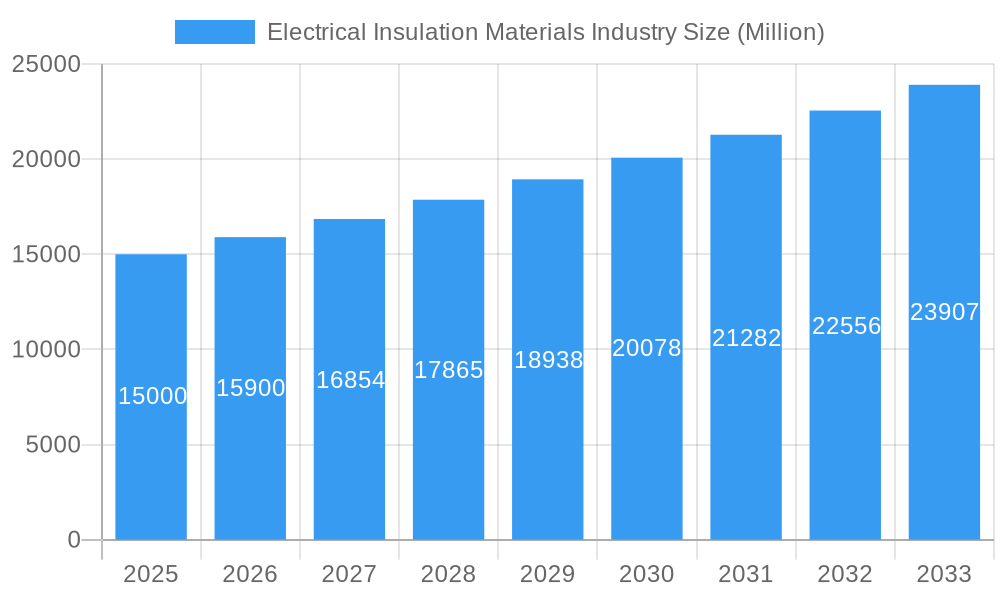
Electrical Insulation Materials Industry Market Size (In Billion)
The market's segmentation presents diverse investment opportunities. The growing demand for miniaturized and high-efficiency electronics is pushing the development of advanced polymer and composite insulation materials. Furthermore, the focus on sustainable practices is leading to research and development of eco-friendly insulation materials with reduced environmental impact. Competition is intense, with established players and emerging companies vying for market share through product innovation, strategic partnerships, and regional expansion. Despite potential constraints, the long-term outlook for the electrical insulation materials market remains positive, driven by consistent growth in energy consumption and technological advancements fostering a more efficient and reliable power infrastructure. Stringent safety regulations and the continuous push for enhanced energy efficiency are creating new market opportunities. Companies are investing heavily in R&D to develop superior materials that can withstand increasingly demanding operating conditions.
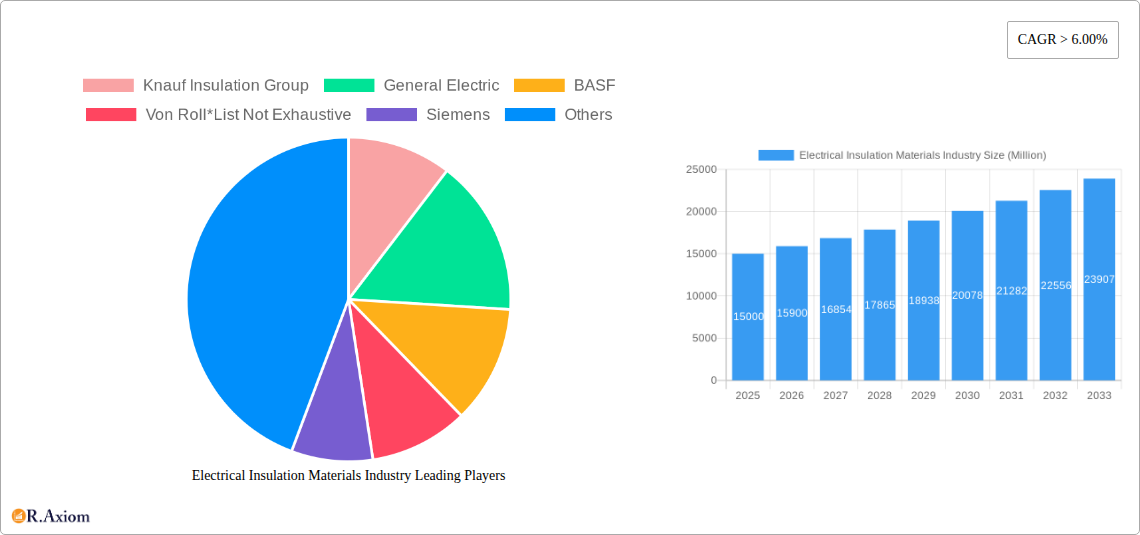
Electrical Insulation Materials Industry Company Market Share
Electrical Insulation Materials Industry: A Comprehensive Market Report (2019-2033)
This in-depth report provides a comprehensive analysis of the Electrical Insulation Materials industry, offering actionable insights for stakeholders across the value chain. The study period covers 2019-2033, with 2025 serving as the base and estimated year. The report leverages rigorous research methodologies to deliver a granular understanding of market dynamics, competitive landscapes, and future growth trajectories. The global market size is estimated at xx Million in 2025 and is projected to reach xx Million by 2033, exhibiting a CAGR of xx% during the forecast period (2025-2033).
Electrical Insulation Materials Industry Market Concentration & Innovation
The electrical insulation materials market exhibits a moderately concentrated landscape, with key players such as Knauf Insulation Group, General Electric, BASF, Von Roll, Siemens, NGK Insulators, Huntsman, Bharat Heavy Electricals Limited, Owens Corning, Krempel GmbH, Toshiba, and ABB holding significant market share. However, the presence of numerous smaller players and regional manufacturers indicates a dynamic competitive environment. Market share data reveals that the top five players collectively account for approximately xx% of the global market in 2025. Innovation is driven by the demand for enhanced thermal stability, improved dielectric strength, and miniaturization in electrical equipment. Stringent regulatory frameworks concerning environmental compliance and safety standards further influence innovation trajectories. The increasing adoption of sustainable materials and advanced manufacturing techniques are prominent themes. The market has also witnessed several M&A activities, with deal values totaling approximately xx Million in the last five years, primarily driven by efforts to expand product portfolios and geographic reach. Key examples include the acquisition of xx by xx in 2022, valued at xx Million. Product substitutes, such as alternative materials with improved properties, continue to pose a challenge to incumbent players. End-user trends, notably the shift toward renewable energy sources and the adoption of electric vehicles, are reshaping market demand for specific types of insulation materials.
Electrical Insulation Materials Industry Industry Trends & Insights
The electrical insulation materials market is experiencing robust growth fueled by several key factors. The burgeoning renewable energy sector, particularly solar and wind power, is a primary driver, necessitating advanced insulation materials for efficient energy transmission and distribution. The expanding electric vehicle market further boosts demand for specialized insulation in high-performance batteries. Technological advancements, such as the development of nanocomposite materials with enhanced dielectric properties, are driving market innovation. Consumer preference for energy-efficient appliances and improved safety standards in electrical systems are indirectly fueling market demand. The competitive landscape is characterized by intense competition among established players, with ongoing efforts to expand product portfolios, enhance production capacities, and enter new geographic markets. The market penetration of polymer insulators is increasing steadily, driven by their lightweight nature, superior performance characteristics, and cost-effectiveness compared to traditional glass and porcelain insulators. The global market is projected to exhibit a CAGR of xx% between 2025 and 2033, reflecting a significant growth trajectory.
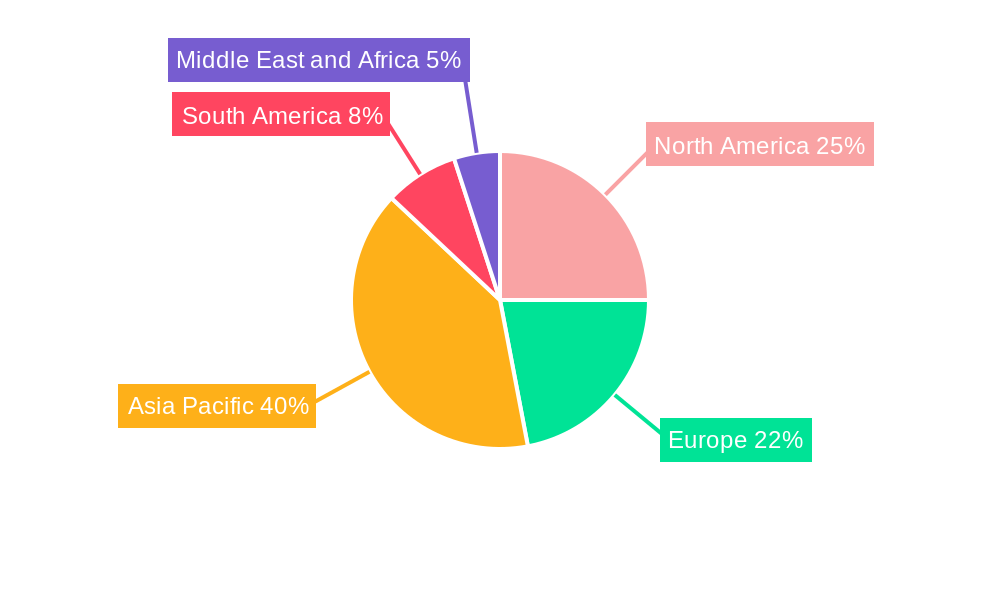
Dominant Markets & Segments in Electrical Insulation Materials Industry
The Asia-Pacific region dominates the electrical insulation materials market, driven primarily by rapid industrialization, significant infrastructure development, and increasing energy consumption in countries like China and India. Within this region, China emerges as the leading national market.
- Type: Polymer insulators are experiencing the fastest growth, driven by their superior performance characteristics and cost-effectiveness.
- Voltage: The high-voltage segment holds the largest market share, owing to the substantial demand for insulation materials in power transmission and distribution systems.
- Application: Transformers and bushings account for the largest application segment due to the widespread use of transformers in power grids and other electrical equipment.
Key drivers in the dominant regions include favorable government policies promoting renewable energy adoption, robust infrastructure development projects, and a growing industrial base. The dominance of specific segments stems from factors like enhanced performance characteristics, cost-effectiveness, and specific application requirements. For instance, the prevalence of high-voltage transmission lines fuels high demand for associated insulation materials.
Electrical Insulation Materials Industry Product Developments
Recent innovations focus on developing eco-friendly and high-performance insulation materials. The introduction of nanocomposites and advanced polymer formulations has significantly improved dielectric strength, thermal stability, and overall performance characteristics. This development caters to the rising demand for improved efficiency and longevity in electrical equipment while addressing environmental concerns associated with traditional materials. The market is witnessing a shift towards lightweight, space-saving insulation solutions, reflecting the trend toward miniaturization in electronic devices and power equipment.
Report Scope & Segmentation Analysis
This report segments the electrical insulation materials market based on type (Glass Insulator, Porcelain Insulator, Polymer Insulator), voltage (Low Voltage, Medium Voltage, High Voltage), and application (Transformers and Bushings, Cables and Transmission Lines, Rotating Machines, Surge Protector and Circuit Breaker, Others). Each segment’s growth projections are detailed, including market size estimations and competitive dynamics. The Polymer Insulator segment shows the highest projected CAGR (xx%) driven by its cost-effectiveness and high performance characteristics. The High Voltage segment dominates in market size, driven by the ever-growing demand in power transmission. Transformers and Bushings remain the dominant application, benefiting from the expansion of power grids globally.
Key Drivers of Electrical Insulation Materials Industry Growth
Growth is primarily driven by increasing demand for electricity, expanding power grids, and the rise of renewable energy sources like solar and wind power. Furthermore, advancements in electric vehicles and electronics propel the need for advanced insulation materials. Stringent government regulations on energy efficiency and safety standards also contribute to market growth. The substantial investments in infrastructure development worldwide further augment the market's expansion.
Challenges in the Electrical Insulation Materials Industry Sector
The industry faces challenges such as fluctuating raw material prices, stringent environmental regulations, and intense competition. Supply chain disruptions can significantly impact production and delivery, leading to price volatility. The stringent environmental regulations mandate the development of sustainable and environmentally friendly insulation materials, adding to production costs. Intense competition from both established and emerging players necessitates ongoing innovation and cost optimization to maintain market share.
Emerging Opportunities in Electrical Insulation Materials Industry
Emerging opportunities lie in the development of innovative materials with enhanced properties, such as high-temperature resistance, improved dielectric strength, and reduced environmental impact. The growing demand for electric vehicles and energy-efficient technologies presents significant growth potential. The expansion into new markets and applications, including the aerospace and defense sectors, offers further opportunities for growth.
Leading Players in the Electrical Insulation Materials Industry Market
- Knauf Insulation Group
- General Electric
- BASF
- Von Roll
- Siemens
- NGK Insulators
- Huntsman
- Bharat Heavy Electricals Limited
- Owens Corning
- Krempel GmbH
- Toshiba
- ABB
Key Developments in Electrical Insulation Materials Industry Industry
- April 2022: Von Roll announced the expansion of its potting resins business, boosting its presence in the automotive and electronics sectors. This expansion directly supports the growth of the electric vehicle market.
- May 2022: Krempel GmbH acquired the rights to produce and sell Nomex 910, a novel interlayer insulation material for transformers. This acquisition strengthens Krempel's position in the transformer insulation market.
Strategic Outlook for Electrical Insulation Materials Industry Market
The future of the electrical insulation materials market appears bright, fueled by sustained growth in electricity demand, expansion of power grids, and the proliferation of electric vehicles. Continuous innovation in materials science will lead to the development of higher-performance, environmentally friendly insulation solutions. Strategic partnerships and acquisitions will play a crucial role in shaping the market landscape and ensuring sustainable growth for industry players. The focus on improving energy efficiency and safety in electrical systems presents a significant growth opportunity for innovative players.
Electrical Insulation Materials Industry Segmentation
-
1. Type
- 1.1. Glass Insulator
- 1.2. Porcelain Insulator
- 1.3. Polymer Insulator
-
2. Voltage
- 2.1. Low Voltage
- 2.2. Medium Voltage
- 2.3. High Voltage
-
3. Application
- 3.1. Transformers and Bushings
- 3.2. Cables and Transmission Lines
- 3.3. Rotating Machines
- 3.4. Surge Protector and Circuit Breaker
- 3.5. Others
Electrical Insulation Materials Industry Segmentation By Geography
-
1. Asia Pacific
- 1.1. China
- 1.2. India
- 1.3. Japan
- 1.4. South Korea
- 1.5. Rest of Asia Pacific
-
2. North America
- 2.1. United States
- 2.2. Canada
- 2.3. Mexico
-
3. Europe
- 3.1. Germany
- 3.2. United Kingdom
- 3.3. France
- 3.4. Italy
- 3.5. Rest of Europe
-
4. South America
- 4.1. Brazil
- 4.2. Argentina
- 4.3. Rest of South America
-
5. Middle East and Africa
- 5.1. Saudi Arabia
- 5.2. South Africa
- 5.3. Rest of Middle East and Africa
Electrical Insulation Materials Industry Regional Market Share
Geographic Coverage of Electrical Insulation Materials Industry
Electrical Insulation Materials Industry REPORT HIGHLIGHTS
| Aspects | Details |
|---|---|
| Study Period | 2020-2034 |
| Base Year | 2025 |
| Estimated Year | 2026 |
| Forecast Period | 2026-2034 |
| Historical Period | 2020-2025 |
| Growth Rate | CAGR of 13.6% from 2020-2034 |
| Segmentation |
|
Table of Contents
- 1. Introduction
- 1.1. Research Scope
- 1.2. Market Segmentation
- 1.3. Research Objective
- 1.4. Definitions and Assumptions
- 2. Executive Summary
- 2.1. Market Snapshot
- 3. Market Dynamics
- 3.1. Market Drivers
- 3.2. Market Restrains
- 3.3. Market Trends
- 3.4. Market Opportunities
- 4. Market Factor Analysis
- 4.1. Porters Five Forces
- 4.1.1. Bargaining Power of Suppliers
- 4.1.2. Bargaining Power of Buyers
- 4.1.3. Threat of New Entrants
- 4.1.4. Threat of Substitutes
- 4.1.5. Competitive Rivalry
- 4.2. PESTEL analysis
- 4.3. BCG Analysis
- 4.3.1. Stars (High Growth, High Market Share)
- 4.3.2. Cash Cows (Low Growth, High Market Share)
- 4.3.3. Question Mark (High Growth, Low Market Share)
- 4.3.4. Dogs (Low Growth, Low Market Share)
- 4.4. Ansoff Matrix Analysis
- 4.5. Supply Chain Analysis
- 4.6. Regulatory Landscape
- 4.7. Current Market Potential and Opportunity Assessment (TAM–SAM–SOM Framework)
- 4.8. RAX Analyst Note
- 4.1. Porters Five Forces
- 5. Market Analysis, Insights and Forecast 2021-2033
- 5.1. Market Analysis, Insights and Forecast - by Type
- 5.1.1. Glass Insulator
- 5.1.2. Porcelain Insulator
- 5.1.3. Polymer Insulator
- 5.2. Market Analysis, Insights and Forecast - by Voltage
- 5.2.1. Low Voltage
- 5.2.2. Medium Voltage
- 5.2.3. High Voltage
- 5.3. Market Analysis, Insights and Forecast - by Application
- 5.3.1. Transformers and Bushings
- 5.3.2. Cables and Transmission Lines
- 5.3.3. Rotating Machines
- 5.3.4. Surge Protector and Circuit Breaker
- 5.3.5. Others
- 5.4. Market Analysis, Insights and Forecast - by Region
- 5.4.1. Asia Pacific
- 5.4.2. North America
- 5.4.3. Europe
- 5.4.4. South America
- 5.4.5. Middle East and Africa
- 5.1. Market Analysis, Insights and Forecast - by Type
- 6. Global Electrical Insulation Materials Industry Analysis, Insights and Forecast, 2021-2033
- 6.1. Market Analysis, Insights and Forecast - by Type
- 6.1.1. Glass Insulator
- 6.1.2. Porcelain Insulator
- 6.1.3. Polymer Insulator
- 6.2. Market Analysis, Insights and Forecast - by Voltage
- 6.2.1. Low Voltage
- 6.2.2. Medium Voltage
- 6.2.3. High Voltage
- 6.3. Market Analysis, Insights and Forecast - by Application
- 6.3.1. Transformers and Bushings
- 6.3.2. Cables and Transmission Lines
- 6.3.3. Rotating Machines
- 6.3.4. Surge Protector and Circuit Breaker
- 6.3.5. Others
- 6.1. Market Analysis, Insights and Forecast - by Type
- 7. Asia Pacific Electrical Insulation Materials Industry Analysis, Insights and Forecast, 2020-2032
- 7.1. Market Analysis, Insights and Forecast - by Type
- 7.1.1. Glass Insulator
- 7.1.2. Porcelain Insulator
- 7.1.3. Polymer Insulator
- 7.2. Market Analysis, Insights and Forecast - by Voltage
- 7.2.1. Low Voltage
- 7.2.2. Medium Voltage
- 7.2.3. High Voltage
- 7.3. Market Analysis, Insights and Forecast - by Application
- 7.3.1. Transformers and Bushings
- 7.3.2. Cables and Transmission Lines
- 7.3.3. Rotating Machines
- 7.3.4. Surge Protector and Circuit Breaker
- 7.3.5. Others
- 7.1. Market Analysis, Insights and Forecast - by Type
- 8. North America Electrical Insulation Materials Industry Analysis, Insights and Forecast, 2020-2032
- 8.1. Market Analysis, Insights and Forecast - by Type
- 8.1.1. Glass Insulator
- 8.1.2. Porcelain Insulator
- 8.1.3. Polymer Insulator
- 8.2. Market Analysis, Insights and Forecast - by Voltage
- 8.2.1. Low Voltage
- 8.2.2. Medium Voltage
- 8.2.3. High Voltage
- 8.3. Market Analysis, Insights and Forecast - by Application
- 8.3.1. Transformers and Bushings
- 8.3.2. Cables and Transmission Lines
- 8.3.3. Rotating Machines
- 8.3.4. Surge Protector and Circuit Breaker
- 8.3.5. Others
- 8.1. Market Analysis, Insights and Forecast - by Type
- 9. Europe Electrical Insulation Materials Industry Analysis, Insights and Forecast, 2020-2032
- 9.1. Market Analysis, Insights and Forecast - by Type
- 9.1.1. Glass Insulator
- 9.1.2. Porcelain Insulator
- 9.1.3. Polymer Insulator
- 9.2. Market Analysis, Insights and Forecast - by Voltage
- 9.2.1. Low Voltage
- 9.2.2. Medium Voltage
- 9.2.3. High Voltage
- 9.3. Market Analysis, Insights and Forecast - by Application
- 9.3.1. Transformers and Bushings
- 9.3.2. Cables and Transmission Lines
- 9.3.3. Rotating Machines
- 9.3.4. Surge Protector and Circuit Breaker
- 9.3.5. Others
- 9.1. Market Analysis, Insights and Forecast - by Type
- 10. South America Electrical Insulation Materials Industry Analysis, Insights and Forecast, 2020-2032
- 10.1. Market Analysis, Insights and Forecast - by Type
- 10.1.1. Glass Insulator
- 10.1.2. Porcelain Insulator
- 10.1.3. Polymer Insulator
- 10.2. Market Analysis, Insights and Forecast - by Voltage
- 10.2.1. Low Voltage
- 10.2.2. Medium Voltage
- 10.2.3. High Voltage
- 10.3. Market Analysis, Insights and Forecast - by Application
- 10.3.1. Transformers and Bushings
- 10.3.2. Cables and Transmission Lines
- 10.3.3. Rotating Machines
- 10.3.4. Surge Protector and Circuit Breaker
- 10.3.5. Others
- 10.1. Market Analysis, Insights and Forecast - by Type
- 11. Middle East and Africa Electrical Insulation Materials Industry Analysis, Insights and Forecast, 2020-2032
- 11.1. Market Analysis, Insights and Forecast - by Type
- 11.1.1. Glass Insulator
- 11.1.2. Porcelain Insulator
- 11.1.3. Polymer Insulator
- 11.2. Market Analysis, Insights and Forecast - by Voltage
- 11.2.1. Low Voltage
- 11.2.2. Medium Voltage
- 11.2.3. High Voltage
- 11.3. Market Analysis, Insights and Forecast - by Application
- 11.3.1. Transformers and Bushings
- 11.3.2. Cables and Transmission Lines
- 11.3.3. Rotating Machines
- 11.3.4. Surge Protector and Circuit Breaker
- 11.3.5. Others
- 11.1. Market Analysis, Insights and Forecast - by Type
- 12. Competitive Analysis
- 12.1. Company Profiles
- 12.1.1 Knauf Insulation Group
- 12.1.1.1. Company Overview
- 12.1.1.2. Products
- 12.1.1.3. Company Financials
- 12.1.1.4. SWOT Analysis
- 12.1.2 General Electric
- 12.1.2.1. Company Overview
- 12.1.2.2. Products
- 12.1.2.3. Company Financials
- 12.1.2.4. SWOT Analysis
- 12.1.3 BASF
- 12.1.3.1. Company Overview
- 12.1.3.2. Products
- 12.1.3.3. Company Financials
- 12.1.3.4. SWOT Analysis
- 12.1.4 Von Roll*List Not Exhaustive
- 12.1.4.1. Company Overview
- 12.1.4.2. Products
- 12.1.4.3. Company Financials
- 12.1.4.4. SWOT Analysis
- 12.1.5 Siemens
- 12.1.5.1. Company Overview
- 12.1.5.2. Products
- 12.1.5.3. Company Financials
- 12.1.5.4. SWOT Analysis
- 12.1.6 NGK Insulators
- 12.1.6.1. Company Overview
- 12.1.6.2. Products
- 12.1.6.3. Company Financials
- 12.1.6.4. SWOT Analysis
- 12.1.7 Huntsman
- 12.1.7.1. Company Overview
- 12.1.7.2. Products
- 12.1.7.3. Company Financials
- 12.1.7.4. SWOT Analysis
- 12.1.8 Bharat Heavy Electricals Limited
- 12.1.8.1. Company Overview
- 12.1.8.2. Products
- 12.1.8.3. Company Financials
- 12.1.8.4. SWOT Analysis
- 12.1.9 Owens Corning
- 12.1.9.1. Company Overview
- 12.1.9.2. Products
- 12.1.9.3. Company Financials
- 12.1.9.4. SWOT Analysis
- 12.1.10 Krempel GmbH
- 12.1.10.1. Company Overview
- 12.1.10.2. Products
- 12.1.10.3. Company Financials
- 12.1.10.4. SWOT Analysis
- 12.1.11 Toshiba
- 12.1.11.1. Company Overview
- 12.1.11.2. Products
- 12.1.11.3. Company Financials
- 12.1.11.4. SWOT Analysis
- 12.1.12 ABB
- 12.1.12.1. Company Overview
- 12.1.12.2. Products
- 12.1.12.3. Company Financials
- 12.1.12.4. SWOT Analysis
- 12.1.1 Knauf Insulation Group
- 12.2. Market Entropy
- 12.2.1 Company's Key Areas Served
- 12.2.2 Recent Developments
- 12.3. Company Market Share Analysis 2025
- 12.3.1 Top 5 Companies Market Share Analysis
- 12.3.2 Top 3 Companies Market Share Analysis
- 12.4. List of Potential Customers
- 13. Research Methodology
List of Figures
- Figure 1: Global Electrical Insulation Materials Industry Revenue Breakdown (billion, %) by Region 2025 & 2033
- Figure 2: Asia Pacific Electrical Insulation Materials Industry Revenue (billion), by Type 2025 & 2033
- Figure 3: Asia Pacific Electrical Insulation Materials Industry Revenue Share (%), by Type 2025 & 2033
- Figure 4: Asia Pacific Electrical Insulation Materials Industry Revenue (billion), by Voltage 2025 & 2033
- Figure 5: Asia Pacific Electrical Insulation Materials Industry Revenue Share (%), by Voltage 2025 & 2033
- Figure 6: Asia Pacific Electrical Insulation Materials Industry Revenue (billion), by Application 2025 & 2033
- Figure 7: Asia Pacific Electrical Insulation Materials Industry Revenue Share (%), by Application 2025 & 2033
- Figure 8: Asia Pacific Electrical Insulation Materials Industry Revenue (billion), by Country 2025 & 2033
- Figure 9: Asia Pacific Electrical Insulation Materials Industry Revenue Share (%), by Country 2025 & 2033
- Figure 10: North America Electrical Insulation Materials Industry Revenue (billion), by Type 2025 & 2033
- Figure 11: North America Electrical Insulation Materials Industry Revenue Share (%), by Type 2025 & 2033
- Figure 12: North America Electrical Insulation Materials Industry Revenue (billion), by Voltage 2025 & 2033
- Figure 13: North America Electrical Insulation Materials Industry Revenue Share (%), by Voltage 2025 & 2033
- Figure 14: North America Electrical Insulation Materials Industry Revenue (billion), by Application 2025 & 2033
- Figure 15: North America Electrical Insulation Materials Industry Revenue Share (%), by Application 2025 & 2033
- Figure 16: North America Electrical Insulation Materials Industry Revenue (billion), by Country 2025 & 2033
- Figure 17: North America Electrical Insulation Materials Industry Revenue Share (%), by Country 2025 & 2033
- Figure 18: Europe Electrical Insulation Materials Industry Revenue (billion), by Type 2025 & 2033
- Figure 19: Europe Electrical Insulation Materials Industry Revenue Share (%), by Type 2025 & 2033
- Figure 20: Europe Electrical Insulation Materials Industry Revenue (billion), by Voltage 2025 & 2033
- Figure 21: Europe Electrical Insulation Materials Industry Revenue Share (%), by Voltage 2025 & 2033
- Figure 22: Europe Electrical Insulation Materials Industry Revenue (billion), by Application 2025 & 2033
- Figure 23: Europe Electrical Insulation Materials Industry Revenue Share (%), by Application 2025 & 2033
- Figure 24: Europe Electrical Insulation Materials Industry Revenue (billion), by Country 2025 & 2033
- Figure 25: Europe Electrical Insulation Materials Industry Revenue Share (%), by Country 2025 & 2033
- Figure 26: South America Electrical Insulation Materials Industry Revenue (billion), by Type 2025 & 2033
- Figure 27: South America Electrical Insulation Materials Industry Revenue Share (%), by Type 2025 & 2033
- Figure 28: South America Electrical Insulation Materials Industry Revenue (billion), by Voltage 2025 & 2033
- Figure 29: South America Electrical Insulation Materials Industry Revenue Share (%), by Voltage 2025 & 2033
- Figure 30: South America Electrical Insulation Materials Industry Revenue (billion), by Application 2025 & 2033
- Figure 31: South America Electrical Insulation Materials Industry Revenue Share (%), by Application 2025 & 2033
- Figure 32: South America Electrical Insulation Materials Industry Revenue (billion), by Country 2025 & 2033
- Figure 33: South America Electrical Insulation Materials Industry Revenue Share (%), by Country 2025 & 2033
- Figure 34: Middle East and Africa Electrical Insulation Materials Industry Revenue (billion), by Type 2025 & 2033
- Figure 35: Middle East and Africa Electrical Insulation Materials Industry Revenue Share (%), by Type 2025 & 2033
- Figure 36: Middle East and Africa Electrical Insulation Materials Industry Revenue (billion), by Voltage 2025 & 2033
- Figure 37: Middle East and Africa Electrical Insulation Materials Industry Revenue Share (%), by Voltage 2025 & 2033
- Figure 38: Middle East and Africa Electrical Insulation Materials Industry Revenue (billion), by Application 2025 & 2033
- Figure 39: Middle East and Africa Electrical Insulation Materials Industry Revenue Share (%), by Application 2025 & 2033
- Figure 40: Middle East and Africa Electrical Insulation Materials Industry Revenue (billion), by Country 2025 & 2033
- Figure 41: Middle East and Africa Electrical Insulation Materials Industry Revenue Share (%), by Country 2025 & 2033
List of Tables
- Table 1: Global Electrical Insulation Materials Industry Revenue billion Forecast, by Type 2020 & 2033
- Table 2: Global Electrical Insulation Materials Industry Revenue billion Forecast, by Voltage 2020 & 2033
- Table 3: Global Electrical Insulation Materials Industry Revenue billion Forecast, by Application 2020 & 2033
- Table 4: Global Electrical Insulation Materials Industry Revenue billion Forecast, by Region 2020 & 2033
- Table 5: Global Electrical Insulation Materials Industry Revenue billion Forecast, by Type 2020 & 2033
- Table 6: Global Electrical Insulation Materials Industry Revenue billion Forecast, by Voltage 2020 & 2033
- Table 7: Global Electrical Insulation Materials Industry Revenue billion Forecast, by Application 2020 & 2033
- Table 8: Global Electrical Insulation Materials Industry Revenue billion Forecast, by Country 2020 & 2033
- Table 9: China Electrical Insulation Materials Industry Revenue (billion) Forecast, by Application 2020 & 2033
- Table 10: India Electrical Insulation Materials Industry Revenue (billion) Forecast, by Application 2020 & 2033
- Table 11: Japan Electrical Insulation Materials Industry Revenue (billion) Forecast, by Application 2020 & 2033
- Table 12: South Korea Electrical Insulation Materials Industry Revenue (billion) Forecast, by Application 2020 & 2033
- Table 13: Rest of Asia Pacific Electrical Insulation Materials Industry Revenue (billion) Forecast, by Application 2020 & 2033
- Table 14: Global Electrical Insulation Materials Industry Revenue billion Forecast, by Type 2020 & 2033
- Table 15: Global Electrical Insulation Materials Industry Revenue billion Forecast, by Voltage 2020 & 2033
- Table 16: Global Electrical Insulation Materials Industry Revenue billion Forecast, by Application 2020 & 2033
- Table 17: Global Electrical Insulation Materials Industry Revenue billion Forecast, by Country 2020 & 2033
- Table 18: United States Electrical Insulation Materials Industry Revenue (billion) Forecast, by Application 2020 & 2033
- Table 19: Canada Electrical Insulation Materials Industry Revenue (billion) Forecast, by Application 2020 & 2033
- Table 20: Mexico Electrical Insulation Materials Industry Revenue (billion) Forecast, by Application 2020 & 2033
- Table 21: Global Electrical Insulation Materials Industry Revenue billion Forecast, by Type 2020 & 2033
- Table 22: Global Electrical Insulation Materials Industry Revenue billion Forecast, by Voltage 2020 & 2033
- Table 23: Global Electrical Insulation Materials Industry Revenue billion Forecast, by Application 2020 & 2033
- Table 24: Global Electrical Insulation Materials Industry Revenue billion Forecast, by Country 2020 & 2033
- Table 25: Germany Electrical Insulation Materials Industry Revenue (billion) Forecast, by Application 2020 & 2033
- Table 26: United Kingdom Electrical Insulation Materials Industry Revenue (billion) Forecast, by Application 2020 & 2033
- Table 27: France Electrical Insulation Materials Industry Revenue (billion) Forecast, by Application 2020 & 2033
- Table 28: Italy Electrical Insulation Materials Industry Revenue (billion) Forecast, by Application 2020 & 2033
- Table 29: Rest of Europe Electrical Insulation Materials Industry Revenue (billion) Forecast, by Application 2020 & 2033
- Table 30: Global Electrical Insulation Materials Industry Revenue billion Forecast, by Type 2020 & 2033
- Table 31: Global Electrical Insulation Materials Industry Revenue billion Forecast, by Voltage 2020 & 2033
- Table 32: Global Electrical Insulation Materials Industry Revenue billion Forecast, by Application 2020 & 2033
- Table 33: Global Electrical Insulation Materials Industry Revenue billion Forecast, by Country 2020 & 2033
- Table 34: Brazil Electrical Insulation Materials Industry Revenue (billion) Forecast, by Application 2020 & 2033
- Table 35: Argentina Electrical Insulation Materials Industry Revenue (billion) Forecast, by Application 2020 & 2033
- Table 36: Rest of South America Electrical Insulation Materials Industry Revenue (billion) Forecast, by Application 2020 & 2033
- Table 37: Global Electrical Insulation Materials Industry Revenue billion Forecast, by Type 2020 & 2033
- Table 38: Global Electrical Insulation Materials Industry Revenue billion Forecast, by Voltage 2020 & 2033
- Table 39: Global Electrical Insulation Materials Industry Revenue billion Forecast, by Application 2020 & 2033
- Table 40: Global Electrical Insulation Materials Industry Revenue billion Forecast, by Country 2020 & 2033
- Table 41: Saudi Arabia Electrical Insulation Materials Industry Revenue (billion) Forecast, by Application 2020 & 2033
- Table 42: South Africa Electrical Insulation Materials Industry Revenue (billion) Forecast, by Application 2020 & 2033
- Table 43: Rest of Middle East and Africa Electrical Insulation Materials Industry Revenue (billion) Forecast, by Application 2020 & 2033
Frequently Asked Questions
1. What is the projected Compound Annual Growth Rate (CAGR) of the Electrical Insulation Materials Industry?
The projected CAGR is approximately 13.6%.
2. Which companies are prominent players in the Electrical Insulation Materials Industry?
Key companies in the market include Knauf Insulation Group, General Electric, BASF, Von Roll*List Not Exhaustive, Siemens, NGK Insulators, Huntsman, Bharat Heavy Electricals Limited, Owens Corning, Krempel GmbH, Toshiba, ABB.
3. What are the main segments of the Electrical Insulation Materials Industry?
The market segments include Type, Voltage, Application.
4. Can you provide details about the market size?
The market size is estimated to be USD 12.39 billion as of 2022.
5. What are some drivers contributing to market growth?
Growing Demand from Transmission and Distribution Systems; Other Drivers.
6. What are the notable trends driving market growth?
Transmission and Cable Lines Application to Dominate the Market.
7. Are there any restraints impacting market growth?
High Costs of Electrical Insulation Materials; Other Restraints.
8. Can you provide examples of recent developments in the market?
May 2022: Krempel GmbH announced that Nomex 910, which DuPont previously developed, will now be produced and sold by Krempel. The product is a unique insulating material comprised of high-quality electrical grade cellulose pulp and web-like binders that can be used as interlayer insulation in liquid-immersed transformers for distribution and small power transformers.
9. What pricing options are available for accessing the report?
Pricing options include single-user, multi-user, and enterprise licenses priced at USD 4750, USD 5250, and USD 8750 respectively.
10. Is the market size provided in terms of value or volume?
The market size is provided in terms of value, measured in billion.
11. Are there any specific market keywords associated with the report?
Yes, the market keyword associated with the report is "Electrical Insulation Materials Industry," which aids in identifying and referencing the specific market segment covered.
12. How do I determine which pricing option suits my needs best?
The pricing options vary based on user requirements and access needs. Individual users may opt for single-user licenses, while businesses requiring broader access may choose multi-user or enterprise licenses for cost-effective access to the report.
13. Are there any additional resources or data provided in the Electrical Insulation Materials Industry report?
While the report offers comprehensive insights, it's advisable to review the specific contents or supplementary materials provided to ascertain if additional resources or data are available.
14. How can I stay updated on further developments or reports in the Electrical Insulation Materials Industry?
To stay informed about further developments, trends, and reports in the Electrical Insulation Materials Industry, consider subscribing to industry newsletters, following relevant companies and organizations, or regularly checking reputable industry news sources and publications.
Methodology
Step 1 - Identification of Relevant Samples Size from Population Database


Step 2 - Approaches for Defining Global Market Size (Value, Volume* & Price*)

Note*: In applicable scenarios
Step 3 - Data Sources
Primary Research
- Web Analytics
- Survey Reports
- Research Institute
- Latest Research Reports
- Opinion Leaders
Secondary Research
- Annual Reports
- White Paper
- Latest Press Release
- Industry Association
- Paid Database
- Investor Presentations

Step 4 - Data Triangulation
Involves using different sources of information in order to increase the validity of a study
These sources are likely to be stakeholders in a program - participants, other researchers, program staff, other community members, and so on.
Then we put all data in single framework & apply various statistical tools to find out the dynamic on the market.
During the analysis stage, feedback from the stakeholder groups would be compared to determine areas of agreement as well as areas of divergence

