Key Insights
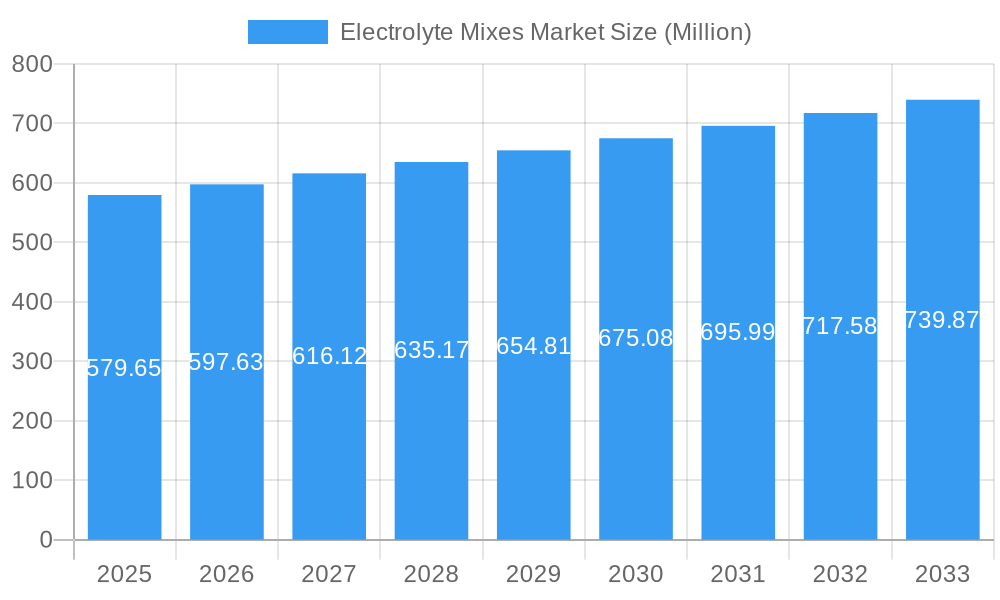
The global electrolyte mixes market, valued at $579.65 million in 2025, is projected to experience steady growth, driven by increasing health consciousness and the rising popularity of fitness activities. The market's Compound Annual Growth Rate (CAGR) of 2.81% from 2019 to 2024 suggests a consistent demand for electrolyte replenishment products. Key growth drivers include the expanding sports nutrition segment, fueled by participation in endurance sports and intense physical activities. Furthermore, the convenience of ready-to-drink (RTD) beverages and the increasing awareness of electrolyte imbalances contribute to market expansion. Supermarkets/hypermarkets currently dominate the distribution channels, however, online retail stores are witnessing significant growth due to increased e-commerce penetration and consumer preference for home delivery. While the unflavored segment holds a larger market share due to its versatility and suitability for various applications, flavored options cater to specific taste preferences and are driving innovation within the market. Competition among established players like Nestlé SA, PepsiCo Inc., and Unilever PLC, alongside emerging brands, fosters product diversification and enhances market dynamics. Growth may be slightly constrained by the availability of substitutes, potential concerns about added sugars in certain products, and price sensitivity in some market segments.
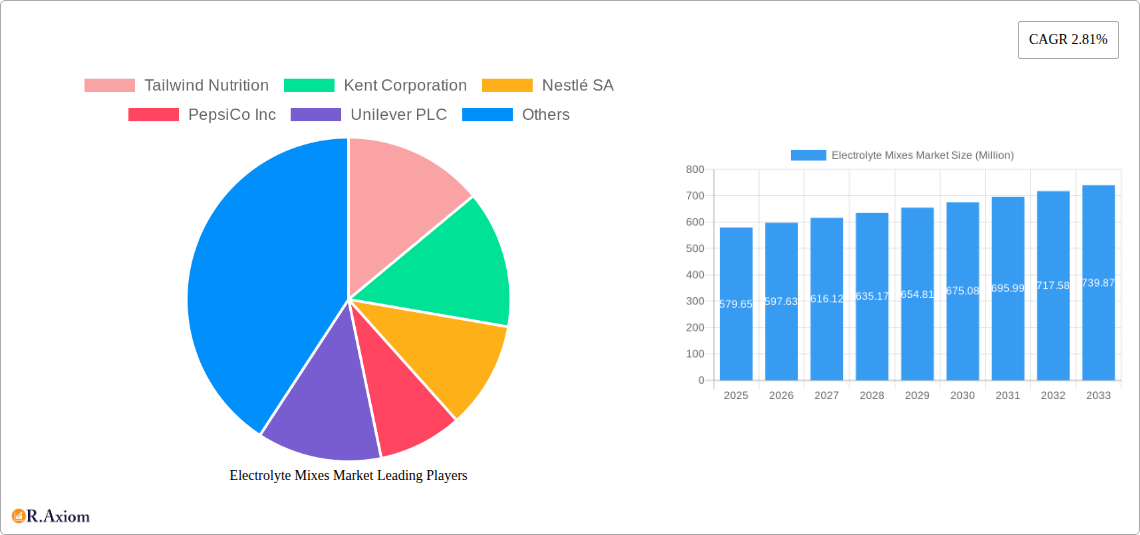
Electrolyte Mixes Market Market Size (In Million)
Looking ahead to 2033, the market is poised for continued, albeit moderate, expansion. Factors such as increasing disposable incomes in developing economies, particularly in Asia-Pacific, and the rising prevalence of chronic health conditions requiring electrolyte balance management, will fuel growth. The continued focus on product innovation, including the development of low-sugar and organic options, will further shape market trends. The competitive landscape is expected to remain dynamic, with companies focusing on strategic partnerships, product differentiation, and expansion into new geographical markets to maintain a competitive edge. The proliferation of electrolyte-enhanced functional foods and beverages further expands the market's potential. The diversification of distribution channels, particularly the growth of online and specialized sports nutrition retailers, will continue to provide significant opportunities for market growth and expansion.
Electrolyte Mixes Market Company Market Share
Electrolyte Mixes Market: A Comprehensive Report (2019-2033)
This comprehensive report provides an in-depth analysis of the global electrolyte mixes market, covering the period from 2019 to 2033. It offers actionable insights into market dynamics, competitive landscapes, and future growth prospects, enabling stakeholders to make informed strategic decisions. The report utilizes a robust methodology incorporating data from various sources and rigorous analytical techniques, focusing on key market segments and influential players. The estimated market value for 2025 is xx Million, with a projected forecast period of 2025-2033 and a historical period of 2019-2024. The base year for this analysis is 2025.
Electrolyte Mixes Market Concentration & Innovation
The electrolyte mixes market exhibits a moderately concentrated structure, with a few major players commanding significant market share. Tailwind Nutrition, Kent Corporation, Nestlé SA, PepsiCo Inc, Unilever PLC, Abbott Laboratories, LyteLine LLC, Otsuka Holdings Co Ltd, Vitalyte Sports Nutrition Inc, and Ultima Health Products Inc are some of the key players. However, the presence of numerous smaller players indicates a dynamic competitive landscape. Market share data for individual companies is currently unavailable and will be included in the final report (xx%).
Innovation in the sector is driven by several factors, including the rising demand for convenient and functional hydration solutions, the development of new formulations with enhanced benefits, and the increasing adoption of advanced manufacturing techniques. Regulatory frameworks governing food and beverage safety significantly impact market dynamics, influencing ingredient selection and product labeling requirements. The market also faces competition from substitute products, such as plain water and other sports drinks. Consumer preference is evolving toward products containing natural ingredients and functional benefits beyond hydration.
M&A activity in the electrolyte mixes market has been notably active. Recent deals include Nestlé Health Science's acquisition of Nuun in July 2021, illustrating the strategic consolidation trends within the industry. The overall value of M&A transactions in the past five years is estimated at xx Million.
- Market Concentration: Moderately Concentrated
- Innovation Drivers: Demand for convenient hydration, new formulations, advanced manufacturing.
- Regulatory Framework: Strict food and beverage safety standards.
- Product Substitutes: Plain water, other sports drinks.
- End-User Trends: Preference for natural ingredients and functional benefits.
- M&A Activity: Significant activity, with xx Million in total deal value over the past 5 years.
Electrolyte Mixes Market Industry Trends & Insights
The global electrolyte mixes market is experiencing robust growth, driven by several factors. Increasing health consciousness among consumers and the growing prevalence of active lifestyles are key drivers, boosting demand for hydration solutions. Technological advancements are facilitating the development of innovative product formats, such as ready-to-drink (RTD) beverages with enhanced taste and functionality, and convenient powder mixes. Consumer preferences are evolving toward natural ingredients, clean labels, and functional benefits beyond basic hydration, which is leading to product innovation and differentiation. Competitive dynamics are characterized by intense rivalry among established players, as well as the emergence of new entrants. The market CAGR for the forecast period (2025-2033) is projected to be xx%, with market penetration steadily increasing across various regions. The market is also witnessing the adoption of sustainable packaging solutions.
Dominant Markets & Segments in Electrolyte Mixes Market
The North American region currently holds the largest market share, driven by high consumer awareness and spending on health and wellness products. Within segments:
Product Type: RTD beverages hold the largest market share, due to their convenience and immediate hydration benefits. However, electrolyte powders are witnessing rapid growth due to their cost-effectiveness and portability. Tablets are a smaller segment but are gaining traction due to their convenience.
Flavor: Flavored electrolyte mixes dominate the market, with a preference for natural fruit flavors. Unflavored options cater to a niche market of consumers who prefer customization.
Distribution Channel: Supermarkets/hypermarkets account for the majority of sales, followed by convenience stores. Online retail channels are steadily gaining traction, fueled by e-commerce growth. Pharmacies/drug stores represent a significant segment catering to health-conscious consumers.
Key Drivers (Vary by Segment):
- North America: High disposable income, increasing health awareness.
- RTD Beverages: Convenience and immediate hydration.
- Flavored Mixes: Consumer preference for enhanced taste.
- Supermarkets/Hypermarkets: Wide reach, established distribution networks.
Electrolyte Mixes Market Product Developments
Recent product developments focus on functional benefits beyond basic hydration, incorporating probiotics, antioxidants, and other beneficial ingredients. Technological advancements are driving the creation of more sustainable and convenient packaging, such as recyclable pouches and refillable containers. Companies are also focusing on improved taste profiles and natural flavors to enhance consumer appeal. These innovations aim to address evolving consumer preferences and create a competitive advantage in the market.
Report Scope & Segmentation Analysis
This report provides a comprehensive segmentation analysis of the electrolyte mixes market across various parameters:
Product Type: RTD Beverages, Electrolyte Powders, Tablets (Growth projections and market sizes will be detailed in the full report)
Flavor: Flavored, Unflavored (Growth projections and market sizes will be detailed in the full report)
Distribution Channel: Supermarkets/Hypermarkets, Convenience Stores, Pharmacies/Drug Stores, Online Retail Stores, Other Distribution Channels (Growth projections and market sizes will be detailed in the full report)
Key Drivers of Electrolyte Mixes Market Growth
Key growth drivers include rising health awareness, increasing participation in sports and fitness activities, and the growing demand for convenient and functional hydration solutions. Technological innovations, particularly in product formulation and packaging, also contribute to market growth. Favorable economic conditions in several key regions further stimulate market expansion.
Challenges in the Electrolyte Mixes Market Sector
Challenges include intense competition, fluctuating raw material prices, stringent regulatory requirements concerning food safety and labeling, and concerns about the potential health risks associated with excessive electrolyte consumption. Supply chain disruptions can also impact production and distribution, leading to market instability.
Emerging Opportunities in Electrolyte Mixes Market
Emerging opportunities include the growing demand for specialized electrolyte mixes targeting specific consumer groups (e.g., athletes, elderly populations), the expansion into new geographic markets, and the development of innovative product formats, such as electrolyte-infused foods.
Leading Players in the Electrolyte Mixes Market Market
- Tailwind Nutrition
- Kent Corporation
- Nestlé SA
- PepsiCo Inc
- Unilever PLC
- Abbott Laboratories
- LyteLine LLC
- Otsuka Holdings Co Ltd
- Vitalyte Sports Nutrition Inc
- Ultima Health Products Inc
Key Developments in Electrolyte Mixes Market Industry
JUL 2021: Nestlé Health Science acquired Nuun, expanding its portfolio of functional hydration products. This acquisition strengthened Nestlé's position in the market and broadened its product offerings.
MAR 2022: Gatorade Canada's partnership with Canada Soccer boosted brand visibility and market penetration within the sports nutrition sector.
MAY 2022: Liquid IV launched Hydration Multiplier+ Powdered Probiotic Kombucha, introducing a new product category with added health benefits, driving innovation within the electrolyte mixes market.
Strategic Outlook for Electrolyte Mixes Market Market
The future of the electrolyte mixes market looks promising, driven by sustained growth in health consciousness, an increase in active lifestyles, and continuous product innovation. The market will likely witness increased consolidation through mergers and acquisitions, and further diversification of product offerings to cater to niche segments. Expansion into emerging markets and the adoption of sustainable practices will also shape the market’s trajectory.
Electrolyte Mixes Market Segmentation
-
1. Product Type
- 1.1. RTD Beverages
- 1.2. Electrolyte Powders
- 1.3. Tablets
-
2. Flavor
- 2.1. Flavored
- 2.2. Unflavored
-
3. Distribution Channel
- 3.1. Supermarkets/Hypermarkets
- 3.2. Convenience Stores
- 3.3. Pharmacies/Drug Stores
- 3.4. Online Retail Stores
- 3.5. Other Distribution Channels
Electrolyte Mixes Market Segmentation By Geography
-
1. North America
- 1.1. United States
- 1.2. Canada
- 1.3. Mexico
- 1.4. Rest of North America
-
2. Europe
- 2.1. United Kingdom
- 2.2. Germany
- 2.3. France
- 2.4. Russia
- 2.5. Italy
- 2.6. Spain
- 2.7. Rest of Europe
-
3. Asia Pacific
- 3.1. China
- 3.2. India
- 3.3. Japan
- 3.4. Australia
- 3.5. Rest of Asia Pacific
-
4. South America
- 4.1. Brazil
- 4.2. Argentina
- 4.3. Rest of South America
-
5. Middle East and Africa
- 5.1. South Africa
- 5.2. United Arab Emirates
- 5.3. Rest of Middle East and Africa
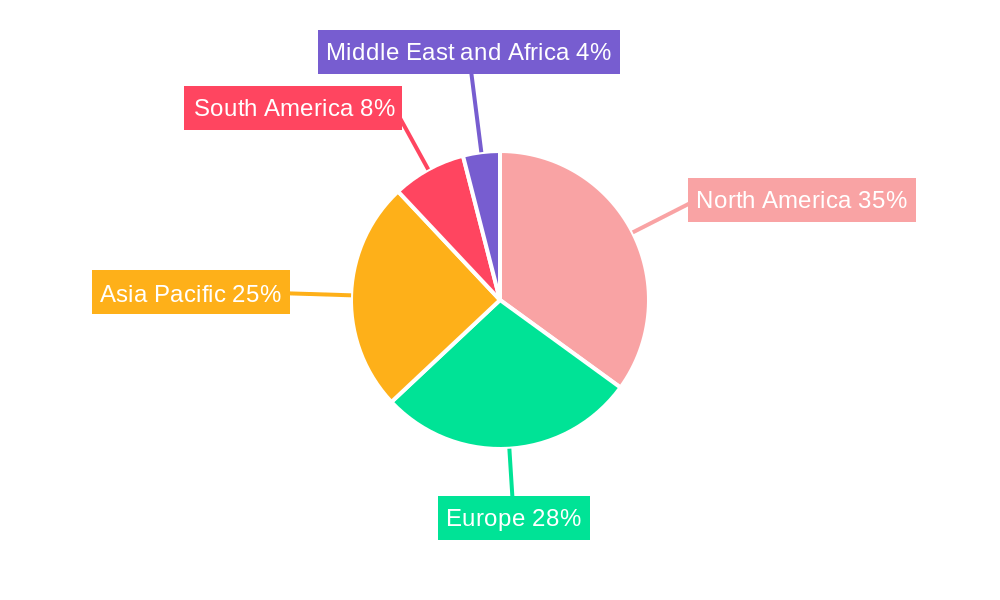
Electrolyte Mixes Market Regional Market Share
Geographic Coverage of Electrolyte Mixes Market
Electrolyte Mixes Market REPORT HIGHLIGHTS
| Aspects | Details |
|---|---|
| Study Period | 2020-2034 |
| Base Year | 2025 |
| Estimated Year | 2026 |
| Forecast Period | 2026-2034 |
| Historical Period | 2020-2025 |
| Growth Rate | CAGR of 2.81% from 2020-2034 |
| Segmentation |
|
Table of Contents
- 1. Introduction
- 1.1. Research Scope
- 1.2. Market Segmentation
- 1.3. Research Objective
- 1.4. Definitions and Assumptions
- 2. Executive Summary
- 2.1. Market Snapshot
- 3. Market Dynamics
- 3.1. Market Drivers
- 3.2. Market Restrains
- 3.3. Market Trends
- 3.4. Market Opportunities
- 4. Market Factor Analysis
- 4.1. Porters Five Forces
- 4.1.1. Bargaining Power of Suppliers
- 4.1.2. Bargaining Power of Buyers
- 4.1.3. Threat of New Entrants
- 4.1.4. Threat of Substitutes
- 4.1.5. Competitive Rivalry
- 4.2. PESTEL analysis
- 4.3. BCG Analysis
- 4.3.1. Stars (High Growth, High Market Share)
- 4.3.2. Cash Cows (Low Growth, High Market Share)
- 4.3.3. Question Mark (High Growth, Low Market Share)
- 4.3.4. Dogs (Low Growth, Low Market Share)
- 4.4. Ansoff Matrix Analysis
- 4.5. Supply Chain Analysis
- 4.6. Regulatory Landscape
- 4.7. Current Market Potential and Opportunity Assessment (TAM–SAM–SOM Framework)
- 4.8. RAX Analyst Note
- 4.1. Porters Five Forces
- 5. Market Analysis, Insights and Forecast 2021-2033
- 5.1. Market Analysis, Insights and Forecast - by Product Type
- 5.1.1. RTD Beverages
- 5.1.2. Electrolyte Powders
- 5.1.3. Tablets
- 5.2. Market Analysis, Insights and Forecast - by Flavor
- 5.2.1. Flavored
- 5.2.2. Unflavored
- 5.3. Market Analysis, Insights and Forecast - by Distribution Channel
- 5.3.1. Supermarkets/Hypermarkets
- 5.3.2. Convenience Stores
- 5.3.3. Pharmacies/Drug Stores
- 5.3.4. Online Retail Stores
- 5.3.5. Other Distribution Channels
- 5.4. Market Analysis, Insights and Forecast - by Region
- 5.4.1. North America
- 5.4.2. Europe
- 5.4.3. Asia Pacific
- 5.4.4. South America
- 5.4.5. Middle East and Africa
- 5.1. Market Analysis, Insights and Forecast - by Product Type
- 6. Global Electrolyte Mixes Market Analysis, Insights and Forecast, 2021-2033
- 6.1. Market Analysis, Insights and Forecast - by Product Type
- 6.1.1. RTD Beverages
- 6.1.2. Electrolyte Powders
- 6.1.3. Tablets
- 6.2. Market Analysis, Insights and Forecast - by Flavor
- 6.2.1. Flavored
- 6.2.2. Unflavored
- 6.3. Market Analysis, Insights and Forecast - by Distribution Channel
- 6.3.1. Supermarkets/Hypermarkets
- 6.3.2. Convenience Stores
- 6.3.3. Pharmacies/Drug Stores
- 6.3.4. Online Retail Stores
- 6.3.5. Other Distribution Channels
- 6.1. Market Analysis, Insights and Forecast - by Product Type
- 7. North America Electrolyte Mixes Market Analysis, Insights and Forecast, 2020-2032
- 7.1. Market Analysis, Insights and Forecast - by Product Type
- 7.1.1. RTD Beverages
- 7.1.2. Electrolyte Powders
- 7.1.3. Tablets
- 7.2. Market Analysis, Insights and Forecast - by Flavor
- 7.2.1. Flavored
- 7.2.2. Unflavored
- 7.3. Market Analysis, Insights and Forecast - by Distribution Channel
- 7.3.1. Supermarkets/Hypermarkets
- 7.3.2. Convenience Stores
- 7.3.3. Pharmacies/Drug Stores
- 7.3.4. Online Retail Stores
- 7.3.5. Other Distribution Channels
- 7.1. Market Analysis, Insights and Forecast - by Product Type
- 8. Europe Electrolyte Mixes Market Analysis, Insights and Forecast, 2020-2032
- 8.1. Market Analysis, Insights and Forecast - by Product Type
- 8.1.1. RTD Beverages
- 8.1.2. Electrolyte Powders
- 8.1.3. Tablets
- 8.2. Market Analysis, Insights and Forecast - by Flavor
- 8.2.1. Flavored
- 8.2.2. Unflavored
- 8.3. Market Analysis, Insights and Forecast - by Distribution Channel
- 8.3.1. Supermarkets/Hypermarkets
- 8.3.2. Convenience Stores
- 8.3.3. Pharmacies/Drug Stores
- 8.3.4. Online Retail Stores
- 8.3.5. Other Distribution Channels
- 8.1. Market Analysis, Insights and Forecast - by Product Type
- 9. Asia Pacific Electrolyte Mixes Market Analysis, Insights and Forecast, 2020-2032
- 9.1. Market Analysis, Insights and Forecast - by Product Type
- 9.1.1. RTD Beverages
- 9.1.2. Electrolyte Powders
- 9.1.3. Tablets
- 9.2. Market Analysis, Insights and Forecast - by Flavor
- 9.2.1. Flavored
- 9.2.2. Unflavored
- 9.3. Market Analysis, Insights and Forecast - by Distribution Channel
- 9.3.1. Supermarkets/Hypermarkets
- 9.3.2. Convenience Stores
- 9.3.3. Pharmacies/Drug Stores
- 9.3.4. Online Retail Stores
- 9.3.5. Other Distribution Channels
- 9.1. Market Analysis, Insights and Forecast - by Product Type
- 10. South America Electrolyte Mixes Market Analysis, Insights and Forecast, 2020-2032
- 10.1. Market Analysis, Insights and Forecast - by Product Type
- 10.1.1. RTD Beverages
- 10.1.2. Electrolyte Powders
- 10.1.3. Tablets
- 10.2. Market Analysis, Insights and Forecast - by Flavor
- 10.2.1. Flavored
- 10.2.2. Unflavored
- 10.3. Market Analysis, Insights and Forecast - by Distribution Channel
- 10.3.1. Supermarkets/Hypermarkets
- 10.3.2. Convenience Stores
- 10.3.3. Pharmacies/Drug Stores
- 10.3.4. Online Retail Stores
- 10.3.5. Other Distribution Channels
- 10.1. Market Analysis, Insights and Forecast - by Product Type
- 11. Middle East and Africa Electrolyte Mixes Market Analysis, Insights and Forecast, 2020-2032
- 11.1. Market Analysis, Insights and Forecast - by Product Type
- 11.1.1. RTD Beverages
- 11.1.2. Electrolyte Powders
- 11.1.3. Tablets
- 11.2. Market Analysis, Insights and Forecast - by Flavor
- 11.2.1. Flavored
- 11.2.2. Unflavored
- 11.3. Market Analysis, Insights and Forecast - by Distribution Channel
- 11.3.1. Supermarkets/Hypermarkets
- 11.3.2. Convenience Stores
- 11.3.3. Pharmacies/Drug Stores
- 11.3.4. Online Retail Stores
- 11.3.5. Other Distribution Channels
- 11.1. Market Analysis, Insights and Forecast - by Product Type
- 12. Competitive Analysis
- 12.1. Company Profiles
- 12.1.1 Tailwind Nutrition
- 12.1.1.1. Company Overview
- 12.1.1.2. Products
- 12.1.1.3. Company Financials
- 12.1.1.4. SWOT Analysis
- 12.1.2 Kent Corporation
- 12.1.2.1. Company Overview
- 12.1.2.2. Products
- 12.1.2.3. Company Financials
- 12.1.2.4. SWOT Analysis
- 12.1.3 Nestlé SA
- 12.1.3.1. Company Overview
- 12.1.3.2. Products
- 12.1.3.3. Company Financials
- 12.1.3.4. SWOT Analysis
- 12.1.4 PepsiCo Inc
- 12.1.4.1. Company Overview
- 12.1.4.2. Products
- 12.1.4.3. Company Financials
- 12.1.4.4. SWOT Analysis
- 12.1.5 Unilever PLC
- 12.1.5.1. Company Overview
- 12.1.5.2. Products
- 12.1.5.3. Company Financials
- 12.1.5.4. SWOT Analysis
- 12.1.6 Abbott Laboratories
- 12.1.6.1. Company Overview
- 12.1.6.2. Products
- 12.1.6.3. Company Financials
- 12.1.6.4. SWOT Analysis
- 12.1.7 LyteLine LLC
- 12.1.7.1. Company Overview
- 12.1.7.2. Products
- 12.1.7.3. Company Financials
- 12.1.7.4. SWOT Analysis
- 12.1.8 Otsuka Holdings Co Ltd
- 12.1.8.1. Company Overview
- 12.1.8.2. Products
- 12.1.8.3. Company Financials
- 12.1.8.4. SWOT Analysis
- 12.1.9 Vitalyte Sports Nutrition Inc *List Not Exhaustive
- 12.1.9.1. Company Overview
- 12.1.9.2. Products
- 12.1.9.3. Company Financials
- 12.1.9.4. SWOT Analysis
- 12.1.10 Ultima Health Products Inc
- 12.1.10.1. Company Overview
- 12.1.10.2. Products
- 12.1.10.3. Company Financials
- 12.1.10.4. SWOT Analysis
- 12.1.1 Tailwind Nutrition
- 12.2. Market Entropy
- 12.2.1 Company's Key Areas Served
- 12.2.2 Recent Developments
- 12.3. Company Market Share Analysis 2025
- 12.3.1 Top 5 Companies Market Share Analysis
- 12.3.2 Top 3 Companies Market Share Analysis
- 12.4. List of Potential Customers
- 13. Research Methodology
List of Figures
- Figure 1: Global Electrolyte Mixes Market Revenue Breakdown (Million, %) by Region 2025 & 2033
- Figure 2: North America Electrolyte Mixes Market Revenue (Million), by Product Type 2025 & 2033
- Figure 3: North America Electrolyte Mixes Market Revenue Share (%), by Product Type 2025 & 2033
- Figure 4: North America Electrolyte Mixes Market Revenue (Million), by Flavor 2025 & 2033
- Figure 5: North America Electrolyte Mixes Market Revenue Share (%), by Flavor 2025 & 2033
- Figure 6: North America Electrolyte Mixes Market Revenue (Million), by Distribution Channel 2025 & 2033
- Figure 7: North America Electrolyte Mixes Market Revenue Share (%), by Distribution Channel 2025 & 2033
- Figure 8: North America Electrolyte Mixes Market Revenue (Million), by Country 2025 & 2033
- Figure 9: North America Electrolyte Mixes Market Revenue Share (%), by Country 2025 & 2033
- Figure 10: Europe Electrolyte Mixes Market Revenue (Million), by Product Type 2025 & 2033
- Figure 11: Europe Electrolyte Mixes Market Revenue Share (%), by Product Type 2025 & 2033
- Figure 12: Europe Electrolyte Mixes Market Revenue (Million), by Flavor 2025 & 2033
- Figure 13: Europe Electrolyte Mixes Market Revenue Share (%), by Flavor 2025 & 2033
- Figure 14: Europe Electrolyte Mixes Market Revenue (Million), by Distribution Channel 2025 & 2033
- Figure 15: Europe Electrolyte Mixes Market Revenue Share (%), by Distribution Channel 2025 & 2033
- Figure 16: Europe Electrolyte Mixes Market Revenue (Million), by Country 2025 & 2033
- Figure 17: Europe Electrolyte Mixes Market Revenue Share (%), by Country 2025 & 2033
- Figure 18: Asia Pacific Electrolyte Mixes Market Revenue (Million), by Product Type 2025 & 2033
- Figure 19: Asia Pacific Electrolyte Mixes Market Revenue Share (%), by Product Type 2025 & 2033
- Figure 20: Asia Pacific Electrolyte Mixes Market Revenue (Million), by Flavor 2025 & 2033
- Figure 21: Asia Pacific Electrolyte Mixes Market Revenue Share (%), by Flavor 2025 & 2033
- Figure 22: Asia Pacific Electrolyte Mixes Market Revenue (Million), by Distribution Channel 2025 & 2033
- Figure 23: Asia Pacific Electrolyte Mixes Market Revenue Share (%), by Distribution Channel 2025 & 2033
- Figure 24: Asia Pacific Electrolyte Mixes Market Revenue (Million), by Country 2025 & 2033
- Figure 25: Asia Pacific Electrolyte Mixes Market Revenue Share (%), by Country 2025 & 2033
- Figure 26: South America Electrolyte Mixes Market Revenue (Million), by Product Type 2025 & 2033
- Figure 27: South America Electrolyte Mixes Market Revenue Share (%), by Product Type 2025 & 2033
- Figure 28: South America Electrolyte Mixes Market Revenue (Million), by Flavor 2025 & 2033
- Figure 29: South America Electrolyte Mixes Market Revenue Share (%), by Flavor 2025 & 2033
- Figure 30: South America Electrolyte Mixes Market Revenue (Million), by Distribution Channel 2025 & 2033
- Figure 31: South America Electrolyte Mixes Market Revenue Share (%), by Distribution Channel 2025 & 2033
- Figure 32: South America Electrolyte Mixes Market Revenue (Million), by Country 2025 & 2033
- Figure 33: South America Electrolyte Mixes Market Revenue Share (%), by Country 2025 & 2033
- Figure 34: Middle East and Africa Electrolyte Mixes Market Revenue (Million), by Product Type 2025 & 2033
- Figure 35: Middle East and Africa Electrolyte Mixes Market Revenue Share (%), by Product Type 2025 & 2033
- Figure 36: Middle East and Africa Electrolyte Mixes Market Revenue (Million), by Flavor 2025 & 2033
- Figure 37: Middle East and Africa Electrolyte Mixes Market Revenue Share (%), by Flavor 2025 & 2033
- Figure 38: Middle East and Africa Electrolyte Mixes Market Revenue (Million), by Distribution Channel 2025 & 2033
- Figure 39: Middle East and Africa Electrolyte Mixes Market Revenue Share (%), by Distribution Channel 2025 & 2033
- Figure 40: Middle East and Africa Electrolyte Mixes Market Revenue (Million), by Country 2025 & 2033
- Figure 41: Middle East and Africa Electrolyte Mixes Market Revenue Share (%), by Country 2025 & 2033
List of Tables
- Table 1: Global Electrolyte Mixes Market Revenue Million Forecast, by Product Type 2020 & 2033
- Table 2: Global Electrolyte Mixes Market Revenue Million Forecast, by Flavor 2020 & 2033
- Table 3: Global Electrolyte Mixes Market Revenue Million Forecast, by Distribution Channel 2020 & 2033
- Table 4: Global Electrolyte Mixes Market Revenue Million Forecast, by Region 2020 & 2033
- Table 5: Global Electrolyte Mixes Market Revenue Million Forecast, by Product Type 2020 & 2033
- Table 6: Global Electrolyte Mixes Market Revenue Million Forecast, by Flavor 2020 & 2033
- Table 7: Global Electrolyte Mixes Market Revenue Million Forecast, by Distribution Channel 2020 & 2033
- Table 8: Global Electrolyte Mixes Market Revenue Million Forecast, by Country 2020 & 2033
- Table 9: United States Electrolyte Mixes Market Revenue (Million) Forecast, by Application 2020 & 2033
- Table 10: Canada Electrolyte Mixes Market Revenue (Million) Forecast, by Application 2020 & 2033
- Table 11: Mexico Electrolyte Mixes Market Revenue (Million) Forecast, by Application 2020 & 2033
- Table 12: Rest of North America Electrolyte Mixes Market Revenue (Million) Forecast, by Application 2020 & 2033
- Table 13: Global Electrolyte Mixes Market Revenue Million Forecast, by Product Type 2020 & 2033
- Table 14: Global Electrolyte Mixes Market Revenue Million Forecast, by Flavor 2020 & 2033
- Table 15: Global Electrolyte Mixes Market Revenue Million Forecast, by Distribution Channel 2020 & 2033
- Table 16: Global Electrolyte Mixes Market Revenue Million Forecast, by Country 2020 & 2033
- Table 17: United Kingdom Electrolyte Mixes Market Revenue (Million) Forecast, by Application 2020 & 2033
- Table 18: Germany Electrolyte Mixes Market Revenue (Million) Forecast, by Application 2020 & 2033
- Table 19: France Electrolyte Mixes Market Revenue (Million) Forecast, by Application 2020 & 2033
- Table 20: Russia Electrolyte Mixes Market Revenue (Million) Forecast, by Application 2020 & 2033
- Table 21: Italy Electrolyte Mixes Market Revenue (Million) Forecast, by Application 2020 & 2033
- Table 22: Spain Electrolyte Mixes Market Revenue (Million) Forecast, by Application 2020 & 2033
- Table 23: Rest of Europe Electrolyte Mixes Market Revenue (Million) Forecast, by Application 2020 & 2033
- Table 24: Global Electrolyte Mixes Market Revenue Million Forecast, by Product Type 2020 & 2033
- Table 25: Global Electrolyte Mixes Market Revenue Million Forecast, by Flavor 2020 & 2033
- Table 26: Global Electrolyte Mixes Market Revenue Million Forecast, by Distribution Channel 2020 & 2033
- Table 27: Global Electrolyte Mixes Market Revenue Million Forecast, by Country 2020 & 2033
- Table 28: China Electrolyte Mixes Market Revenue (Million) Forecast, by Application 2020 & 2033
- Table 29: India Electrolyte Mixes Market Revenue (Million) Forecast, by Application 2020 & 2033
- Table 30: Japan Electrolyte Mixes Market Revenue (Million) Forecast, by Application 2020 & 2033
- Table 31: Australia Electrolyte Mixes Market Revenue (Million) Forecast, by Application 2020 & 2033
- Table 32: Rest of Asia Pacific Electrolyte Mixes Market Revenue (Million) Forecast, by Application 2020 & 2033
- Table 33: Global Electrolyte Mixes Market Revenue Million Forecast, by Product Type 2020 & 2033
- Table 34: Global Electrolyte Mixes Market Revenue Million Forecast, by Flavor 2020 & 2033
- Table 35: Global Electrolyte Mixes Market Revenue Million Forecast, by Distribution Channel 2020 & 2033
- Table 36: Global Electrolyte Mixes Market Revenue Million Forecast, by Country 2020 & 2033
- Table 37: Brazil Electrolyte Mixes Market Revenue (Million) Forecast, by Application 2020 & 2033
- Table 38: Argentina Electrolyte Mixes Market Revenue (Million) Forecast, by Application 2020 & 2033
- Table 39: Rest of South America Electrolyte Mixes Market Revenue (Million) Forecast, by Application 2020 & 2033
- Table 40: Global Electrolyte Mixes Market Revenue Million Forecast, by Product Type 2020 & 2033
- Table 41: Global Electrolyte Mixes Market Revenue Million Forecast, by Flavor 2020 & 2033
- Table 42: Global Electrolyte Mixes Market Revenue Million Forecast, by Distribution Channel 2020 & 2033
- Table 43: Global Electrolyte Mixes Market Revenue Million Forecast, by Country 2020 & 2033
- Table 44: South Africa Electrolyte Mixes Market Revenue (Million) Forecast, by Application 2020 & 2033
- Table 45: United Arab Emirates Electrolyte Mixes Market Revenue (Million) Forecast, by Application 2020 & 2033
- Table 46: Rest of Middle East and Africa Electrolyte Mixes Market Revenue (Million) Forecast, by Application 2020 & 2033
Frequently Asked Questions
1. What is the projected Compound Annual Growth Rate (CAGR) of the Electrolyte Mixes Market?
The projected CAGR is approximately 2.81%.
2. Which companies are prominent players in the Electrolyte Mixes Market?
Key companies in the market include Tailwind Nutrition, Kent Corporation, Nestlé SA, PepsiCo Inc, Unilever PLC, Abbott Laboratories, LyteLine LLC, Otsuka Holdings Co Ltd, Vitalyte Sports Nutrition Inc *List Not Exhaustive, Ultima Health Products Inc.
3. What are the main segments of the Electrolyte Mixes Market?
The market segments include Product Type, Flavor, Distribution Channel.
4. Can you provide details about the market size?
The market size is estimated to be USD 579.65 Million as of 2022.
5. What are some drivers contributing to market growth?
Rising Demand For Ready Meals Food Products to Influence Growth; Increasing Demand for Organic and Vegan Ready-to-Eat food products..
6. What are the notable trends driving market growth?
Surging Interest Among Consumers in Physical Activities. Including Gyms.
7. Are there any restraints impacting market growth?
Rising Concern Over Health Issues Associated with Processed Foods.
8. Can you provide examples of recent developments in the market?
MAY 2022: Liquid IV announced the launch of Hydration Multiplier+ Powdered Probiotic Kombucha, a blendable mixture that contains electrolytes, Liquid IV's BC30 Probiotic, which boasts an impressive 1 billion colony forming units (CFU), and a powdered kombucha. These components together help in boosting gut health.
9. What pricing options are available for accessing the report?
Pricing options include single-user, multi-user, and enterprise licenses priced at USD 4750, USD 5250, and USD 8750 respectively.
10. Is the market size provided in terms of value or volume?
The market size is provided in terms of value, measured in Million.
11. Are there any specific market keywords associated with the report?
Yes, the market keyword associated with the report is "Electrolyte Mixes Market," which aids in identifying and referencing the specific market segment covered.
12. How do I determine which pricing option suits my needs best?
The pricing options vary based on user requirements and access needs. Individual users may opt for single-user licenses, while businesses requiring broader access may choose multi-user or enterprise licenses for cost-effective access to the report.
13. Are there any additional resources or data provided in the Electrolyte Mixes Market report?
While the report offers comprehensive insights, it's advisable to review the specific contents or supplementary materials provided to ascertain if additional resources or data are available.
14. How can I stay updated on further developments or reports in the Electrolyte Mixes Market?
To stay informed about further developments, trends, and reports in the Electrolyte Mixes Market, consider subscribing to industry newsletters, following relevant companies and organizations, or regularly checking reputable industry news sources and publications.
Methodology
Step 1 - Identification of Relevant Samples Size from Population Database


Step 2 - Approaches for Defining Global Market Size (Value, Volume* & Price*)

Note*: In applicable scenarios
Step 3 - Data Sources
Primary Research
- Web Analytics
- Survey Reports
- Research Institute
- Latest Research Reports
- Opinion Leaders
Secondary Research
- Annual Reports
- White Paper
- Latest Press Release
- Industry Association
- Paid Database
- Investor Presentations

Step 4 - Data Triangulation
Involves using different sources of information in order to increase the validity of a study
These sources are likely to be stakeholders in a program - participants, other researchers, program staff, other community members, and so on.
Then we put all data in single framework & apply various statistical tools to find out the dynamic on the market.
During the analysis stage, feedback from the stakeholder groups would be compared to determine areas of agreement as well as areas of divergence

