
Key Insights
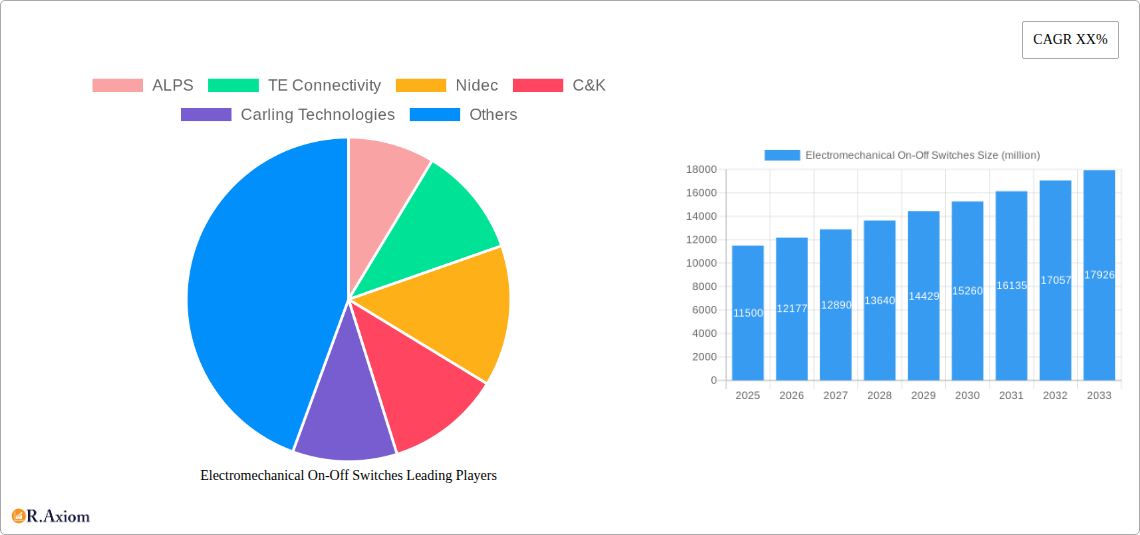
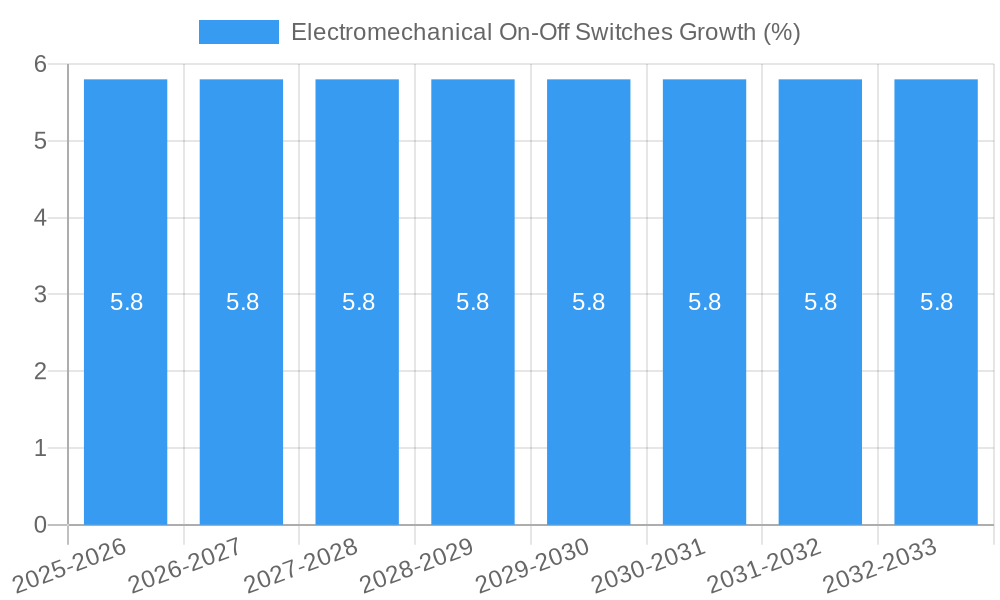
The global Electromechanical On-Off Switches market is experiencing robust growth, projected to reach an estimated $11,500 million by 2025, with a significant Compound Annual Growth Rate (CAGR) of 5.8% anticipated over the forecast period. This expansion is primarily driven by the escalating demand from the Military and Aerospace sectors, where the reliability and durability of electromechanical switches are paramount for critical operations. The Healthcare industry also presents a substantial opportunity, fueled by the increasing adoption of advanced medical devices requiring precise and dependable control mechanisms. Furthermore, the Automotive sector's rapid evolution towards electrification and autonomous driving features necessitates a surge in the deployment of sophisticated switch solutions. Emerging economies within the Asia Pacific region, particularly China and India, are set to become major growth hubs due to industrial expansion and increasing consumer electronics penetration.
The market's dynamism is further shaped by key trends such as miniaturization, enhanced sealing capabilities for harsh environments, and the integration of smart features for improved diagnostics and control. While the market enjoys strong growth drivers, certain restraints may impede its full potential. These include the increasing adoption of solid-state relays in specific applications, which offer faster switching speeds and longer lifespans, and the rising cost of raw materials, which can impact manufacturing expenses. However, the diverse applications across various industries, from consumer electronics to heavy industrial machinery, ensure a sustained demand. The market is segmented into Tactile, Rotary, Encoder, and Toggle switches, each catering to distinct functional requirements. Leading companies like ALPS, TE Connectivity, and Nidec are actively investing in research and development to innovate and expand their product portfolios, solidifying their positions in this competitive landscape.
Comprehensive Market Research Report: Electromechanical On-Off Switches (2019–2033)
This in-depth market research report provides a detailed analysis of the global Electromechanical On-Off Switches market from 2019 to 2033, with a base year of 2025 and a forecast period of 2025–2033. The study covers historical trends from 2019–2024 and offers critical insights into market dynamics, segmentation, key drivers, challenges, and future opportunities. This report is designed to equip industry stakeholders, including manufacturers, suppliers, investors, and end-users, with actionable intelligence to navigate the evolving landscape of electromechanical switches.
Electromechanical On-Off Switches Market Concentration & Innovation
The global Electromechanical On-Off Switches market exhibits a moderate to high level of concentration, with several key players dominating specific segments. Major companies like ALPS, TE Connectivity, Nidec, C&K, Carling Technologies, Panasonic, Omron, APEM, Mitsumi Electric, ITW Switches, Honeywell, NKK Switches, CTS, OTTO, Coto Technology, E-Switch, Grayhill, ELMA, Electroswitch, and TOPLY are actively engaged in both organic growth and strategic acquisitions. Innovation is a crucial driver, fueled by the demand for miniaturization, increased durability, enhanced safety features, and specialized functionalities across diverse applications such as military, aerospace, healthcare, automotive, and white goods. Regulatory frameworks, particularly in sectors like healthcare and automotive, play a significant role in shaping product development and market entry strategies. The presence of viable product substitutes, such as solid-state relays and advanced electronic switches, necessitates continuous innovation to maintain market share. End-user trends are increasingly leaning towards smart and connected devices, pushing the demand for electromechanical switches that can integrate with IoT ecosystems. M&A activities are expected to continue as companies seek to expand their product portfolios, geographical reach, and technological capabilities. For instance, a significant M&A deal in the past year involved a value of approximately $500 million, signaling consolidation and strategic realignment within the industry. The market share of the top five players is estimated to be around 65% in the base year 2025.
Electromechanical On-Off Switches Industry Trends & Insights
The Electromechanical On-Off Switches industry is poised for steady growth, driven by several overarching trends and technological advancements. The Compound Annual Growth Rate (CAGR) for the forecast period is projected to be around 4.8%. Market penetration is deep across established industries, but new applications are continuously emerging, especially in the Internet of Things (IoT) and industrial automation sectors. Technological disruptions are shaping product design, with an increasing emphasis on high-performance, energy-efficient, and robust switch solutions. Consumer preferences are evolving, demanding more intuitive, reliable, and aesthetically pleasing interfaces, even for industrial and automotive applications. The competitive dynamics are characterized by intense R&D efforts, strategic partnerships, and a focus on cost optimization without compromising quality. The automotive sector, in particular, is a significant growth driver, with the increasing complexity of vehicle electronics and the rise of electric vehicles (EVs) demanding sophisticated switching solutions for battery management, powertrain control, and infotainment systems. Similarly, the healthcare industry's reliance on precise and sterile control mechanisms for medical devices contributes to sustained demand. The growing adoption of automation in manufacturing processes across various industries, including white goods and general industrial equipment, further fuels the need for reliable electromechanical switches. The increasing integration of smart functionalities into everyday appliances and industrial machinery is also a key trend, pushing manufacturers to develop switches that can seamlessly communicate with other electronic components and systems. Furthermore, the military and aerospace sectors continue to require highly durable and dependable switches that can withstand extreme environmental conditions, ensuring mission-critical operations. The global market size for electromechanical on-off switches is estimated to reach approximately $12,500 million by 2033.
Dominant Markets & Segments in Electromechanical On-Off Switches
The Automotive segment stands out as a dominant market for electromechanical on-off switches, driven by the ever-increasing complexity of vehicle electrical systems and the transformative shift towards electric and autonomous vehicles. The sheer volume of switches required for everything from engine management and lighting to infotainment and advanced driver-assistance systems (ADAS) makes this sector a primary consumer. Economic policies supporting automotive manufacturing and infrastructure development in key regions like Asia-Pacific and Europe further bolster this dominance. Within the automotive sector, the increasing adoption of electric vehicles is particularly significant, requiring specialized switches for battery management systems, charging infrastructure, and high-voltage power distribution.
- Key Drivers in Automotive:
- Electric Vehicle (EV) Adoption: Higher demand for battery management, charging, and power control switches.
- ADAS Integration: Need for sophisticated switches in complex sensor and control systems.
- Infotainment Systems: Growing features and controls requiring diverse switch types.
- Stringent Safety Regulations: Emphasis on reliable and fail-safe switching solutions.
- Lightweighting Initiatives: Demand for compact and durable switch designs.
In terms of Types, the Tactile Switch segment holds a significant market share due to its widespread application in consumer electronics, white goods, and automotive interiors, offering a distinct user feedback mechanism. However, Toggle Switches remain crucial in industrial and military applications requiring robust and easily operable controls.
- Dominance Analysis of Types:
- Tactile Switches: Ubiquitous in consumer electronics, remote controls, and user interfaces for appliances, providing essential click feedback. Market penetration is exceptionally high due to their versatility and cost-effectiveness.
- Toggle Switches: Essential for applications demanding clear visual indication of state and positive actuation, such as power switches on heavy machinery, laboratory equipment, and military communication devices. Their durability and reliability in harsh environments are key differentiators.
- Rotary Switches: Critical in applications requiring multiple positions or sequential selection, such as control panels in industrial settings, audio equipment, and test instruments.
- Encoder Switches: Gaining traction with the rise of digital interfaces and programmable controls, offering precise input for digital systems in applications like medical devices and advanced industrial controls.
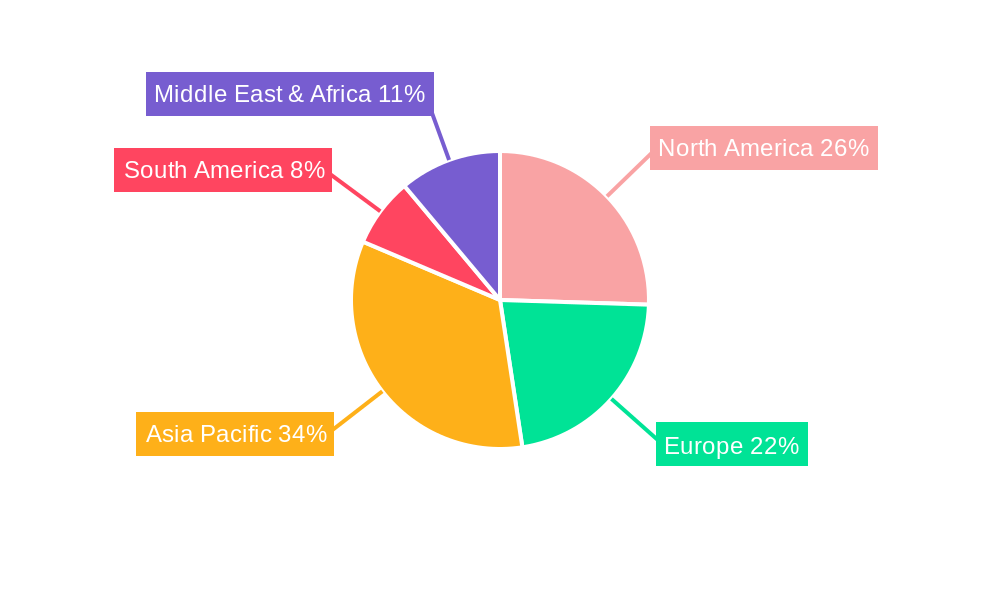
Geographically, Asia-Pacific is the leading region due to its status as a global manufacturing hub for electronics, automotive, and white goods. Countries like China, Japan, and South Korea are major consumers and producers of electromechanical on-off switches.
Electromechanical On-Off Switches Product Developments
Recent product developments in the electromechanical on-off switches market are characterized by a strong focus on enhanced reliability, miniaturization, and integration capabilities. Innovations include ultra-low profile tactile switches for space-constrained devices, high-temperature resistant toggle switches for automotive under-hood applications, and rotary encoder switches with increased resolution for precise digital control. Competitive advantages are being carved out through improved sealing technologies for harsh environments, longer operational life cycles exceeding tens of millions of actuations, and the integration of smart features like wireless connectivity or diagnostic feedback. The trend towards miniaturization is evident across all switch types, enabling the development of sleeker and more compact end products.
Report Scope & Segmentation Analysis
This report meticulously segments the Electromechanical On-Off Switches market across key Application areas, including:
- Military: High-reliability, ruggedized switches for defense systems. Projected market size of approximately $1,800 million by 2033, with a steady CAGR of 4.2%.
- Aerospace: Switches designed for extreme conditions and stringent safety standards. Projected market size of approximately $1,500 million by 2033, with a CAGR of 4.5%.
- Healthcare: Precision and sterile switches for medical devices. Projected market size of approximately $1,300 million by 2033, with a CAGR of 5.1%.
- Automotive: High-volume demand for various vehicle functions. Projected market size of approximately $4,500 million by 2033, with a CAGR of 5.5%.
- White Goods: Switches for appliances and home electronics. Projected market size of approximately $1,900 million by 2033, with a CAGR of 4.0%.
- Others: Encompassing industrial automation, consumer electronics, and more. Projected market size of approximately $1,500 million by 2033, with a CAGR of 4.8%.
And by Types:
- Tactile Switch: Projected market size of approximately $3,500 million by 2033.
- Rotary Switch: Projected market size of approximately $1,200 million by 2033.
- Encoder Switch: Projected market size of approximately $1,800 million by 2033.
- Toggle Switch: Projected market size of approximately $3,000 million by 2033.
- Other: Projected market size of approximately $3,000 million by 2033.
Key Drivers of Electromechanical On-Off Switches Growth
The growth of the electromechanical on-off switches market is propelled by several key factors. The pervasive trend of miniaturization in electronic devices demands smaller, more efficient switches. The increasing sophistication of electronic systems, particularly in automotive, healthcare, and industrial automation, necessitates a higher number of specialized and reliable switching solutions. Growing adoption of IoT and smart technologies is creating new use cases for switches in connected devices. Furthermore, stringent regulatory requirements for safety and reliability in sectors like aerospace and medical devices ensure sustained demand for high-quality electromechanical switches. The ongoing industrial automation revolution across manufacturing sectors also fuels demand for robust and durable control components.
Challenges in the Electromechanical On-Off Switches Sector
Despite robust growth, the electromechanical on-off switches sector faces several challenges. Intense price competition from manufacturers in low-cost regions can put pressure on profit margins. The increasing complexity of supply chains and potential disruptions, as witnessed in recent global events, pose a risk to production and delivery timelines. The emergence of advanced solid-state and electronic switching technologies presents a substitute threat in certain applications, requiring electromechanical switch manufacturers to continuously innovate. Stringent environmental regulations regarding materials and manufacturing processes can add to production costs and complexity. Lastly, the shortage of skilled labor in specialized manufacturing can hinder production scalability.
Emerging Opportunities in Electromechanical On-Off Switches
Emerging opportunities within the electromechanical on-off switches market are significant and diverse. The rapid expansion of the Internet of Things (IoT) ecosystem is creating a demand for switches in an array of smart home devices, industrial sensors, and wearable technology. The ongoing electrification of transportation, beyond just passenger vehicles, presents opportunities in charging infrastructure and specialized electric mobility solutions. Advancements in medical technology are driving the need for highly specialized, biocompatible, and robust switches for advanced diagnostic and therapeutic equipment. The demand for ruggedized and industrial-grade switches in harsh environments, including renewable energy installations and extreme climate control systems, is also on the rise.
Leading Players in the Electromechanical On-Off Switches Market
- ALPS
- TE Connectivity
- Nidec
- C&K
- Carling Technologies
- Panasonic
- Omron
- APEM
- Mitsumi Electric
- ITW Switches
- Honeywell
- NKK Switches
- CTS
- OTTO
- Coto Technology
- E-Switch
- Grayhill
- ELMA
- Electroswitch
- TOPLY
Key Developments in Electromechanical On-Off Switches Industry
- 2023/08: TE Connectivity launches a new series of ultra-miniature tact switches with enhanced durability for wearable devices.
- 2023/05: Nidec acquires a specialized switch manufacturer, expanding its portfolio in industrial automation components.
- 2022/11: C&K introduces a new line of sealed toggle switches with IP67 rating for harsh environment applications.
- 2022/07: Panasonic unveils a series of low-profile encoder switches for advanced user interfaces in automotive and consumer electronics.
- 2021/10: Omron develops innovative tactile switches with improved tactile feedback for enhanced user experience.
- 2021/04: Carling Technologies expands its range of high-power toggle switches for heavy-duty industrial equipment.
Strategic Outlook for Electromechanical On-Off Switches Market
The strategic outlook for the electromechanical on-off switches market is characterized by a sustained upward trajectory, fueled by continuous innovation and the expansion into emerging sectors. Manufacturers are advised to focus on developing highly reliable, compact, and intelligent switching solutions that cater to the evolving demands of the automotive, healthcare, and IoT industries. Strategic collaborations and acquisitions will be crucial for companies looking to enhance their technological capabilities and market reach. Investing in R&D for advanced materials and manufacturing processes will be key to maintaining a competitive edge. The growing emphasis on sustainability and energy efficiency will also present opportunities for the development of eco-friendly switch solutions.
Electromechanical On-Off Switches Segmentation
-
1. Application
- 1.1. Military
- 1.2. Aerospace
- 1.3. Healthcare
- 1.4. Automotive
- 1.5. White Goods
- 1.6. Others
-
2. Types
- 2.1. Tactile Switch
- 2.2. Rotary Switch
- 2.3. Encoder Switch
- 2.4. Toggle Switch
- 2.5. Other
Electromechanical On-Off Switches Segmentation By Geography
-
1. North America
- 1.1. United States
- 1.2. Canada
- 1.3. Mexico
-
2. South America
- 2.1. Brazil
- 2.2. Argentina
- 2.3. Rest of South America
-
3. Europe
- 3.1. United Kingdom
- 3.2. Germany
- 3.3. France
- 3.4. Italy
- 3.5. Spain
- 3.6. Russia
- 3.7. Benelux
- 3.8. Nordics
- 3.9. Rest of Europe
-
4. Middle East & Africa
- 4.1. Turkey
- 4.2. Israel
- 4.3. GCC
- 4.4. North Africa
- 4.5. South Africa
- 4.6. Rest of Middle East & Africa
-
5. Asia Pacific
- 5.1. China
- 5.2. India
- 5.3. Japan
- 5.4. South Korea
- 5.5. ASEAN
- 5.6. Oceania
- 5.7. Rest of Asia Pacific
Electromechanical On-Off Switches REPORT HIGHLIGHTS
| Aspects | Details |
|---|---|
| Study Period | 2019-2033 |
| Base Year | 2024 |
| Estimated Year | 2025 |
| Forecast Period | 2025-2033 |
| Historical Period | 2019-2024 |
| Growth Rate | CAGR of XX% from 2019-2033 |
| Segmentation |
|
Table of Contents
- 1. Introduction
- 1.1. Research Scope
- 1.2. Market Segmentation
- 1.3. Research Methodology
- 1.4. Definitions and Assumptions
- 2. Executive Summary
- 2.1. Introduction
- 3. Market Dynamics
- 3.1. Introduction
- 3.2. Market Drivers
- 3.3. Market Restrains
- 3.4. Market Trends
- 4. Market Factor Analysis
- 4.1. Porters Five Forces
- 4.2. Supply/Value Chain
- 4.3. PESTEL analysis
- 4.4. Market Entropy
- 4.5. Patent/Trademark Analysis
- 5. Global Electromechanical On-Off Switches Analysis, Insights and Forecast, 2019-2031
- 5.1. Market Analysis, Insights and Forecast - by Application
- 5.1.1. Military
- 5.1.2. Aerospace
- 5.1.3. Healthcare
- 5.1.4. Automotive
- 5.1.5. White Goods
- 5.1.6. Others
- 5.2. Market Analysis, Insights and Forecast - by Types
- 5.2.1. Tactile Switch
- 5.2.2. Rotary Switch
- 5.2.3. Encoder Switch
- 5.2.4. Toggle Switch
- 5.2.5. Other
- 5.3. Market Analysis, Insights and Forecast - by Region
- 5.3.1. North America
- 5.3.2. South America
- 5.3.3. Europe
- 5.3.4. Middle East & Africa
- 5.3.5. Asia Pacific
- 5.1. Market Analysis, Insights and Forecast - by Application
- 6. North America Electromechanical On-Off Switches Analysis, Insights and Forecast, 2019-2031
- 6.1. Market Analysis, Insights and Forecast - by Application
- 6.1.1. Military
- 6.1.2. Aerospace
- 6.1.3. Healthcare
- 6.1.4. Automotive
- 6.1.5. White Goods
- 6.1.6. Others
- 6.2. Market Analysis, Insights and Forecast - by Types
- 6.2.1. Tactile Switch
- 6.2.2. Rotary Switch
- 6.2.3. Encoder Switch
- 6.2.4. Toggle Switch
- 6.2.5. Other
- 6.1. Market Analysis, Insights and Forecast - by Application
- 7. South America Electromechanical On-Off Switches Analysis, Insights and Forecast, 2019-2031
- 7.1. Market Analysis, Insights and Forecast - by Application
- 7.1.1. Military
- 7.1.2. Aerospace
- 7.1.3. Healthcare
- 7.1.4. Automotive
- 7.1.5. White Goods
- 7.1.6. Others
- 7.2. Market Analysis, Insights and Forecast - by Types
- 7.2.1. Tactile Switch
- 7.2.2. Rotary Switch
- 7.2.3. Encoder Switch
- 7.2.4. Toggle Switch
- 7.2.5. Other
- 7.1. Market Analysis, Insights and Forecast - by Application
- 8. Europe Electromechanical On-Off Switches Analysis, Insights and Forecast, 2019-2031
- 8.1. Market Analysis, Insights and Forecast - by Application
- 8.1.1. Military
- 8.1.2. Aerospace
- 8.1.3. Healthcare
- 8.1.4. Automotive
- 8.1.5. White Goods
- 8.1.6. Others
- 8.2. Market Analysis, Insights and Forecast - by Types
- 8.2.1. Tactile Switch
- 8.2.2. Rotary Switch
- 8.2.3. Encoder Switch
- 8.2.4. Toggle Switch
- 8.2.5. Other
- 8.1. Market Analysis, Insights and Forecast - by Application
- 9. Middle East & Africa Electromechanical On-Off Switches Analysis, Insights and Forecast, 2019-2031
- 9.1. Market Analysis, Insights and Forecast - by Application
- 9.1.1. Military
- 9.1.2. Aerospace
- 9.1.3. Healthcare
- 9.1.4. Automotive
- 9.1.5. White Goods
- 9.1.6. Others
- 9.2. Market Analysis, Insights and Forecast - by Types
- 9.2.1. Tactile Switch
- 9.2.2. Rotary Switch
- 9.2.3. Encoder Switch
- 9.2.4. Toggle Switch
- 9.2.5. Other
- 9.1. Market Analysis, Insights and Forecast - by Application
- 10. Asia Pacific Electromechanical On-Off Switches Analysis, Insights and Forecast, 2019-2031
- 10.1. Market Analysis, Insights and Forecast - by Application
- 10.1.1. Military
- 10.1.2. Aerospace
- 10.1.3. Healthcare
- 10.1.4. Automotive
- 10.1.5. White Goods
- 10.1.6. Others
- 10.2. Market Analysis, Insights and Forecast - by Types
- 10.2.1. Tactile Switch
- 10.2.2. Rotary Switch
- 10.2.3. Encoder Switch
- 10.2.4. Toggle Switch
- 10.2.5. Other
- 10.1. Market Analysis, Insights and Forecast - by Application
- 11. Competitive Analysis
- 11.1. Global Market Share Analysis 2024
- 11.2. Company Profiles
- 11.2.1 ALPS
- 11.2.1.1. Overview
- 11.2.1.2. Products
- 11.2.1.3. SWOT Analysis
- 11.2.1.4. Recent Developments
- 11.2.1.5. Financials (Based on Availability)
- 11.2.2 TE Connectivity
- 11.2.2.1. Overview
- 11.2.2.2. Products
- 11.2.2.3. SWOT Analysis
- 11.2.2.4. Recent Developments
- 11.2.2.5. Financials (Based on Availability)
- 11.2.3 Nidec
- 11.2.3.1. Overview
- 11.2.3.2. Products
- 11.2.3.3. SWOT Analysis
- 11.2.3.4. Recent Developments
- 11.2.3.5. Financials (Based on Availability)
- 11.2.4 C&K
- 11.2.4.1. Overview
- 11.2.4.2. Products
- 11.2.4.3. SWOT Analysis
- 11.2.4.4. Recent Developments
- 11.2.4.5. Financials (Based on Availability)
- 11.2.5 Carling Technologies
- 11.2.5.1. Overview
- 11.2.5.2. Products
- 11.2.5.3. SWOT Analysis
- 11.2.5.4. Recent Developments
- 11.2.5.5. Financials (Based on Availability)
- 11.2.6 Panasonic
- 11.2.6.1. Overview
- 11.2.6.2. Products
- 11.2.6.3. SWOT Analysis
- 11.2.6.4. Recent Developments
- 11.2.6.5. Financials (Based on Availability)
- 11.2.7 Omron
- 11.2.7.1. Overview
- 11.2.7.2. Products
- 11.2.7.3. SWOT Analysis
- 11.2.7.4. Recent Developments
- 11.2.7.5. Financials (Based on Availability)
- 11.2.8 APEM
- 11.2.8.1. Overview
- 11.2.8.2. Products
- 11.2.8.3. SWOT Analysis
- 11.2.8.4. Recent Developments
- 11.2.8.5. Financials (Based on Availability)
- 11.2.9 Mitsumi Electric
- 11.2.9.1. Overview
- 11.2.9.2. Products
- 11.2.9.3. SWOT Analysis
- 11.2.9.4. Recent Developments
- 11.2.9.5. Financials (Based on Availability)
- 11.2.10 ITW Switches
- 11.2.10.1. Overview
- 11.2.10.2. Products
- 11.2.10.3. SWOT Analysis
- 11.2.10.4. Recent Developments
- 11.2.10.5. Financials (Based on Availability)
- 11.2.11 Honeywell
- 11.2.11.1. Overview
- 11.2.11.2. Products
- 11.2.11.3. SWOT Analysis
- 11.2.11.4. Recent Developments
- 11.2.11.5. Financials (Based on Availability)
- 11.2.12 NKK Switches
- 11.2.12.1. Overview
- 11.2.12.2. Products
- 11.2.12.3. SWOT Analysis
- 11.2.12.4. Recent Developments
- 11.2.12.5. Financials (Based on Availability)
- 11.2.13 CTS
- 11.2.13.1. Overview
- 11.2.13.2. Products
- 11.2.13.3. SWOT Analysis
- 11.2.13.4. Recent Developments
- 11.2.13.5. Financials (Based on Availability)
- 11.2.14 OTTO
- 11.2.14.1. Overview
- 11.2.14.2. Products
- 11.2.14.3. SWOT Analysis
- 11.2.14.4. Recent Developments
- 11.2.14.5. Financials (Based on Availability)
- 11.2.15 Coto Technology
- 11.2.15.1. Overview
- 11.2.15.2. Products
- 11.2.15.3. SWOT Analysis
- 11.2.15.4. Recent Developments
- 11.2.15.5. Financials (Based on Availability)
- 11.2.16 E-Switch
- 11.2.16.1. Overview
- 11.2.16.2. Products
- 11.2.16.3. SWOT Analysis
- 11.2.16.4. Recent Developments
- 11.2.16.5. Financials (Based on Availability)
- 11.2.17 Grayhill
- 11.2.17.1. Overview
- 11.2.17.2. Products
- 11.2.17.3. SWOT Analysis
- 11.2.17.4. Recent Developments
- 11.2.17.5. Financials (Based on Availability)
- 11.2.18 ELMA
- 11.2.18.1. Overview
- 11.2.18.2. Products
- 11.2.18.3. SWOT Analysis
- 11.2.18.4. Recent Developments
- 11.2.18.5. Financials (Based on Availability)
- 11.2.19 Electroswitch
- 11.2.19.1. Overview
- 11.2.19.2. Products
- 11.2.19.3. SWOT Analysis
- 11.2.19.4. Recent Developments
- 11.2.19.5. Financials (Based on Availability)
- 11.2.20 TOPLY
- 11.2.20.1. Overview
- 11.2.20.2. Products
- 11.2.20.3. SWOT Analysis
- 11.2.20.4. Recent Developments
- 11.2.20.5. Financials (Based on Availability)
- 11.2.1 ALPS
List of Figures
- Figure 1: Global Electromechanical On-Off Switches Revenue Breakdown (million, %) by Region 2024 & 2032
- Figure 2: Global Electromechanical On-Off Switches Volume Breakdown (K, %) by Region 2024 & 2032
- Figure 3: North America Electromechanical On-Off Switches Revenue (million), by Application 2024 & 2032
- Figure 4: North America Electromechanical On-Off Switches Volume (K), by Application 2024 & 2032
- Figure 5: North America Electromechanical On-Off Switches Revenue Share (%), by Application 2024 & 2032
- Figure 6: North America Electromechanical On-Off Switches Volume Share (%), by Application 2024 & 2032
- Figure 7: North America Electromechanical On-Off Switches Revenue (million), by Types 2024 & 2032
- Figure 8: North America Electromechanical On-Off Switches Volume (K), by Types 2024 & 2032
- Figure 9: North America Electromechanical On-Off Switches Revenue Share (%), by Types 2024 & 2032
- Figure 10: North America Electromechanical On-Off Switches Volume Share (%), by Types 2024 & 2032
- Figure 11: North America Electromechanical On-Off Switches Revenue (million), by Country 2024 & 2032
- Figure 12: North America Electromechanical On-Off Switches Volume (K), by Country 2024 & 2032
- Figure 13: North America Electromechanical On-Off Switches Revenue Share (%), by Country 2024 & 2032
- Figure 14: North America Electromechanical On-Off Switches Volume Share (%), by Country 2024 & 2032
- Figure 15: South America Electromechanical On-Off Switches Revenue (million), by Application 2024 & 2032
- Figure 16: South America Electromechanical On-Off Switches Volume (K), by Application 2024 & 2032
- Figure 17: South America Electromechanical On-Off Switches Revenue Share (%), by Application 2024 & 2032
- Figure 18: South America Electromechanical On-Off Switches Volume Share (%), by Application 2024 & 2032
- Figure 19: South America Electromechanical On-Off Switches Revenue (million), by Types 2024 & 2032
- Figure 20: South America Electromechanical On-Off Switches Volume (K), by Types 2024 & 2032
- Figure 21: South America Electromechanical On-Off Switches Revenue Share (%), by Types 2024 & 2032
- Figure 22: South America Electromechanical On-Off Switches Volume Share (%), by Types 2024 & 2032
- Figure 23: South America Electromechanical On-Off Switches Revenue (million), by Country 2024 & 2032
- Figure 24: South America Electromechanical On-Off Switches Volume (K), by Country 2024 & 2032
- Figure 25: South America Electromechanical On-Off Switches Revenue Share (%), by Country 2024 & 2032
- Figure 26: South America Electromechanical On-Off Switches Volume Share (%), by Country 2024 & 2032
- Figure 27: Europe Electromechanical On-Off Switches Revenue (million), by Application 2024 & 2032
- Figure 28: Europe Electromechanical On-Off Switches Volume (K), by Application 2024 & 2032
- Figure 29: Europe Electromechanical On-Off Switches Revenue Share (%), by Application 2024 & 2032
- Figure 30: Europe Electromechanical On-Off Switches Volume Share (%), by Application 2024 & 2032
- Figure 31: Europe Electromechanical On-Off Switches Revenue (million), by Types 2024 & 2032
- Figure 32: Europe Electromechanical On-Off Switches Volume (K), by Types 2024 & 2032
- Figure 33: Europe Electromechanical On-Off Switches Revenue Share (%), by Types 2024 & 2032
- Figure 34: Europe Electromechanical On-Off Switches Volume Share (%), by Types 2024 & 2032
- Figure 35: Europe Electromechanical On-Off Switches Revenue (million), by Country 2024 & 2032
- Figure 36: Europe Electromechanical On-Off Switches Volume (K), by Country 2024 & 2032
- Figure 37: Europe Electromechanical On-Off Switches Revenue Share (%), by Country 2024 & 2032
- Figure 38: Europe Electromechanical On-Off Switches Volume Share (%), by Country 2024 & 2032
- Figure 39: Middle East & Africa Electromechanical On-Off Switches Revenue (million), by Application 2024 & 2032
- Figure 40: Middle East & Africa Electromechanical On-Off Switches Volume (K), by Application 2024 & 2032
- Figure 41: Middle East & Africa Electromechanical On-Off Switches Revenue Share (%), by Application 2024 & 2032
- Figure 42: Middle East & Africa Electromechanical On-Off Switches Volume Share (%), by Application 2024 & 2032
- Figure 43: Middle East & Africa Electromechanical On-Off Switches Revenue (million), by Types 2024 & 2032
- Figure 44: Middle East & Africa Electromechanical On-Off Switches Volume (K), by Types 2024 & 2032
- Figure 45: Middle East & Africa Electromechanical On-Off Switches Revenue Share (%), by Types 2024 & 2032
- Figure 46: Middle East & Africa Electromechanical On-Off Switches Volume Share (%), by Types 2024 & 2032
- Figure 47: Middle East & Africa Electromechanical On-Off Switches Revenue (million), by Country 2024 & 2032
- Figure 48: Middle East & Africa Electromechanical On-Off Switches Volume (K), by Country 2024 & 2032
- Figure 49: Middle East & Africa Electromechanical On-Off Switches Revenue Share (%), by Country 2024 & 2032
- Figure 50: Middle East & Africa Electromechanical On-Off Switches Volume Share (%), by Country 2024 & 2032
- Figure 51: Asia Pacific Electromechanical On-Off Switches Revenue (million), by Application 2024 & 2032
- Figure 52: Asia Pacific Electromechanical On-Off Switches Volume (K), by Application 2024 & 2032
- Figure 53: Asia Pacific Electromechanical On-Off Switches Revenue Share (%), by Application 2024 & 2032
- Figure 54: Asia Pacific Electromechanical On-Off Switches Volume Share (%), by Application 2024 & 2032
- Figure 55: Asia Pacific Electromechanical On-Off Switches Revenue (million), by Types 2024 & 2032
- Figure 56: Asia Pacific Electromechanical On-Off Switches Volume (K), by Types 2024 & 2032
- Figure 57: Asia Pacific Electromechanical On-Off Switches Revenue Share (%), by Types 2024 & 2032
- Figure 58: Asia Pacific Electromechanical On-Off Switches Volume Share (%), by Types 2024 & 2032
- Figure 59: Asia Pacific Electromechanical On-Off Switches Revenue (million), by Country 2024 & 2032
- Figure 60: Asia Pacific Electromechanical On-Off Switches Volume (K), by Country 2024 & 2032
- Figure 61: Asia Pacific Electromechanical On-Off Switches Revenue Share (%), by Country 2024 & 2032
- Figure 62: Asia Pacific Electromechanical On-Off Switches Volume Share (%), by Country 2024 & 2032
List of Tables
- Table 1: Global Electromechanical On-Off Switches Revenue million Forecast, by Region 2019 & 2032
- Table 2: Global Electromechanical On-Off Switches Volume K Forecast, by Region 2019 & 2032
- Table 3: Global Electromechanical On-Off Switches Revenue million Forecast, by Application 2019 & 2032
- Table 4: Global Electromechanical On-Off Switches Volume K Forecast, by Application 2019 & 2032
- Table 5: Global Electromechanical On-Off Switches Revenue million Forecast, by Types 2019 & 2032
- Table 6: Global Electromechanical On-Off Switches Volume K Forecast, by Types 2019 & 2032
- Table 7: Global Electromechanical On-Off Switches Revenue million Forecast, by Region 2019 & 2032
- Table 8: Global Electromechanical On-Off Switches Volume K Forecast, by Region 2019 & 2032
- Table 9: Global Electromechanical On-Off Switches Revenue million Forecast, by Application 2019 & 2032
- Table 10: Global Electromechanical On-Off Switches Volume K Forecast, by Application 2019 & 2032
- Table 11: Global Electromechanical On-Off Switches Revenue million Forecast, by Types 2019 & 2032
- Table 12: Global Electromechanical On-Off Switches Volume K Forecast, by Types 2019 & 2032
- Table 13: Global Electromechanical On-Off Switches Revenue million Forecast, by Country 2019 & 2032
- Table 14: Global Electromechanical On-Off Switches Volume K Forecast, by Country 2019 & 2032
- Table 15: United States Electromechanical On-Off Switches Revenue (million) Forecast, by Application 2019 & 2032
- Table 16: United States Electromechanical On-Off Switches Volume (K) Forecast, by Application 2019 & 2032
- Table 17: Canada Electromechanical On-Off Switches Revenue (million) Forecast, by Application 2019 & 2032
- Table 18: Canada Electromechanical On-Off Switches Volume (K) Forecast, by Application 2019 & 2032
- Table 19: Mexico Electromechanical On-Off Switches Revenue (million) Forecast, by Application 2019 & 2032
- Table 20: Mexico Electromechanical On-Off Switches Volume (K) Forecast, by Application 2019 & 2032
- Table 21: Global Electromechanical On-Off Switches Revenue million Forecast, by Application 2019 & 2032
- Table 22: Global Electromechanical On-Off Switches Volume K Forecast, by Application 2019 & 2032
- Table 23: Global Electromechanical On-Off Switches Revenue million Forecast, by Types 2019 & 2032
- Table 24: Global Electromechanical On-Off Switches Volume K Forecast, by Types 2019 & 2032
- Table 25: Global Electromechanical On-Off Switches Revenue million Forecast, by Country 2019 & 2032
- Table 26: Global Electromechanical On-Off Switches Volume K Forecast, by Country 2019 & 2032
- Table 27: Brazil Electromechanical On-Off Switches Revenue (million) Forecast, by Application 2019 & 2032
- Table 28: Brazil Electromechanical On-Off Switches Volume (K) Forecast, by Application 2019 & 2032
- Table 29: Argentina Electromechanical On-Off Switches Revenue (million) Forecast, by Application 2019 & 2032
- Table 30: Argentina Electromechanical On-Off Switches Volume (K) Forecast, by Application 2019 & 2032
- Table 31: Rest of South America Electromechanical On-Off Switches Revenue (million) Forecast, by Application 2019 & 2032
- Table 32: Rest of South America Electromechanical On-Off Switches Volume (K) Forecast, by Application 2019 & 2032
- Table 33: Global Electromechanical On-Off Switches Revenue million Forecast, by Application 2019 & 2032
- Table 34: Global Electromechanical On-Off Switches Volume K Forecast, by Application 2019 & 2032
- Table 35: Global Electromechanical On-Off Switches Revenue million Forecast, by Types 2019 & 2032
- Table 36: Global Electromechanical On-Off Switches Volume K Forecast, by Types 2019 & 2032
- Table 37: Global Electromechanical On-Off Switches Revenue million Forecast, by Country 2019 & 2032
- Table 38: Global Electromechanical On-Off Switches Volume K Forecast, by Country 2019 & 2032
- Table 39: United Kingdom Electromechanical On-Off Switches Revenue (million) Forecast, by Application 2019 & 2032
- Table 40: United Kingdom Electromechanical On-Off Switches Volume (K) Forecast, by Application 2019 & 2032
- Table 41: Germany Electromechanical On-Off Switches Revenue (million) Forecast, by Application 2019 & 2032
- Table 42: Germany Electromechanical On-Off Switches Volume (K) Forecast, by Application 2019 & 2032
- Table 43: France Electromechanical On-Off Switches Revenue (million) Forecast, by Application 2019 & 2032
- Table 44: France Electromechanical On-Off Switches Volume (K) Forecast, by Application 2019 & 2032
- Table 45: Italy Electromechanical On-Off Switches Revenue (million) Forecast, by Application 2019 & 2032
- Table 46: Italy Electromechanical On-Off Switches Volume (K) Forecast, by Application 2019 & 2032
- Table 47: Spain Electromechanical On-Off Switches Revenue (million) Forecast, by Application 2019 & 2032
- Table 48: Spain Electromechanical On-Off Switches Volume (K) Forecast, by Application 2019 & 2032
- Table 49: Russia Electromechanical On-Off Switches Revenue (million) Forecast, by Application 2019 & 2032
- Table 50: Russia Electromechanical On-Off Switches Volume (K) Forecast, by Application 2019 & 2032
- Table 51: Benelux Electromechanical On-Off Switches Revenue (million) Forecast, by Application 2019 & 2032
- Table 52: Benelux Electromechanical On-Off Switches Volume (K) Forecast, by Application 2019 & 2032
- Table 53: Nordics Electromechanical On-Off Switches Revenue (million) Forecast, by Application 2019 & 2032
- Table 54: Nordics Electromechanical On-Off Switches Volume (K) Forecast, by Application 2019 & 2032
- Table 55: Rest of Europe Electromechanical On-Off Switches Revenue (million) Forecast, by Application 2019 & 2032
- Table 56: Rest of Europe Electromechanical On-Off Switches Volume (K) Forecast, by Application 2019 & 2032
- Table 57: Global Electromechanical On-Off Switches Revenue million Forecast, by Application 2019 & 2032
- Table 58: Global Electromechanical On-Off Switches Volume K Forecast, by Application 2019 & 2032
- Table 59: Global Electromechanical On-Off Switches Revenue million Forecast, by Types 2019 & 2032
- Table 60: Global Electromechanical On-Off Switches Volume K Forecast, by Types 2019 & 2032
- Table 61: Global Electromechanical On-Off Switches Revenue million Forecast, by Country 2019 & 2032
- Table 62: Global Electromechanical On-Off Switches Volume K Forecast, by Country 2019 & 2032
- Table 63: Turkey Electromechanical On-Off Switches Revenue (million) Forecast, by Application 2019 & 2032
- Table 64: Turkey Electromechanical On-Off Switches Volume (K) Forecast, by Application 2019 & 2032
- Table 65: Israel Electromechanical On-Off Switches Revenue (million) Forecast, by Application 2019 & 2032
- Table 66: Israel Electromechanical On-Off Switches Volume (K) Forecast, by Application 2019 & 2032
- Table 67: GCC Electromechanical On-Off Switches Revenue (million) Forecast, by Application 2019 & 2032
- Table 68: GCC Electromechanical On-Off Switches Volume (K) Forecast, by Application 2019 & 2032
- Table 69: North Africa Electromechanical On-Off Switches Revenue (million) Forecast, by Application 2019 & 2032
- Table 70: North Africa Electromechanical On-Off Switches Volume (K) Forecast, by Application 2019 & 2032
- Table 71: South Africa Electromechanical On-Off Switches Revenue (million) Forecast, by Application 2019 & 2032
- Table 72: South Africa Electromechanical On-Off Switches Volume (K) Forecast, by Application 2019 & 2032
- Table 73: Rest of Middle East & Africa Electromechanical On-Off Switches Revenue (million) Forecast, by Application 2019 & 2032
- Table 74: Rest of Middle East & Africa Electromechanical On-Off Switches Volume (K) Forecast, by Application 2019 & 2032
- Table 75: Global Electromechanical On-Off Switches Revenue million Forecast, by Application 2019 & 2032
- Table 76: Global Electromechanical On-Off Switches Volume K Forecast, by Application 2019 & 2032
- Table 77: Global Electromechanical On-Off Switches Revenue million Forecast, by Types 2019 & 2032
- Table 78: Global Electromechanical On-Off Switches Volume K Forecast, by Types 2019 & 2032
- Table 79: Global Electromechanical On-Off Switches Revenue million Forecast, by Country 2019 & 2032
- Table 80: Global Electromechanical On-Off Switches Volume K Forecast, by Country 2019 & 2032
- Table 81: China Electromechanical On-Off Switches Revenue (million) Forecast, by Application 2019 & 2032
- Table 82: China Electromechanical On-Off Switches Volume (K) Forecast, by Application 2019 & 2032
- Table 83: India Electromechanical On-Off Switches Revenue (million) Forecast, by Application 2019 & 2032
- Table 84: India Electromechanical On-Off Switches Volume (K) Forecast, by Application 2019 & 2032
- Table 85: Japan Electromechanical On-Off Switches Revenue (million) Forecast, by Application 2019 & 2032
- Table 86: Japan Electromechanical On-Off Switches Volume (K) Forecast, by Application 2019 & 2032
- Table 87: South Korea Electromechanical On-Off Switches Revenue (million) Forecast, by Application 2019 & 2032
- Table 88: South Korea Electromechanical On-Off Switches Volume (K) Forecast, by Application 2019 & 2032
- Table 89: ASEAN Electromechanical On-Off Switches Revenue (million) Forecast, by Application 2019 & 2032
- Table 90: ASEAN Electromechanical On-Off Switches Volume (K) Forecast, by Application 2019 & 2032
- Table 91: Oceania Electromechanical On-Off Switches Revenue (million) Forecast, by Application 2019 & 2032
- Table 92: Oceania Electromechanical On-Off Switches Volume (K) Forecast, by Application 2019 & 2032
- Table 93: Rest of Asia Pacific Electromechanical On-Off Switches Revenue (million) Forecast, by Application 2019 & 2032
- Table 94: Rest of Asia Pacific Electromechanical On-Off Switches Volume (K) Forecast, by Application 2019 & 2032
Frequently Asked Questions
1. What is the projected Compound Annual Growth Rate (CAGR) of the Electromechanical On-Off Switches?
The projected CAGR is approximately XX%.
2. Which companies are prominent players in the Electromechanical On-Off Switches?
Key companies in the market include ALPS, TE Connectivity, Nidec, C&K, Carling Technologies, Panasonic, Omron, APEM, Mitsumi Electric, ITW Switches, Honeywell, NKK Switches, CTS, OTTO, Coto Technology, E-Switch, Grayhill, ELMA, Electroswitch, TOPLY.
3. What are the main segments of the Electromechanical On-Off Switches?
The market segments include Application, Types.
4. Can you provide details about the market size?
The market size is estimated to be USD XXX million as of 2022.
5. What are some drivers contributing to market growth?
N/A
6. What are the notable trends driving market growth?
N/A
7. Are there any restraints impacting market growth?
N/A
8. Can you provide examples of recent developments in the market?
N/A
9. What pricing options are available for accessing the report?
Pricing options include single-user, multi-user, and enterprise licenses priced at USD 3950.00, USD 5925.00, and USD 7900.00 respectively.
10. Is the market size provided in terms of value or volume?
The market size is provided in terms of value, measured in million and volume, measured in K.
11. Are there any specific market keywords associated with the report?
Yes, the market keyword associated with the report is "Electromechanical On-Off Switches," which aids in identifying and referencing the specific market segment covered.
12. How do I determine which pricing option suits my needs best?
The pricing options vary based on user requirements and access needs. Individual users may opt for single-user licenses, while businesses requiring broader access may choose multi-user or enterprise licenses for cost-effective access to the report.
13. Are there any additional resources or data provided in the Electromechanical On-Off Switches report?
While the report offers comprehensive insights, it's advisable to review the specific contents or supplementary materials provided to ascertain if additional resources or data are available.
14. How can I stay updated on further developments or reports in the Electromechanical On-Off Switches?
To stay informed about further developments, trends, and reports in the Electromechanical On-Off Switches, consider subscribing to industry newsletters, following relevant companies and organizations, or regularly checking reputable industry news sources and publications.
Methodology
Step 1 - Identification of Relevant Samples Size from Population Database


Step 2 - Approaches for Defining Global Market Size (Value, Volume* & Price*)

Note*: In applicable scenarios
Step 3 - Data Sources
Primary Research
- Web Analytics
- Survey Reports
- Research Institute
- Latest Research Reports
- Opinion Leaders
Secondary Research
- Annual Reports
- White Paper
- Latest Press Release
- Industry Association
- Paid Database
- Investor Presentations

Step 4 - Data Triangulation
Involves using different sources of information in order to increase the validity of a study
These sources are likely to be stakeholders in a program - participants, other researchers, program staff, other community members, and so on.
Then we put all data in single framework & apply various statistical tools to find out the dynamic on the market.
During the analysis stage, feedback from the stakeholder groups would be compared to determine areas of agreement as well as areas of divergence


