

Key Insights
The global Electronic Intelligent Mask market is poised for significant expansion, projected to reach $7.5 billion by 2025. This robust growth is fueled by an anticipated Compound Annual Growth Rate (CAGR) of 7.8% throughout the forecast period, indicating a dynamic and evolving industry. The increasing global awareness of air quality issues, coupled with rising concerns about respiratory health, particularly in urban and industrially developed regions, serves as a primary driver for this market's ascent. Technological advancements in wearable electronics, integrated sensors for real-time air quality monitoring, and smart filtration systems are further enhancing the appeal and functionality of these intelligent masks, making them a sought-after personal health and safety solution. The adoption of these advanced masks is being accelerated by a growing consumer preference for preventative health measures and a desire for personalized air purification solutions.
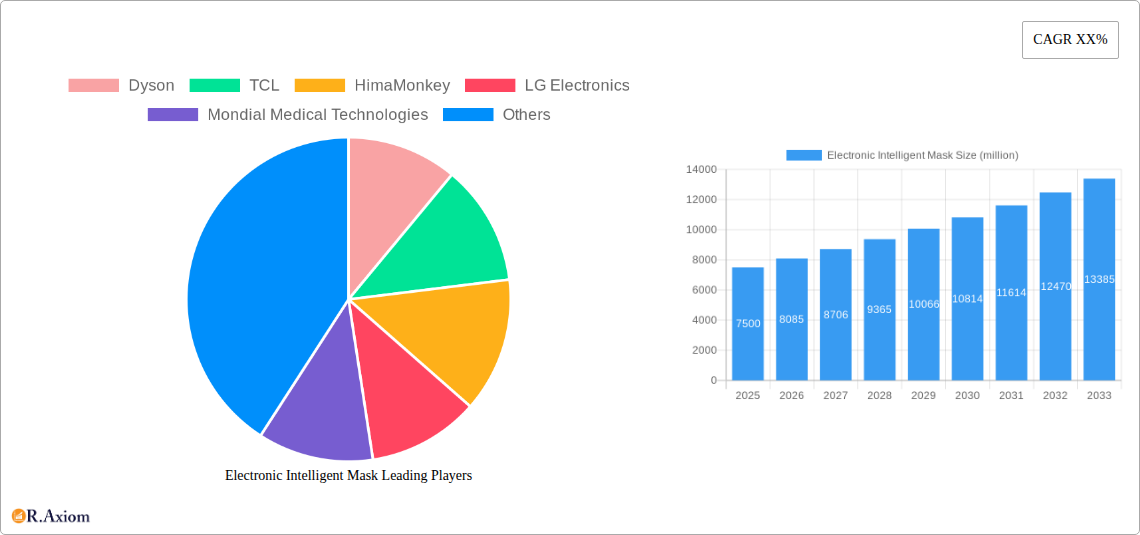
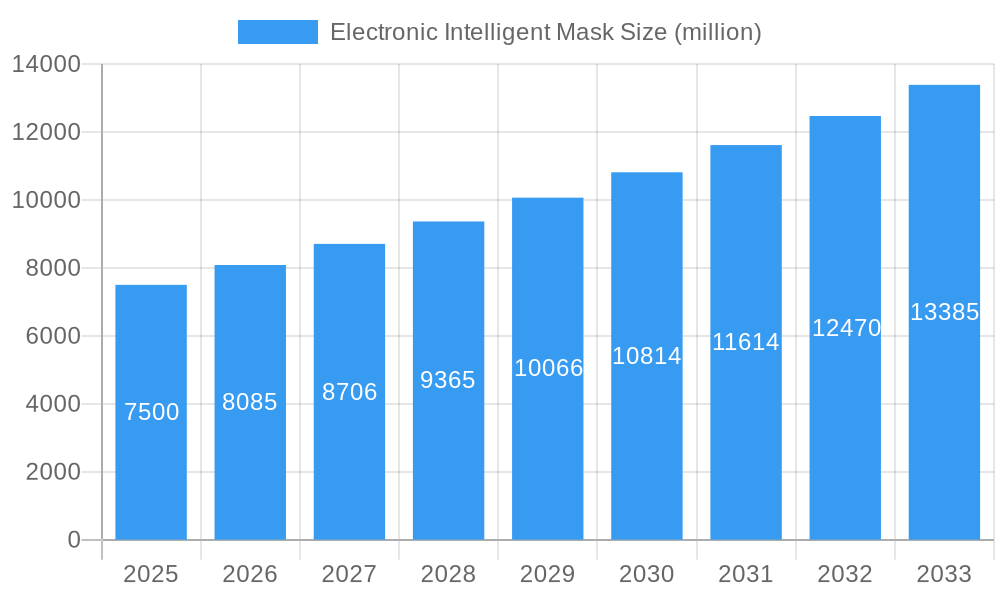
Electronic Intelligent Mask Market Size (In Billion)
The market is segmented across various applications, with "Health Care" and "Air Filter" emerging as dominant segments due to their direct relevance to air quality management and personal protection. The "Hang Ear Type" and "Hang Neck Type" configurations cater to diverse user preferences and comfort levels, broadening the market's reach. Leading players like Dyson, TCL, and LG Electronics are actively innovating, introducing sophisticated features that integrate smart connectivity and advanced filtration technologies, thereby shaping market trends and consumer expectations. While the market demonstrates strong growth potential, challenges such as the relatively high cost of these advanced devices and consumer education regarding their benefits may present some restraints. However, the overwhelming demand for enhanced respiratory protection against pollutants and pathogens is expected to significantly outweigh these limitations.
Electronic Intelligent Mask Company Market Share
Electronic Intelligent Mask Market Concentration & Innovation
The Electronic Intelligent Mask market is experiencing a dynamic shift, moving from a nascent stage to a more concentrated landscape driven by significant innovation and increasing adoption across various applications. While still evolving, key players such as Dyson, LG Electronics, and TCL are investing heavily in research and development, pushing the boundaries of smart mask technology. The market concentration is moderate, with a few dominant players and a growing number of specialized manufacturers. Innovation drivers are primarily centered around enhanced air filtration capabilities, real-time environmental monitoring, and user comfort. Regulatory frameworks are also beginning to mature, providing clearer guidelines for product safety and efficacy, especially in the Health Care and Haze Isolation segments. Product substitutes, while present in traditional masks, offer limited functionality compared to intelligent masks. End-user trends indicate a growing demand for personal health and safety solutions, particularly in urban environments and during periods of heightened environmental concern. Mergers and acquisitions (M&A) are becoming more prevalent as larger companies seek to acquire innovative technologies and expand their market reach. For instance, M&A deal values are projected to reach XX billion within the forecast period, with estimated market share shifts for leading companies like HimaMonkey and Mondial Medical Technologies. The focus on miniaturization, battery life, and seamless connectivity further fuels this innovation trajectory.
Electronic Intelligent Mask Industry Trends & Insights
The Electronic Intelligent Mask industry is poised for exponential growth, driven by a confluence of technological advancements, evolving consumer consciousness, and escalating environmental concerns. The projected Compound Annual Growth Rate (CAGR) for the Electronic Intelligent Mask Market is a robust XX% from 2025 to 2033, with the base year of 2025 already showcasing significant market penetration of XX%. Technological disruptions are at the forefront, with advancements in sensor technology enabling real-time monitoring of air quality parameters such as PM2.5, VOCs, and CO2 levels, making these masks more than just filters but intelligent personal environmental guardians. The integration of AI and IoT capabilities allows for personalized alerts, data analytics, and adaptive filtration based on individual needs and ambient conditions. Consumer preferences are increasingly shifting towards proactive health management and environmental protection. The rising incidence of respiratory ailments, coupled with increased awareness of pollution's detrimental effects, is a significant catalyst for adoption. This trend is particularly pronounced in densely populated urban centers and regions prone to haze. Competitive dynamics are intensifying, with established consumer electronics giants like Dyson and LG Electronics, alongside specialized innovators such as HimaMonkey, Guts Air, and Ao Air, vying for market leadership. The development of lighter, more comfortable, and aesthetically pleasing designs, alongside enhanced battery efficiency, is crucial for broader market penetration. The Air Filter segment, in particular, is seeing substantial innovation, offering advanced filtration mechanisms that surpass traditional mask capabilities. The Health Care application is also a major growth engine, with intelligent masks being explored for post-operative care, managing chronic respiratory conditions, and protecting vulnerable populations. The market penetration for intelligent masks is expected to reach XX% by 2033, a testament to their growing utility and appeal.
Dominant Markets & Segments in Electronic Intelligent Mask
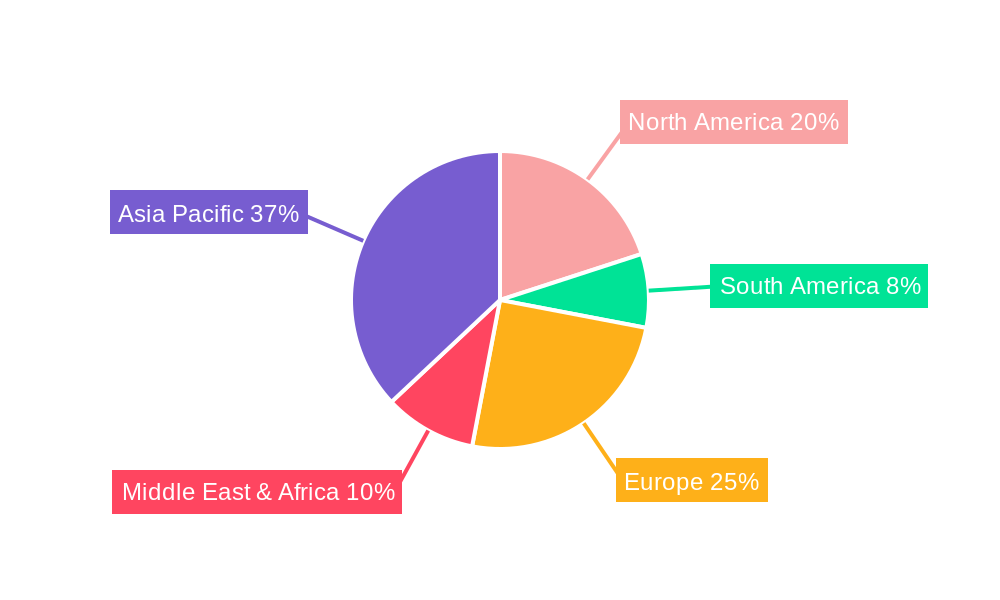
The Electronic Intelligent Mask Market showcases distinct regional dominance and segment leadership, driven by a combination of economic policies, infrastructure development, and specific consumer needs. Geographically, Asia Pacific is emerging as the dominant region, primarily due to high population density, increasing urbanization, and severe air pollution challenges in countries like China and India. Government initiatives promoting public health and environmental protection further bolster market growth. In terms of application, Haze Isolation stands out as a primary driver of demand. The recurring smog events in many Asian cities necessitate effective and intelligent solutions for personal protection, making these masks indispensable for daily life. Economic policies in these regions often include incentives for clean technology adoption, indirectly benefiting the intelligent mask market.
- Asia Pacific Dominance:
- Key Drivers: High population density, severe air pollution, government initiatives for public health, growing disposable incomes.
- Economic Policies: Subsidies for pollution control technologies, stricter environmental regulations, and investment in smart city infrastructure.
- Infrastructure: Rapid urbanization and development of smart infrastructure that supports IoT-enabled devices.
- Haze Isolation Application:
- Market Size: Projected to account for XX% of the total market revenue by 2033.
- Consumer Demand: Driven by immediate need for protection against particulate matter, allergens, and other airborne pollutants.
- Competitive Landscape: Intense competition among manufacturers offering varying levels of filtration and smart features tailored for haze conditions.
- Health Care Application:
- Growth Potential: Significant untapped potential, driven by an aging population and increasing prevalence of respiratory diseases.
- Technological Integration: Focus on medical-grade filtration, real-time health monitoring (e.g., oxygen saturation, breathing patterns), and integration with telemedicine platforms.
- Regulatory Support: Growing recognition by healthcare authorities for its role in patient care and public health initiatives.
- Hang Ear Type Dominance:
- Market Share: Expected to capture XX% of the market by 2033 due to its familiarity and ease of use.
- User Convenience: Offers a comfortable and secure fit for everyday wear, aligning with existing mask usage habits.
- Design Innovation: Continued refinement in ergonomic design and material science to enhance user experience.
The Air Filter segment is also experiencing robust growth, driven by the increasing demand for advanced filtration technologies that can effectively capture microscopic pollutants. Companies like Dyson are leveraging their expertise in air purification to introduce sophisticated filtration systems within their intelligent masks. The Hang Ear Type remains the dominant form factor, appealing to a broader consumer base due to its familiarity and ease of wear, although Hang Neck Type designs are gaining traction for their ergonomic advantages and integration with wearable technology.
Electronic Intelligent Mask Product Developments
Recent product developments in the Electronic Intelligent Mask sector highlight a relentless pursuit of enhanced functionality and user experience. Innovations are focusing on integrating advanced sensor arrays for real-time air quality monitoring, including particulate matter, volatile organic compounds, and CO2 levels. Smart features such as personalized alerts, adaptive filtration based on environmental data, and seamless connectivity via Bluetooth to mobile applications are becoming standard. Manufacturers like AirBliss and AIR⁺ are pushing the envelope with lightweight, ergonomic designs, long-lasting battery life, and improved breathability without compromising filtration efficiency. Competitive advantages are being built on superior filter technology, intuitive user interfaces, and stylish aesthetics, catering to a diverse consumer base concerned with health and environmental well-being.
Report Scope & Segmentation Analysis
This report meticulously analyzes the Electronic Intelligent Mask market across key segmentation parameters to provide granular insights into market dynamics and growth trajectories.
- Application Segmentation: The market is segmented into Health Care, Air Filter, Haze Isolation, and Others. The Haze Isolation segment is projected to exhibit the highest growth rate due to persistent environmental challenges in many regions. The Health Care segment, while smaller currently, holds substantial long-term potential, driven by advancements in medical-grade filtration and monitoring capabilities.
- Type Segmentation: The analysis further categorizes the market by product type, including Hang Ear Type and Hang Neck Type. The Hang Ear Type currently dominates the market due to its widespread acceptance and user familiarity. However, the Hang Neck Type is gaining traction, offering enhanced comfort and integration possibilities for additional features.
Key Drivers of Electronic Intelligent Mask Growth
The growth of the Electronic Intelligent Mask market is propelled by a multifaceted array of drivers, ranging from technological advancements to evolving societal needs.
- Technological Advancements: The continuous innovation in sensor technology, miniaturization of components, and advancements in battery efficiency are critical. Development of AI-powered adaptive filtration systems that respond to real-time environmental data and individual physiological needs are further fueling adoption. The integration of IoT for seamless data tracking and connectivity enhances user experience and personal health management.
- Environmental Concerns and Health Awareness: Rising global awareness of air pollution's detrimental health impacts, coupled with an increasing incidence of respiratory illnesses and allergies, is a significant market driver. Consumers are actively seeking advanced solutions for personal protection, especially in urban and industrial settings.
- Government Initiatives and Regulations: Growing government focus on public health, environmental protection, and the promotion of smart city initiatives is creating a supportive ecosystem. Stricter regulations on air quality standards and incentives for adopting advanced protective gear are also contributing to market expansion.
Challenges in the Electronic Intelligent Mask Sector
Despite the promising growth, the Electronic Intelligent Mask sector faces several significant challenges that could impede its widespread adoption and market expansion.
- High Cost of Production and Retail Price: The advanced technology and complex manufacturing processes involved in producing intelligent masks result in a higher retail price compared to traditional masks. This cost barrier can limit affordability for a significant segment of the population, particularly in developing economies.
- Consumer Adoption and Education: While awareness is growing, widespread consumer adoption requires significant education on the benefits and functionalities of intelligent masks. Overcoming skepticism regarding the necessity and efficacy of these advanced devices is crucial.
- Battery Life and Recharging Infrastructure: The reliance on battery power for intelligent functions necessitates frequent recharging, which can be inconvenient for users. The lack of readily available charging infrastructure in public spaces or workplaces can also be a deterrent.
- Regulatory Hurdles and Standardization: As a relatively new product category, the market faces evolving regulatory frameworks and a lack of standardized certifications for performance and safety, potentially leading to market fragmentation and consumer confusion.
Emerging Opportunities in Electronic Intelligent Mask
The Electronic Intelligent Mask market is ripe with emerging opportunities, driven by ongoing technological innovation and expanding consumer needs.
- Personalized Health and Wellness: The integration of biometric sensors for real-time health monitoring (e.g., heart rate, blood oxygen levels) presents a significant opportunity to position intelligent masks as comprehensive personal wellness devices, extending beyond just air filtration.
- Smart City Integration and IoT Ecosystems: As smart cities evolve, intelligent masks can become integral components of the IoT ecosystem, communicating with smart home devices, environmental sensors, and wearable technology to provide a holistic view of personal health and environmental exposure.
- Customization and Personalization: Offering customizable designs, filter types, and smart features based on individual user profiles and preferences can create a strong competitive advantage and cater to niche markets.
- Emerging Markets and Developing Nations: With increasing urbanization and pollution concerns in developing nations, there is a substantial opportunity to introduce affordable and effective intelligent mask solutions tailored to their specific needs and economic conditions.
Leading Players in the Electronic Intelligent Mask Market
- Dyson
- TCL
- HimaMonkey
- LG Electronics
- Mondial Medical Technologies
- Guts Air
- Ao Air
- AirBliss
- AIR⁺
Key Developments in Electronic Intelligent Mask Industry
- 2023/11: Dyson launches its latest smart mask prototype, focusing on enhanced filtration and user comfort.
- 2024/03: TCL unveils a new generation of intelligent masks with integrated AI-powered air quality analysis.
- 2024/07: HimaMonkey secures significant funding for R&D in advanced sensor technology for smart masks.
- 2025/01: LG Electronics announces strategic partnerships to expand its smart mask distribution in European markets.
- 2025/04: Mondial Medical Technologies showcases its medical-grade intelligent mask at a global health expo, targeting the healthcare sector.
Strategic Outlook for Electronic Intelligent Mask Market
The strategic outlook for the Electronic Intelligent Mask market is exceptionally positive, driven by an anticipated surge in demand for advanced personal protection and health monitoring solutions. The continued integration of sophisticated AI, IoT, and advanced sensor technologies will elevate these masks from mere protective gear to indispensable personal health companions. Strategic focus on miniaturization, battery optimization, and user-centric design will be critical for broader market penetration. Partnerships with healthcare providers and smart city initiatives will unlock significant growth avenues, transforming the market landscape. The increasing consumer consciousness regarding environmental pollutants and personal well-being will continue to be the primary catalyst, ensuring a robust expansion for innovative and intelligent masking solutions.
Electronic Intelligent Mask Segmentation
-
1. Application
- 1.1. Health Care
- 1.2. Air Filter
- 1.3. Haze Isolation
- 1.4. Others
-
2. Types
- 2.1. Hang Ear Type
- 2.2. Hang Neck Type
Electronic Intelligent Mask Segmentation By Geography
-
1. North America
- 1.1. United States
- 1.2. Canada
- 1.3. Mexico
-
2. South America
- 2.1. Brazil
- 2.2. Argentina
- 2.3. Rest of South America
-
3. Europe
- 3.1. United Kingdom
- 3.2. Germany
- 3.3. France
- 3.4. Italy
- 3.5. Spain
- 3.6. Russia
- 3.7. Benelux
- 3.8. Nordics
- 3.9. Rest of Europe
-
4. Middle East & Africa
- 4.1. Turkey
- 4.2. Israel
- 4.3. GCC
- 4.4. North Africa
- 4.5. South Africa
- 4.6. Rest of Middle East & Africa
-
5. Asia Pacific
- 5.1. China
- 5.2. India
- 5.3. Japan
- 5.4. South Korea
- 5.5. ASEAN
- 5.6. Oceania
- 5.7. Rest of Asia Pacific
Electronic Intelligent Mask Regional Market Share
Geographic Coverage of Electronic Intelligent Mask
Electronic Intelligent Mask REPORT HIGHLIGHTS
| Aspects | Details |
|---|---|
| Study Period | 2020-2034 |
| Base Year | 2025 |
| Estimated Year | 2026 |
| Forecast Period | 2026-2034 |
| Historical Period | 2020-2025 |
| Growth Rate | CAGR of 7.8% from 2020-2034 |
| Segmentation |
|
Table of Contents
- 1. Introduction
- 1.1. Research Scope
- 1.2. Market Segmentation
- 1.3. Research Objective
- 1.4. Definitions and Assumptions
- 2. Executive Summary
- 2.1. Market Snapshot
- 3. Market Dynamics
- 3.1. Market Drivers
- 3.2. Market Restrains
- 3.3. Market Trends
- 3.4. Market Opportunities
- 4. Market Factor Analysis
- 4.1. Porters Five Forces
- 4.1.1. Bargaining Power of Suppliers
- 4.1.2. Bargaining Power of Buyers
- 4.1.3. Threat of New Entrants
- 4.1.4. Threat of Substitutes
- 4.1.5. Competitive Rivalry
- 4.2. PESTEL analysis
- 4.3. BCG Analysis
- 4.3.1. Stars (High Growth, High Market Share)
- 4.3.2. Cash Cows (Low Growth, High Market Share)
- 4.3.3. Question Mark (High Growth, Low Market Share)
- 4.3.4. Dogs (Low Growth, Low Market Share)
- 4.4. Ansoff Matrix Analysis
- 4.5. Supply Chain Analysis
- 4.6. Regulatory Landscape
- 4.7. Current Market Potential and Opportunity Assessment (TAM–SAM–SOM Framework)
- 4.8. RAX Analyst Note
- 4.1. Porters Five Forces
- 5. Market Analysis, Insights and Forecast 2021-2033
- 5.1. Market Analysis, Insights and Forecast - by Application
- 5.1.1. Health Care
- 5.1.2. Air Filter
- 5.1.3. Haze Isolation
- 5.1.4. Others
- 5.2. Market Analysis, Insights and Forecast - by Types
- 5.2.1. Hang Ear Type
- 5.2.2. Hang Neck Type
- 5.3. Market Analysis, Insights and Forecast - by Region
- 5.3.1. North America
- 5.3.2. South America
- 5.3.3. Europe
- 5.3.4. Middle East & Africa
- 5.3.5. Asia Pacific
- 5.1. Market Analysis, Insights and Forecast - by Application
- 6. Global Electronic Intelligent Mask Analysis, Insights and Forecast, 2021-2033
- 6.1. Market Analysis, Insights and Forecast - by Application
- 6.1.1. Health Care
- 6.1.2. Air Filter
- 6.1.3. Haze Isolation
- 6.1.4. Others
- 6.2. Market Analysis, Insights and Forecast - by Types
- 6.2.1. Hang Ear Type
- 6.2.2. Hang Neck Type
- 6.1. Market Analysis, Insights and Forecast - by Application
- 7. North America Electronic Intelligent Mask Analysis, Insights and Forecast, 2020-2032
- 7.1. Market Analysis, Insights and Forecast - by Application
- 7.1.1. Health Care
- 7.1.2. Air Filter
- 7.1.3. Haze Isolation
- 7.1.4. Others
- 7.2. Market Analysis, Insights and Forecast - by Types
- 7.2.1. Hang Ear Type
- 7.2.2. Hang Neck Type
- 7.1. Market Analysis, Insights and Forecast - by Application
- 8. South America Electronic Intelligent Mask Analysis, Insights and Forecast, 2020-2032
- 8.1. Market Analysis, Insights and Forecast - by Application
- 8.1.1. Health Care
- 8.1.2. Air Filter
- 8.1.3. Haze Isolation
- 8.1.4. Others
- 8.2. Market Analysis, Insights and Forecast - by Types
- 8.2.1. Hang Ear Type
- 8.2.2. Hang Neck Type
- 8.1. Market Analysis, Insights and Forecast - by Application
- 9. Europe Electronic Intelligent Mask Analysis, Insights and Forecast, 2020-2032
- 9.1. Market Analysis, Insights and Forecast - by Application
- 9.1.1. Health Care
- 9.1.2. Air Filter
- 9.1.3. Haze Isolation
- 9.1.4. Others
- 9.2. Market Analysis, Insights and Forecast - by Types
- 9.2.1. Hang Ear Type
- 9.2.2. Hang Neck Type
- 9.1. Market Analysis, Insights and Forecast - by Application
- 10. Middle East & Africa Electronic Intelligent Mask Analysis, Insights and Forecast, 2020-2032
- 10.1. Market Analysis, Insights and Forecast - by Application
- 10.1.1. Health Care
- 10.1.2. Air Filter
- 10.1.3. Haze Isolation
- 10.1.4. Others
- 10.2. Market Analysis, Insights and Forecast - by Types
- 10.2.1. Hang Ear Type
- 10.2.2. Hang Neck Type
- 10.1. Market Analysis, Insights and Forecast - by Application
- 11. Asia Pacific Electronic Intelligent Mask Analysis, Insights and Forecast, 2020-2032
- 11.1. Market Analysis, Insights and Forecast - by Application
- 11.1.1. Health Care
- 11.1.2. Air Filter
- 11.1.3. Haze Isolation
- 11.1.4. Others
- 11.2. Market Analysis, Insights and Forecast - by Types
- 11.2.1. Hang Ear Type
- 11.2.2. Hang Neck Type
- 11.1. Market Analysis, Insights and Forecast - by Application
- 12. Competitive Analysis
- 12.1. Company Profiles
- 12.1.1 Dyson
- 12.1.1.1. Company Overview
- 12.1.1.2. Products
- 12.1.1.3. Company Financials
- 12.1.1.4. SWOT Analysis
- 12.1.2 TCL
- 12.1.2.1. Company Overview
- 12.1.2.2. Products
- 12.1.2.3. Company Financials
- 12.1.2.4. SWOT Analysis
- 12.1.3 HimaMonkey
- 12.1.3.1. Company Overview
- 12.1.3.2. Products
- 12.1.3.3. Company Financials
- 12.1.3.4. SWOT Analysis
- 12.1.4 LG Electronics
- 12.1.4.1. Company Overview
- 12.1.4.2. Products
- 12.1.4.3. Company Financials
- 12.1.4.4. SWOT Analysis
- 12.1.5 Mondial Medical Technologies
- 12.1.5.1. Company Overview
- 12.1.5.2. Products
- 12.1.5.3. Company Financials
- 12.1.5.4. SWOT Analysis
- 12.1.6 Guts Air
- 12.1.6.1. Company Overview
- 12.1.6.2. Products
- 12.1.6.3. Company Financials
- 12.1.6.4. SWOT Analysis
- 12.1.7 Ao Air
- 12.1.7.1. Company Overview
- 12.1.7.2. Products
- 12.1.7.3. Company Financials
- 12.1.7.4. SWOT Analysis
- 12.1.8 AirBliss
- 12.1.8.1. Company Overview
- 12.1.8.2. Products
- 12.1.8.3. Company Financials
- 12.1.8.4. SWOT Analysis
- 12.1.9 AIR⁺
- 12.1.9.1. Company Overview
- 12.1.9.2. Products
- 12.1.9.3. Company Financials
- 12.1.9.4. SWOT Analysis
- 12.1.1 Dyson
- 12.2. Market Entropy
- 12.2.1 Company's Key Areas Served
- 12.2.2 Recent Developments
- 12.3. Company Market Share Analysis 2025
- 12.3.1 Top 5 Companies Market Share Analysis
- 12.3.2 Top 3 Companies Market Share Analysis
- 12.4. List of Potential Customers
- 13. Research Methodology
List of Figures
- Figure 1: Global Electronic Intelligent Mask Revenue Breakdown (undefined, %) by Region 2025 & 2033
- Figure 2: Global Electronic Intelligent Mask Volume Breakdown (K, %) by Region 2025 & 2033
- Figure 3: North America Electronic Intelligent Mask Revenue (undefined), by Application 2025 & 2033
- Figure 4: North America Electronic Intelligent Mask Volume (K), by Application 2025 & 2033
- Figure 5: North America Electronic Intelligent Mask Revenue Share (%), by Application 2025 & 2033
- Figure 6: North America Electronic Intelligent Mask Volume Share (%), by Application 2025 & 2033
- Figure 7: North America Electronic Intelligent Mask Revenue (undefined), by Types 2025 & 2033
- Figure 8: North America Electronic Intelligent Mask Volume (K), by Types 2025 & 2033
- Figure 9: North America Electronic Intelligent Mask Revenue Share (%), by Types 2025 & 2033
- Figure 10: North America Electronic Intelligent Mask Volume Share (%), by Types 2025 & 2033
- Figure 11: North America Electronic Intelligent Mask Revenue (undefined), by Country 2025 & 2033
- Figure 12: North America Electronic Intelligent Mask Volume (K), by Country 2025 & 2033
- Figure 13: North America Electronic Intelligent Mask Revenue Share (%), by Country 2025 & 2033
- Figure 14: North America Electronic Intelligent Mask Volume Share (%), by Country 2025 & 2033
- Figure 15: South America Electronic Intelligent Mask Revenue (undefined), by Application 2025 & 2033
- Figure 16: South America Electronic Intelligent Mask Volume (K), by Application 2025 & 2033
- Figure 17: South America Electronic Intelligent Mask Revenue Share (%), by Application 2025 & 2033
- Figure 18: South America Electronic Intelligent Mask Volume Share (%), by Application 2025 & 2033
- Figure 19: South America Electronic Intelligent Mask Revenue (undefined), by Types 2025 & 2033
- Figure 20: South America Electronic Intelligent Mask Volume (K), by Types 2025 & 2033
- Figure 21: South America Electronic Intelligent Mask Revenue Share (%), by Types 2025 & 2033
- Figure 22: South America Electronic Intelligent Mask Volume Share (%), by Types 2025 & 2033
- Figure 23: South America Electronic Intelligent Mask Revenue (undefined), by Country 2025 & 2033
- Figure 24: South America Electronic Intelligent Mask Volume (K), by Country 2025 & 2033
- Figure 25: South America Electronic Intelligent Mask Revenue Share (%), by Country 2025 & 2033
- Figure 26: South America Electronic Intelligent Mask Volume Share (%), by Country 2025 & 2033
- Figure 27: Europe Electronic Intelligent Mask Revenue (undefined), by Application 2025 & 2033
- Figure 28: Europe Electronic Intelligent Mask Volume (K), by Application 2025 & 2033
- Figure 29: Europe Electronic Intelligent Mask Revenue Share (%), by Application 2025 & 2033
- Figure 30: Europe Electronic Intelligent Mask Volume Share (%), by Application 2025 & 2033
- Figure 31: Europe Electronic Intelligent Mask Revenue (undefined), by Types 2025 & 2033
- Figure 32: Europe Electronic Intelligent Mask Volume (K), by Types 2025 & 2033
- Figure 33: Europe Electronic Intelligent Mask Revenue Share (%), by Types 2025 & 2033
- Figure 34: Europe Electronic Intelligent Mask Volume Share (%), by Types 2025 & 2033
- Figure 35: Europe Electronic Intelligent Mask Revenue (undefined), by Country 2025 & 2033
- Figure 36: Europe Electronic Intelligent Mask Volume (K), by Country 2025 & 2033
- Figure 37: Europe Electronic Intelligent Mask Revenue Share (%), by Country 2025 & 2033
- Figure 38: Europe Electronic Intelligent Mask Volume Share (%), by Country 2025 & 2033
- Figure 39: Middle East & Africa Electronic Intelligent Mask Revenue (undefined), by Application 2025 & 2033
- Figure 40: Middle East & Africa Electronic Intelligent Mask Volume (K), by Application 2025 & 2033
- Figure 41: Middle East & Africa Electronic Intelligent Mask Revenue Share (%), by Application 2025 & 2033
- Figure 42: Middle East & Africa Electronic Intelligent Mask Volume Share (%), by Application 2025 & 2033
- Figure 43: Middle East & Africa Electronic Intelligent Mask Revenue (undefined), by Types 2025 & 2033
- Figure 44: Middle East & Africa Electronic Intelligent Mask Volume (K), by Types 2025 & 2033
- Figure 45: Middle East & Africa Electronic Intelligent Mask Revenue Share (%), by Types 2025 & 2033
- Figure 46: Middle East & Africa Electronic Intelligent Mask Volume Share (%), by Types 2025 & 2033
- Figure 47: Middle East & Africa Electronic Intelligent Mask Revenue (undefined), by Country 2025 & 2033
- Figure 48: Middle East & Africa Electronic Intelligent Mask Volume (K), by Country 2025 & 2033
- Figure 49: Middle East & Africa Electronic Intelligent Mask Revenue Share (%), by Country 2025 & 2033
- Figure 50: Middle East & Africa Electronic Intelligent Mask Volume Share (%), by Country 2025 & 2033
- Figure 51: Asia Pacific Electronic Intelligent Mask Revenue (undefined), by Application 2025 & 2033
- Figure 52: Asia Pacific Electronic Intelligent Mask Volume (K), by Application 2025 & 2033
- Figure 53: Asia Pacific Electronic Intelligent Mask Revenue Share (%), by Application 2025 & 2033
- Figure 54: Asia Pacific Electronic Intelligent Mask Volume Share (%), by Application 2025 & 2033
- Figure 55: Asia Pacific Electronic Intelligent Mask Revenue (undefined), by Types 2025 & 2033
- Figure 56: Asia Pacific Electronic Intelligent Mask Volume (K), by Types 2025 & 2033
- Figure 57: Asia Pacific Electronic Intelligent Mask Revenue Share (%), by Types 2025 & 2033
- Figure 58: Asia Pacific Electronic Intelligent Mask Volume Share (%), by Types 2025 & 2033
- Figure 59: Asia Pacific Electronic Intelligent Mask Revenue (undefined), by Country 2025 & 2033
- Figure 60: Asia Pacific Electronic Intelligent Mask Volume (K), by Country 2025 & 2033
- Figure 61: Asia Pacific Electronic Intelligent Mask Revenue Share (%), by Country 2025 & 2033
- Figure 62: Asia Pacific Electronic Intelligent Mask Volume Share (%), by Country 2025 & 2033
List of Tables
- Table 1: Global Electronic Intelligent Mask Revenue undefined Forecast, by Application 2020 & 2033
- Table 2: Global Electronic Intelligent Mask Volume K Forecast, by Application 2020 & 2033
- Table 3: Global Electronic Intelligent Mask Revenue undefined Forecast, by Types 2020 & 2033
- Table 4: Global Electronic Intelligent Mask Volume K Forecast, by Types 2020 & 2033
- Table 5: Global Electronic Intelligent Mask Revenue undefined Forecast, by Region 2020 & 2033
- Table 6: Global Electronic Intelligent Mask Volume K Forecast, by Region 2020 & 2033
- Table 7: Global Electronic Intelligent Mask Revenue undefined Forecast, by Application 2020 & 2033
- Table 8: Global Electronic Intelligent Mask Volume K Forecast, by Application 2020 & 2033
- Table 9: Global Electronic Intelligent Mask Revenue undefined Forecast, by Types 2020 & 2033
- Table 10: Global Electronic Intelligent Mask Volume K Forecast, by Types 2020 & 2033
- Table 11: Global Electronic Intelligent Mask Revenue undefined Forecast, by Country 2020 & 2033
- Table 12: Global Electronic Intelligent Mask Volume K Forecast, by Country 2020 & 2033
- Table 13: United States Electronic Intelligent Mask Revenue (undefined) Forecast, by Application 2020 & 2033
- Table 14: United States Electronic Intelligent Mask Volume (K) Forecast, by Application 2020 & 2033
- Table 15: Canada Electronic Intelligent Mask Revenue (undefined) Forecast, by Application 2020 & 2033
- Table 16: Canada Electronic Intelligent Mask Volume (K) Forecast, by Application 2020 & 2033
- Table 17: Mexico Electronic Intelligent Mask Revenue (undefined) Forecast, by Application 2020 & 2033
- Table 18: Mexico Electronic Intelligent Mask Volume (K) Forecast, by Application 2020 & 2033
- Table 19: Global Electronic Intelligent Mask Revenue undefined Forecast, by Application 2020 & 2033
- Table 20: Global Electronic Intelligent Mask Volume K Forecast, by Application 2020 & 2033
- Table 21: Global Electronic Intelligent Mask Revenue undefined Forecast, by Types 2020 & 2033
- Table 22: Global Electronic Intelligent Mask Volume K Forecast, by Types 2020 & 2033
- Table 23: Global Electronic Intelligent Mask Revenue undefined Forecast, by Country 2020 & 2033
- Table 24: Global Electronic Intelligent Mask Volume K Forecast, by Country 2020 & 2033
- Table 25: Brazil Electronic Intelligent Mask Revenue (undefined) Forecast, by Application 2020 & 2033
- Table 26: Brazil Electronic Intelligent Mask Volume (K) Forecast, by Application 2020 & 2033
- Table 27: Argentina Electronic Intelligent Mask Revenue (undefined) Forecast, by Application 2020 & 2033
- Table 28: Argentina Electronic Intelligent Mask Volume (K) Forecast, by Application 2020 & 2033
- Table 29: Rest of South America Electronic Intelligent Mask Revenue (undefined) Forecast, by Application 2020 & 2033
- Table 30: Rest of South America Electronic Intelligent Mask Volume (K) Forecast, by Application 2020 & 2033
- Table 31: Global Electronic Intelligent Mask Revenue undefined Forecast, by Application 2020 & 2033
- Table 32: Global Electronic Intelligent Mask Volume K Forecast, by Application 2020 & 2033
- Table 33: Global Electronic Intelligent Mask Revenue undefined Forecast, by Types 2020 & 2033
- Table 34: Global Electronic Intelligent Mask Volume K Forecast, by Types 2020 & 2033
- Table 35: Global Electronic Intelligent Mask Revenue undefined Forecast, by Country 2020 & 2033
- Table 36: Global Electronic Intelligent Mask Volume K Forecast, by Country 2020 & 2033
- Table 37: United Kingdom Electronic Intelligent Mask Revenue (undefined) Forecast, by Application 2020 & 2033
- Table 38: United Kingdom Electronic Intelligent Mask Volume (K) Forecast, by Application 2020 & 2033
- Table 39: Germany Electronic Intelligent Mask Revenue (undefined) Forecast, by Application 2020 & 2033
- Table 40: Germany Electronic Intelligent Mask Volume (K) Forecast, by Application 2020 & 2033
- Table 41: France Electronic Intelligent Mask Revenue (undefined) Forecast, by Application 2020 & 2033
- Table 42: France Electronic Intelligent Mask Volume (K) Forecast, by Application 2020 & 2033
- Table 43: Italy Electronic Intelligent Mask Revenue (undefined) Forecast, by Application 2020 & 2033
- Table 44: Italy Electronic Intelligent Mask Volume (K) Forecast, by Application 2020 & 2033
- Table 45: Spain Electronic Intelligent Mask Revenue (undefined) Forecast, by Application 2020 & 2033
- Table 46: Spain Electronic Intelligent Mask Volume (K) Forecast, by Application 2020 & 2033
- Table 47: Russia Electronic Intelligent Mask Revenue (undefined) Forecast, by Application 2020 & 2033
- Table 48: Russia Electronic Intelligent Mask Volume (K) Forecast, by Application 2020 & 2033
- Table 49: Benelux Electronic Intelligent Mask Revenue (undefined) Forecast, by Application 2020 & 2033
- Table 50: Benelux Electronic Intelligent Mask Volume (K) Forecast, by Application 2020 & 2033
- Table 51: Nordics Electronic Intelligent Mask Revenue (undefined) Forecast, by Application 2020 & 2033
- Table 52: Nordics Electronic Intelligent Mask Volume (K) Forecast, by Application 2020 & 2033
- Table 53: Rest of Europe Electronic Intelligent Mask Revenue (undefined) Forecast, by Application 2020 & 2033
- Table 54: Rest of Europe Electronic Intelligent Mask Volume (K) Forecast, by Application 2020 & 2033
- Table 55: Global Electronic Intelligent Mask Revenue undefined Forecast, by Application 2020 & 2033
- Table 56: Global Electronic Intelligent Mask Volume K Forecast, by Application 2020 & 2033
- Table 57: Global Electronic Intelligent Mask Revenue undefined Forecast, by Types 2020 & 2033
- Table 58: Global Electronic Intelligent Mask Volume K Forecast, by Types 2020 & 2033
- Table 59: Global Electronic Intelligent Mask Revenue undefined Forecast, by Country 2020 & 2033
- Table 60: Global Electronic Intelligent Mask Volume K Forecast, by Country 2020 & 2033
- Table 61: Turkey Electronic Intelligent Mask Revenue (undefined) Forecast, by Application 2020 & 2033
- Table 62: Turkey Electronic Intelligent Mask Volume (K) Forecast, by Application 2020 & 2033
- Table 63: Israel Electronic Intelligent Mask Revenue (undefined) Forecast, by Application 2020 & 2033
- Table 64: Israel Electronic Intelligent Mask Volume (K) Forecast, by Application 2020 & 2033
- Table 65: GCC Electronic Intelligent Mask Revenue (undefined) Forecast, by Application 2020 & 2033
- Table 66: GCC Electronic Intelligent Mask Volume (K) Forecast, by Application 2020 & 2033
- Table 67: North Africa Electronic Intelligent Mask Revenue (undefined) Forecast, by Application 2020 & 2033
- Table 68: North Africa Electronic Intelligent Mask Volume (K) Forecast, by Application 2020 & 2033
- Table 69: South Africa Electronic Intelligent Mask Revenue (undefined) Forecast, by Application 2020 & 2033
- Table 70: South Africa Electronic Intelligent Mask Volume (K) Forecast, by Application 2020 & 2033
- Table 71: Rest of Middle East & Africa Electronic Intelligent Mask Revenue (undefined) Forecast, by Application 2020 & 2033
- Table 72: Rest of Middle East & Africa Electronic Intelligent Mask Volume (K) Forecast, by Application 2020 & 2033
- Table 73: Global Electronic Intelligent Mask Revenue undefined Forecast, by Application 2020 & 2033
- Table 74: Global Electronic Intelligent Mask Volume K Forecast, by Application 2020 & 2033
- Table 75: Global Electronic Intelligent Mask Revenue undefined Forecast, by Types 2020 & 2033
- Table 76: Global Electronic Intelligent Mask Volume K Forecast, by Types 2020 & 2033
- Table 77: Global Electronic Intelligent Mask Revenue undefined Forecast, by Country 2020 & 2033
- Table 78: Global Electronic Intelligent Mask Volume K Forecast, by Country 2020 & 2033
- Table 79: China Electronic Intelligent Mask Revenue (undefined) Forecast, by Application 2020 & 2033
- Table 80: China Electronic Intelligent Mask Volume (K) Forecast, by Application 2020 & 2033
- Table 81: India Electronic Intelligent Mask Revenue (undefined) Forecast, by Application 2020 & 2033
- Table 82: India Electronic Intelligent Mask Volume (K) Forecast, by Application 2020 & 2033
- Table 83: Japan Electronic Intelligent Mask Revenue (undefined) Forecast, by Application 2020 & 2033
- Table 84: Japan Electronic Intelligent Mask Volume (K) Forecast, by Application 2020 & 2033
- Table 85: South Korea Electronic Intelligent Mask Revenue (undefined) Forecast, by Application 2020 & 2033
- Table 86: South Korea Electronic Intelligent Mask Volume (K) Forecast, by Application 2020 & 2033
- Table 87: ASEAN Electronic Intelligent Mask Revenue (undefined) Forecast, by Application 2020 & 2033
- Table 88: ASEAN Electronic Intelligent Mask Volume (K) Forecast, by Application 2020 & 2033
- Table 89: Oceania Electronic Intelligent Mask Revenue (undefined) Forecast, by Application 2020 & 2033
- Table 90: Oceania Electronic Intelligent Mask Volume (K) Forecast, by Application 2020 & 2033
- Table 91: Rest of Asia Pacific Electronic Intelligent Mask Revenue (undefined) Forecast, by Application 2020 & 2033
- Table 92: Rest of Asia Pacific Electronic Intelligent Mask Volume (K) Forecast, by Application 2020 & 2033
Frequently Asked Questions
1. What is the projected Compound Annual Growth Rate (CAGR) of the Electronic Intelligent Mask?
The projected CAGR is approximately 7.8%.
2. Which companies are prominent players in the Electronic Intelligent Mask?
Key companies in the market include Dyson, TCL, HimaMonkey, LG Electronics, Mondial Medical Technologies, Guts Air, Ao Air, AirBliss, AIR⁺.
3. What are the main segments of the Electronic Intelligent Mask?
The market segments include Application, Types.
4. Can you provide details about the market size?
The market size is estimated to be USD XXX N/A as of 2022.
5. What are some drivers contributing to market growth?
N/A
6. What are the notable trends driving market growth?
N/A
7. Are there any restraints impacting market growth?
N/A
8. Can you provide examples of recent developments in the market?
N/A
9. What pricing options are available for accessing the report?
Pricing options include single-user, multi-user, and enterprise licenses priced at USD 3350.00, USD 5025.00, and USD 6700.00 respectively.
10. Is the market size provided in terms of value or volume?
The market size is provided in terms of value, measured in N/A and volume, measured in K.
11. Are there any specific market keywords associated with the report?
Yes, the market keyword associated with the report is "Electronic Intelligent Mask," which aids in identifying and referencing the specific market segment covered.
12. How do I determine which pricing option suits my needs best?
The pricing options vary based on user requirements and access needs. Individual users may opt for single-user licenses, while businesses requiring broader access may choose multi-user or enterprise licenses for cost-effective access to the report.
13. Are there any additional resources or data provided in the Electronic Intelligent Mask report?
While the report offers comprehensive insights, it's advisable to review the specific contents or supplementary materials provided to ascertain if additional resources or data are available.
14. How can I stay updated on further developments or reports in the Electronic Intelligent Mask?
To stay informed about further developments, trends, and reports in the Electronic Intelligent Mask, consider subscribing to industry newsletters, following relevant companies and organizations, or regularly checking reputable industry news sources and publications.
Methodology
Step 1 - Identification of Relevant Samples Size from Population Database


Step 2 - Approaches for Defining Global Market Size (Value, Volume* & Price*)

Note*: In applicable scenarios
Step 3 - Data Sources
Primary Research
- Web Analytics
- Survey Reports
- Research Institute
- Latest Research Reports
- Opinion Leaders
Secondary Research
- Annual Reports
- White Paper
- Latest Press Release
- Industry Association
- Paid Database
- Investor Presentations

Step 4 - Data Triangulation
Involves using different sources of information in order to increase the validity of a study
These sources are likely to be stakeholders in a program - participants, other researchers, program staff, other community members, and so on.
Then we put all data in single framework & apply various statistical tools to find out the dynamic on the market.
During the analysis stage, feedback from the stakeholder groups would be compared to determine areas of agreement as well as areas of divergence