

Key Insights
The global electronic pens market is poised for substantial growth, projected to reach a significant market size of approximately $6,200 million by 2025. This expansion is driven by an estimated Compound Annual Growth Rate (CAGR) of around 12% through 2033, indicating a robust and sustained upward trajectory. The increasing adoption of digital note-taking, document annotation, and creative design tools across various sectors fuels this demand. The BFSI sector is a key beneficiary, leveraging electronic pens for secure document signing and data entry. Similarly, the healthcare industry is increasingly adopting these devices for electronic health records (EHRs) and patient charting, enhancing efficiency and reducing paper waste. The government sector is also recognizing the benefits for digital workflows and secure authentication. The IT and Telecom industry, a natural early adopter of technological advancements, is utilizing electronic pens for prototyping, design, and interactive presentations. While the market is dominated by established players like Apple and Wacom, innovative offerings from companies such as Livescribe and NeoLab Convergence are expanding the application landscape. The market is segmented into various types of electronic pens, including camera electronic pens for image capture and trackball electronic pens for precise cursor control, catering to diverse user needs.
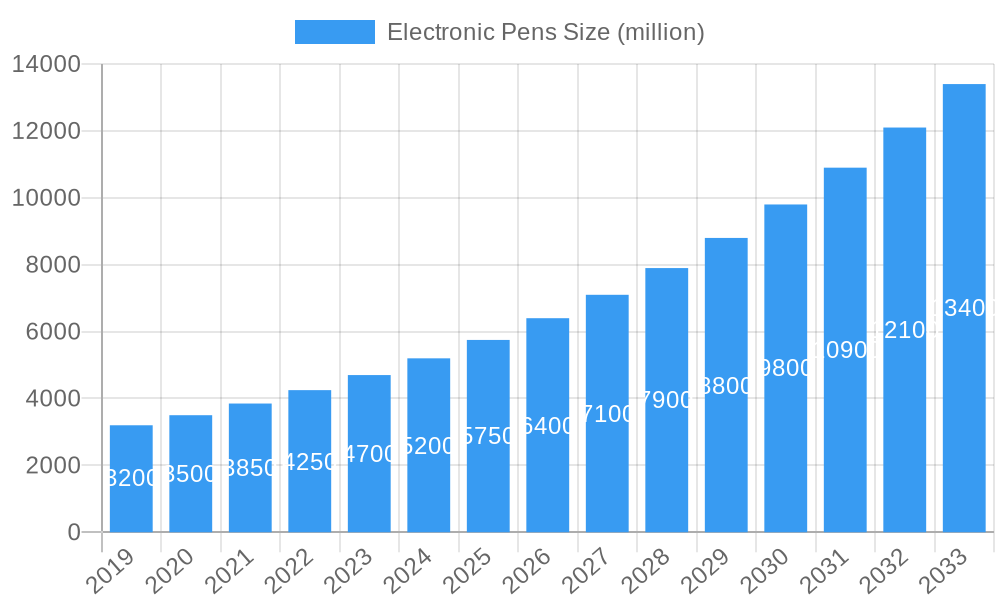
Electronic Pens Market Size (In Billion)
Looking ahead, the forecast period from 2025 to 2033 anticipates continued innovation and market penetration. Accelerometer electronic pens are expected to gain traction for their ability to track movement and gestures, opening up new possibilities in gaming and augmented reality applications. The burgeoning demand for smart devices and the increasing digitalization of everyday tasks will further propel market expansion. Emerging economies, particularly in the Asia Pacific region, with their rapidly growing tech-savvy populations and increasing disposable incomes, represent significant untapped potential. While the market enjoys strong growth drivers, challenges such as the initial cost of some advanced electronic pens and the need for user education in certain segments may present moderate restraints. However, the overarching trend towards paperless offices, enhanced productivity, and the development of more intuitive and affordable electronic pen solutions are expected to overcome these hurdles, solidifying the electronic pens market as a dynamic and vital segment of the broader consumer electronics and productivity tools landscape.
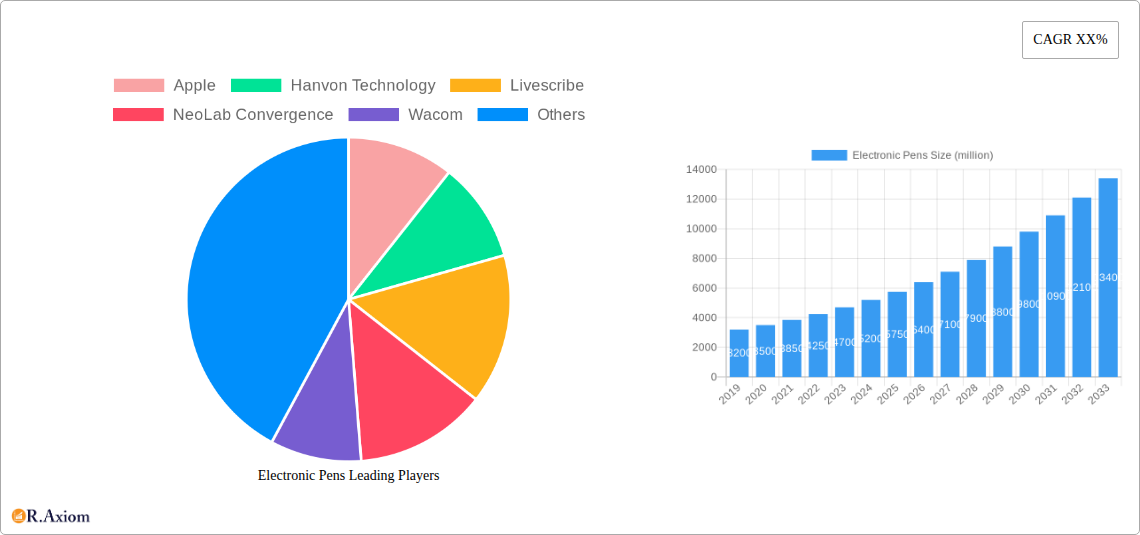
Electronic Pens Company Market Share
Electronic Pens Market Concentration & Innovation
The global electronic pens market, a dynamic sector within the broader digital writing and input device landscape, exhibits a moderate level of concentration. Major players like Apple, Wacom, and Livescribe command significant market share, driven by their established brand recognition, extensive distribution networks, and continuous investment in research and development. Hanvon Technology and NeoLab Convergence are also prominent contributors, focusing on specialized functionalities and catering to niche industrial and professional applications. Moleskine, while traditionally a paper notebook manufacturer, has strategically integrated its brand into the smart pen ecosystem, leveraging its heritage for a unique market appeal. The market's innovation landscape is primarily shaped by advancements in sensor technology, connectivity (Bluetooth, Wi-Fi), and software integration. The development of more sophisticated pressure sensitivity, tilt recognition, and haptic feedback mechanisms are key areas of R&D. Regulatory frameworks primarily concern data privacy and electronic device certifications, ensuring user security and interoperability. Product substitutes, while present in traditional pen and paper, are diminishing as digital solutions offer enhanced productivity, data management, and collaborative features. End-user trends lean towards seamless digital workflows, increased demand for intuitive interfaces, and the growing adoption of BYOD (Bring Your Own Device) policies in enterprise and educational settings. Mergers and acquisitions (M&A) activity in the electronic pens sector, though not at an extreme high, are strategic. For instance, acquisitions aimed at integrating AI-powered note-taking features or expanding into emerging markets are anticipated to shape market consolidation. Deal values are estimated to range from tens of millions to hundreds of millions of dollars, depending on the technological prowess and market reach of the acquired entity.
Electronic Pens Industry Trends & Insights
The electronic pens industry is experiencing robust growth, propelled by a confluence of technological advancements, evolving consumer preferences, and the increasing digitization of various professional and educational sectors. The Compound Annual Growth Rate (CAGR) for the electronic pens market is projected to be approximately 12% during the forecast period of 2025–2033. Market penetration is steadily increasing, exceeding 25% in developed economies and showing rapid acceleration in emerging markets. Several key growth drivers are fueling this expansion. Firstly, the escalating demand for productivity tools in a remote and hybrid work environment is paramount. Electronic pens offer an intuitive bridge between the physical and digital realms, allowing for natural note-taking, sketching, and annotation directly onto digital surfaces, which is highly valued by professionals in fields such as design, engineering, and education. The integration of advanced AI capabilities, such as real-time transcription, sentiment analysis of handwritten notes, and intelligent search functions, is a significant technological disruption that is enhancing the value proposition of electronic pens. Consumers are increasingly seeking devices that offer seamless connectivity with various platforms and devices, including smartphones, tablets, and laptops, for effortless data synchronization and sharing. This trend is fostering a preference for electronic pens with robust Bluetooth and Wi-Fi capabilities. Furthermore, the growing emphasis on digital learning and the adoption of smart classrooms are creating substantial demand for electronic pens among students and educators. These devices facilitate interactive learning experiences, digital content creation, and personalized feedback. Competitive dynamics within the industry are characterized by intense innovation and a focus on differentiating through unique features. Companies are investing heavily in developing more ergonomic designs, longer battery life, and enhanced stylus precision. The market is witnessing a shift towards specialized electronic pens tailored for specific applications, such as those with pressure-sensitive capabilities for digital art or those offering unique journaling experiences. The rise of the "digital traditionalist" – individuals who appreciate the tactile feel of writing but desire the benefits of digital storage and editing – is another significant consumer preference driving market growth. The overall industry is poised for continued expansion as these trends mature and new applications for electronic pens emerge, further solidifying their position as indispensable digital tools. The market size for electronic pens is estimated to reach XX billion USD by the end of the forecast period.
Dominant Markets & Segments in Electronic Pens
The electronic pens market exhibits a significant dominance in the Asia Pacific region, driven by rapid economic growth, a burgeoning IT and Telecom sector, and the widespread adoption of digital technologies. Within this region, China stands out as the leading country, fueled by a vast manufacturing base, substantial government investment in digital infrastructure, and a rapidly growing consumer market keen on adopting new technologies. The IT and Telecom segment is the most dominant application, accounting for an estimated 30% of the total market share. This is attributed to the extensive use of electronic pens in enterprise environments for digital note-taking, client presentations, and collaborative project management. The inherent need for efficient data capture and digital workflow integration within these industries propels their reliance on advanced input devices.
Key drivers for the dominance of the Asia Pacific region and the IT and Telecom segment include:
- Economic Policies: Pro-innovation government policies and substantial R&D incentives in countries like China and South Korea foster the growth of technology-centric industries.
- Infrastructure Development: Robust digital infrastructure, including widespread internet connectivity and the proliferation of digital devices, creates a conducive environment for the adoption of electronic pens.
- Consumer Adoption Rates: A tech-savvy population with a high propensity to embrace new gadgets and digital solutions fuels demand across all segments.
- Industry-Specific Needs: The IT and Telecom sector's reliance on digital collaboration tools, project management software, and efficient data input mechanisms makes electronic pens a natural fit.
In terms of types, Accelerometer Electronic Pens are currently leading the market, holding an estimated 40% market share. Their widespread adoption is due to their versatility, enabling precise cursor control, gesture recognition, and motion-based input across various applications without the need for complex external sensors. The ability to track movement and orientation makes them ideal for interactive presentations, gaming, and precision tasks in design software.
Other significant segments include:
- BFSI: This segment, representing approximately 20% of the market, utilizes electronic pens for secure document signing, transaction processing, and customer data entry, emphasizing data integrity and efficiency.
- Healthcare: While currently smaller at around 15%, this segment shows immense growth potential, driven by the need for digital patient record management, electronic prescribing, and medical imaging annotation. The accuracy and ease of use of electronic pens are crucial in this field.
- Government: This segment, accounting for 10%, leverages electronic pens for secure digital form processing, public service delivery, and administrative tasks, focusing on efficiency and reduced paper consumption.
- Others: This encompasses diverse applications like education, art and design, and personal productivity, collectively making up the remaining 15%, but with significant growth potential in niche areas.
The Camera Electronic Pens, though less prevalent currently (estimated 5% market share), are poised for future growth as advancements in miniaturized camera technology and AI image processing enable new functionalities like real-time object recognition and augmented reality integration.
Electronic Pens Product Developments
Recent product developments in the electronic pens market are characterized by a strong focus on enhanced user experience and expanded functionality. Innovations include the integration of AI-powered note-taking features, such as automatic transcription and intelligent summarization, alongside improved pressure sensitivity for more nuanced artistic and design applications. Companies are also prioritizing seamless connectivity with cloud services and a wider range of devices, facilitating effortless data synchronization and collaboration. Competitive advantages are being carved out through longer battery life, ergonomic designs, and the development of specialized pens tailored for specific industries like healthcare and education, offering unique features that cater to precise user needs and improve workflow efficiency.
Report Scope & Segmentation Analysis
This report comprehensively analyzes the global electronic pens market, segmented across key applications and types. The Application segmentation includes BFSI, Healthcare, Government, IT and Telecom, and Others. Growth projections for these segments indicate strong expansion in IT and Telecom and Healthcare, driven by digital transformation initiatives and the need for efficient data management. The Type segmentation covers Camera Electronic Pens, Accelerometer Electronic Pens, Trackball Electronic Pens, and Others. Accelerometer Electronic Pens are expected to maintain their leading position due to their versatility, while Camera Electronic Pens are anticipated to see significant growth with technological advancements. Competitive dynamics within each segment are shaped by the unique demands and adoption rates of specialized features and functionalities.
Key Drivers of Electronic Pens Growth
The electronic pens market is propelled by several interconnected factors. Technologically, advancements in sensor technology, miniaturization, and AI integration are creating more sophisticated and user-friendly devices. The increasing demand for productivity tools in a digitally-driven world, particularly with the rise of remote and hybrid work models, is a major economic driver. Governments worldwide are promoting digital transformation and paperless initiatives, creating a favorable regulatory environment. The adoption of BYOD policies in educational and enterprise settings further expands the market reach. For example, the integration of smart pen technology into digital learning platforms enhances student engagement and teacher efficiency, acting as a significant growth catalyst.
Challenges in the Electronic Pens Sector
Despite its growth trajectory, the electronic pens sector faces several challenges. High initial manufacturing costs for advanced components can lead to higher retail prices, potentially hindering mass adoption in price-sensitive markets. Regulatory hurdles related to data privacy and security, particularly in sensitive sectors like BFSI and Healthcare, require stringent compliance measures. Supply chain disruptions, as witnessed in recent global events, can impact the availability and cost of essential components. Intense competitive pressures from established tech giants and emerging players necessitate continuous innovation, putting pressure on profit margins. Furthermore, consumer perception and the need for user education regarding the benefits and functionalities of electronic pens can act as a barrier to entry for some potential users.
Emerging Opportunities in Electronic Pens
Emerging opportunities in the electronic pens sector are diverse and promising. The growing demand for personalized and adaptive digital experiences presents an avenue for developing pens with advanced customization features. The expansion into emerging markets with a rapidly growing middle class and increasing digital literacy offers significant untapped potential. The integration of augmented reality (AR) and virtual reality (VR) technologies could unlock new applications for electronic pens, enabling more immersive and interactive digital content creation. Furthermore, the increasing focus on sustainability could drive demand for durable and eco-friendly electronic pens. The development of specialized pens for niche applications, such as medical diagnostics or field service operations, also represents a lucrative opportunity.
Leading Players in the Electronic Pens Market
- Apple
- Hanvon Technology
- Livescribe
- NeoLab Convergence
- Wacom
- Xcallibre
- Moleskine
- NEO SMARTPEN
- Homagical
- Ciscle
- ESR GEAR
Key Developments in Electronic Pens Industry
- 2023 Q4: Apple introduces enhanced Apple Pencil features with improved latency and pressure sensitivity for iPad Pro models, reinforcing its dominance in the premium segment.
- 2023 Q3: Wacom expands its Cintiq Pro line with higher resolution displays and more advanced stylus technology, catering to professional digital artists.
- 2023 Q2: Livescribe launches a new smartpen model with enhanced cloud synchronization capabilities and expanded app integrations, targeting business professionals.
- 2022 Q4: NeoLab Convergence showcases its next-generation smartpen technology with advanced handwriting recognition and offline storage capabilities at CES.
- 2022 Q3: Moleskine announces a partnership with a leading technology firm to integrate advanced digital ink technology into its smart notebooks.
- 2022 Q1: Hanvon Technology reveals its latest stylus technology, emphasizing improved accuracy and responsiveness for industrial design applications.
Strategic Outlook for Electronic Pens Market
The strategic outlook for the electronic pens market is exceptionally positive, characterized by sustained growth driven by ongoing technological advancements and expanding application areas. The increasing convergence of digital and physical workflows across industries, coupled with a growing consumer preference for intuitive and efficient digital tools, will continue to be the primary growth catalysts. Strategic focus on enhancing AI capabilities, cloud integration, and cross-platform compatibility will be crucial for market leaders. Furthermore, exploring new market segments, such as personalized educational tools and advanced creative software interfaces, presents significant opportunities for market expansion and differentiation, solidifying the electronic pen's role as an indispensable device in the digital ecosystem.
Electronic Pens Segmentation
-
1. Application
- 1.1. BFSI
- 1.2. Healthcare
- 1.3. Government
- 1.4. IT and Telecom
- 1.5. Others
-
2. Types
- 2.1. Camera Electronic Pens
- 2.2. Accelerometer Electronic Pens
- 2.3. Trackball Electronic Pens
- 2.4. Others
Electronic Pens Segmentation By Geography
-
1. North America
- 1.1. United States
- 1.2. Canada
- 1.3. Mexico
-
2. South America
- 2.1. Brazil
- 2.2. Argentina
- 2.3. Rest of South America
-
3. Europe
- 3.1. United Kingdom
- 3.2. Germany
- 3.3. France
- 3.4. Italy
- 3.5. Spain
- 3.6. Russia
- 3.7. Benelux
- 3.8. Nordics
- 3.9. Rest of Europe
-
4. Middle East & Africa
- 4.1. Turkey
- 4.2. Israel
- 4.3. GCC
- 4.4. North Africa
- 4.5. South Africa
- 4.6. Rest of Middle East & Africa
-
5. Asia Pacific
- 5.1. China
- 5.2. India
- 5.3. Japan
- 5.4. South Korea
- 5.5. ASEAN
- 5.6. Oceania
- 5.7. Rest of Asia Pacific
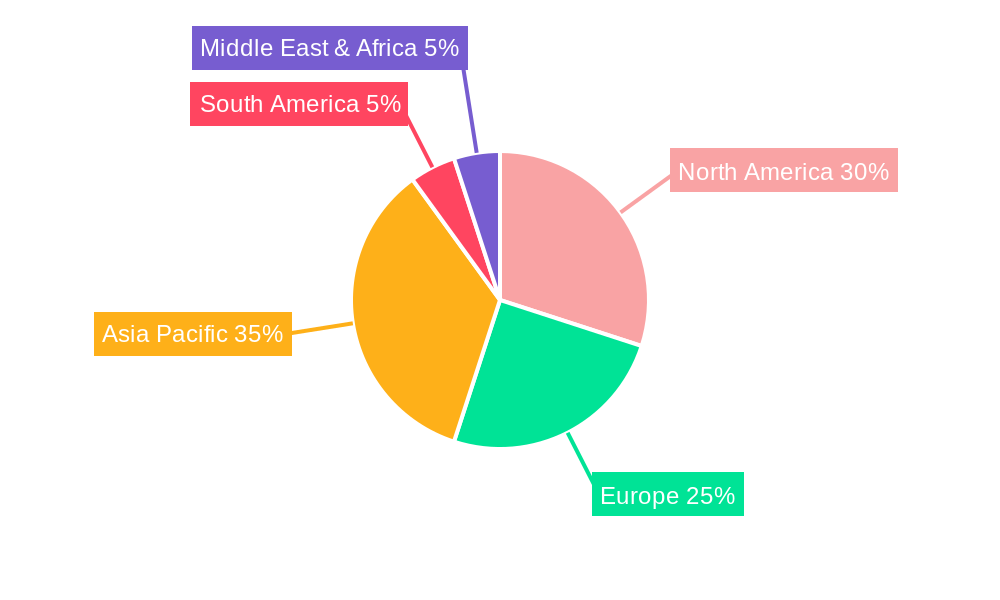
Electronic Pens Regional Market Share
Geographic Coverage of Electronic Pens
Electronic Pens REPORT HIGHLIGHTS
| Aspects | Details |
|---|---|
| Study Period | 2020-2034 |
| Base Year | 2025 |
| Estimated Year | 2026 |
| Forecast Period | 2026-2034 |
| Historical Period | 2020-2025 |
| Growth Rate | CAGR of 16.03% from 2020-2034 |
| Segmentation |
|
Table of Contents
- 1. Introduction
- 1.1. Research Scope
- 1.2. Market Segmentation
- 1.3. Research Methodology
- 1.4. Definitions and Assumptions
- 2. Executive Summary
- 2.1. Introduction
- 3. Market Dynamics
- 3.1. Introduction
- 3.2. Market Drivers
- 3.3. Market Restrains
- 3.4. Market Trends
- 4. Market Factor Analysis
- 4.1. Porters Five Forces
- 4.2. Supply/Value Chain
- 4.3. PESTEL analysis
- 4.4. Market Entropy
- 4.5. Patent/Trademark Analysis
- 5. Global Electronic Pens Analysis, Insights and Forecast, 2020-2032
- 5.1. Market Analysis, Insights and Forecast - by Application
- 5.1.1. BFSI
- 5.1.2. Healthcare
- 5.1.3. Government
- 5.1.4. IT and Telecom
- 5.1.5. Others
- 5.2. Market Analysis, Insights and Forecast - by Types
- 5.2.1. Camera Electronic Pens
- 5.2.2. Accelerometer Electronic Pens
- 5.2.3. Trackball Electronic Pens
- 5.2.4. Others
- 5.3. Market Analysis, Insights and Forecast - by Region
- 5.3.1. North America
- 5.3.2. South America
- 5.3.3. Europe
- 5.3.4. Middle East & Africa
- 5.3.5. Asia Pacific
- 5.1. Market Analysis, Insights and Forecast - by Application
- 6. North America Electronic Pens Analysis, Insights and Forecast, 2020-2032
- 6.1. Market Analysis, Insights and Forecast - by Application
- 6.1.1. BFSI
- 6.1.2. Healthcare
- 6.1.3. Government
- 6.1.4. IT and Telecom
- 6.1.5. Others
- 6.2. Market Analysis, Insights and Forecast - by Types
- 6.2.1. Camera Electronic Pens
- 6.2.2. Accelerometer Electronic Pens
- 6.2.3. Trackball Electronic Pens
- 6.2.4. Others
- 6.1. Market Analysis, Insights and Forecast - by Application
- 7. South America Electronic Pens Analysis, Insights and Forecast, 2020-2032
- 7.1. Market Analysis, Insights and Forecast - by Application
- 7.1.1. BFSI
- 7.1.2. Healthcare
- 7.1.3. Government
- 7.1.4. IT and Telecom
- 7.1.5. Others
- 7.2. Market Analysis, Insights and Forecast - by Types
- 7.2.1. Camera Electronic Pens
- 7.2.2. Accelerometer Electronic Pens
- 7.2.3. Trackball Electronic Pens
- 7.2.4. Others
- 7.1. Market Analysis, Insights and Forecast - by Application
- 8. Europe Electronic Pens Analysis, Insights and Forecast, 2020-2032
- 8.1. Market Analysis, Insights and Forecast - by Application
- 8.1.1. BFSI
- 8.1.2. Healthcare
- 8.1.3. Government
- 8.1.4. IT and Telecom
- 8.1.5. Others
- 8.2. Market Analysis, Insights and Forecast - by Types
- 8.2.1. Camera Electronic Pens
- 8.2.2. Accelerometer Electronic Pens
- 8.2.3. Trackball Electronic Pens
- 8.2.4. Others
- 8.1. Market Analysis, Insights and Forecast - by Application
- 9. Middle East & Africa Electronic Pens Analysis, Insights and Forecast, 2020-2032
- 9.1. Market Analysis, Insights and Forecast - by Application
- 9.1.1. BFSI
- 9.1.2. Healthcare
- 9.1.3. Government
- 9.1.4. IT and Telecom
- 9.1.5. Others
- 9.2. Market Analysis, Insights and Forecast - by Types
- 9.2.1. Camera Electronic Pens
- 9.2.2. Accelerometer Electronic Pens
- 9.2.3. Trackball Electronic Pens
- 9.2.4. Others
- 9.1. Market Analysis, Insights and Forecast - by Application
- 10. Asia Pacific Electronic Pens Analysis, Insights and Forecast, 2020-2032
- 10.1. Market Analysis, Insights and Forecast - by Application
- 10.1.1. BFSI
- 10.1.2. Healthcare
- 10.1.3. Government
- 10.1.4. IT and Telecom
- 10.1.5. Others
- 10.2. Market Analysis, Insights and Forecast - by Types
- 10.2.1. Camera Electronic Pens
- 10.2.2. Accelerometer Electronic Pens
- 10.2.3. Trackball Electronic Pens
- 10.2.4. Others
- 10.1. Market Analysis, Insights and Forecast - by Application
- 11. Competitive Analysis
- 11.1. Global Market Share Analysis 2025
- 11.2. Company Profiles
- 11.2.1 Apple
- 11.2.1.1. Overview
- 11.2.1.2. Products
- 11.2.1.3. SWOT Analysis
- 11.2.1.4. Recent Developments
- 11.2.1.5. Financials (Based on Availability)
- 11.2.2 Hanvon Technology
- 11.2.2.1. Overview
- 11.2.2.2. Products
- 11.2.2.3. SWOT Analysis
- 11.2.2.4. Recent Developments
- 11.2.2.5. Financials (Based on Availability)
- 11.2.3 Livescribe
- 11.2.3.1. Overview
- 11.2.3.2. Products
- 11.2.3.3. SWOT Analysis
- 11.2.3.4. Recent Developments
- 11.2.3.5. Financials (Based on Availability)
- 11.2.4 NeoLab Convergence
- 11.2.4.1. Overview
- 11.2.4.2. Products
- 11.2.4.3. SWOT Analysis
- 11.2.4.4. Recent Developments
- 11.2.4.5. Financials (Based on Availability)
- 11.2.5 Wacom
- 11.2.5.1. Overview
- 11.2.5.2. Products
- 11.2.5.3. SWOT Analysis
- 11.2.5.4. Recent Developments
- 11.2.5.5. Financials (Based on Availability)
- 11.2.6 Xcallibre
- 11.2.6.1. Overview
- 11.2.6.2. Products
- 11.2.6.3. SWOT Analysis
- 11.2.6.4. Recent Developments
- 11.2.6.5. Financials (Based on Availability)
- 11.2.7 Moleskine
- 11.2.7.1. Overview
- 11.2.7.2. Products
- 11.2.7.3. SWOT Analysis
- 11.2.7.4. Recent Developments
- 11.2.7.5. Financials (Based on Availability)
- 11.2.8 NEO SMARTPEN
- 11.2.8.1. Overview
- 11.2.8.2. Products
- 11.2.8.3. SWOT Analysis
- 11.2.8.4. Recent Developments
- 11.2.8.5. Financials (Based on Availability)
- 11.2.9 Homagical
- 11.2.9.1. Overview
- 11.2.9.2. Products
- 11.2.9.3. SWOT Analysis
- 11.2.9.4. Recent Developments
- 11.2.9.5. Financials (Based on Availability)
- 11.2.10 Ciscle
- 11.2.10.1. Overview
- 11.2.10.2. Products
- 11.2.10.3. SWOT Analysis
- 11.2.10.4. Recent Developments
- 11.2.10.5. Financials (Based on Availability)
- 11.2.11 ESR GEAR
- 11.2.11.1. Overview
- 11.2.11.2. Products
- 11.2.11.3. SWOT Analysis
- 11.2.11.4. Recent Developments
- 11.2.11.5. Financials (Based on Availability)
- 11.2.1 Apple
List of Figures
- Figure 1: Global Electronic Pens Revenue Breakdown (undefined, %) by Region 2025 & 2033
- Figure 2: Global Electronic Pens Volume Breakdown (K, %) by Region 2025 & 2033
- Figure 3: North America Electronic Pens Revenue (undefined), by Application 2025 & 2033
- Figure 4: North America Electronic Pens Volume (K), by Application 2025 & 2033
- Figure 5: North America Electronic Pens Revenue Share (%), by Application 2025 & 2033
- Figure 6: North America Electronic Pens Volume Share (%), by Application 2025 & 2033
- Figure 7: North America Electronic Pens Revenue (undefined), by Types 2025 & 2033
- Figure 8: North America Electronic Pens Volume (K), by Types 2025 & 2033
- Figure 9: North America Electronic Pens Revenue Share (%), by Types 2025 & 2033
- Figure 10: North America Electronic Pens Volume Share (%), by Types 2025 & 2033
- Figure 11: North America Electronic Pens Revenue (undefined), by Country 2025 & 2033
- Figure 12: North America Electronic Pens Volume (K), by Country 2025 & 2033
- Figure 13: North America Electronic Pens Revenue Share (%), by Country 2025 & 2033
- Figure 14: North America Electronic Pens Volume Share (%), by Country 2025 & 2033
- Figure 15: South America Electronic Pens Revenue (undefined), by Application 2025 & 2033
- Figure 16: South America Electronic Pens Volume (K), by Application 2025 & 2033
- Figure 17: South America Electronic Pens Revenue Share (%), by Application 2025 & 2033
- Figure 18: South America Electronic Pens Volume Share (%), by Application 2025 & 2033
- Figure 19: South America Electronic Pens Revenue (undefined), by Types 2025 & 2033
- Figure 20: South America Electronic Pens Volume (K), by Types 2025 & 2033
- Figure 21: South America Electronic Pens Revenue Share (%), by Types 2025 & 2033
- Figure 22: South America Electronic Pens Volume Share (%), by Types 2025 & 2033
- Figure 23: South America Electronic Pens Revenue (undefined), by Country 2025 & 2033
- Figure 24: South America Electronic Pens Volume (K), by Country 2025 & 2033
- Figure 25: South America Electronic Pens Revenue Share (%), by Country 2025 & 2033
- Figure 26: South America Electronic Pens Volume Share (%), by Country 2025 & 2033
- Figure 27: Europe Electronic Pens Revenue (undefined), by Application 2025 & 2033
- Figure 28: Europe Electronic Pens Volume (K), by Application 2025 & 2033
- Figure 29: Europe Electronic Pens Revenue Share (%), by Application 2025 & 2033
- Figure 30: Europe Electronic Pens Volume Share (%), by Application 2025 & 2033
- Figure 31: Europe Electronic Pens Revenue (undefined), by Types 2025 & 2033
- Figure 32: Europe Electronic Pens Volume (K), by Types 2025 & 2033
- Figure 33: Europe Electronic Pens Revenue Share (%), by Types 2025 & 2033
- Figure 34: Europe Electronic Pens Volume Share (%), by Types 2025 & 2033
- Figure 35: Europe Electronic Pens Revenue (undefined), by Country 2025 & 2033
- Figure 36: Europe Electronic Pens Volume (K), by Country 2025 & 2033
- Figure 37: Europe Electronic Pens Revenue Share (%), by Country 2025 & 2033
- Figure 38: Europe Electronic Pens Volume Share (%), by Country 2025 & 2033
- Figure 39: Middle East & Africa Electronic Pens Revenue (undefined), by Application 2025 & 2033
- Figure 40: Middle East & Africa Electronic Pens Volume (K), by Application 2025 & 2033
- Figure 41: Middle East & Africa Electronic Pens Revenue Share (%), by Application 2025 & 2033
- Figure 42: Middle East & Africa Electronic Pens Volume Share (%), by Application 2025 & 2033
- Figure 43: Middle East & Africa Electronic Pens Revenue (undefined), by Types 2025 & 2033
- Figure 44: Middle East & Africa Electronic Pens Volume (K), by Types 2025 & 2033
- Figure 45: Middle East & Africa Electronic Pens Revenue Share (%), by Types 2025 & 2033
- Figure 46: Middle East & Africa Electronic Pens Volume Share (%), by Types 2025 & 2033
- Figure 47: Middle East & Africa Electronic Pens Revenue (undefined), by Country 2025 & 2033
- Figure 48: Middle East & Africa Electronic Pens Volume (K), by Country 2025 & 2033
- Figure 49: Middle East & Africa Electronic Pens Revenue Share (%), by Country 2025 & 2033
- Figure 50: Middle East & Africa Electronic Pens Volume Share (%), by Country 2025 & 2033
- Figure 51: Asia Pacific Electronic Pens Revenue (undefined), by Application 2025 & 2033
- Figure 52: Asia Pacific Electronic Pens Volume (K), by Application 2025 & 2033
- Figure 53: Asia Pacific Electronic Pens Revenue Share (%), by Application 2025 & 2033
- Figure 54: Asia Pacific Electronic Pens Volume Share (%), by Application 2025 & 2033
- Figure 55: Asia Pacific Electronic Pens Revenue (undefined), by Types 2025 & 2033
- Figure 56: Asia Pacific Electronic Pens Volume (K), by Types 2025 & 2033
- Figure 57: Asia Pacific Electronic Pens Revenue Share (%), by Types 2025 & 2033
- Figure 58: Asia Pacific Electronic Pens Volume Share (%), by Types 2025 & 2033
- Figure 59: Asia Pacific Electronic Pens Revenue (undefined), by Country 2025 & 2033
- Figure 60: Asia Pacific Electronic Pens Volume (K), by Country 2025 & 2033
- Figure 61: Asia Pacific Electronic Pens Revenue Share (%), by Country 2025 & 2033
- Figure 62: Asia Pacific Electronic Pens Volume Share (%), by Country 2025 & 2033
List of Tables
- Table 1: Global Electronic Pens Revenue undefined Forecast, by Application 2020 & 2033
- Table 2: Global Electronic Pens Volume K Forecast, by Application 2020 & 2033
- Table 3: Global Electronic Pens Revenue undefined Forecast, by Types 2020 & 2033
- Table 4: Global Electronic Pens Volume K Forecast, by Types 2020 & 2033
- Table 5: Global Electronic Pens Revenue undefined Forecast, by Region 2020 & 2033
- Table 6: Global Electronic Pens Volume K Forecast, by Region 2020 & 2033
- Table 7: Global Electronic Pens Revenue undefined Forecast, by Application 2020 & 2033
- Table 8: Global Electronic Pens Volume K Forecast, by Application 2020 & 2033
- Table 9: Global Electronic Pens Revenue undefined Forecast, by Types 2020 & 2033
- Table 10: Global Electronic Pens Volume K Forecast, by Types 2020 & 2033
- Table 11: Global Electronic Pens Revenue undefined Forecast, by Country 2020 & 2033
- Table 12: Global Electronic Pens Volume K Forecast, by Country 2020 & 2033
- Table 13: United States Electronic Pens Revenue (undefined) Forecast, by Application 2020 & 2033
- Table 14: United States Electronic Pens Volume (K) Forecast, by Application 2020 & 2033
- Table 15: Canada Electronic Pens Revenue (undefined) Forecast, by Application 2020 & 2033
- Table 16: Canada Electronic Pens Volume (K) Forecast, by Application 2020 & 2033
- Table 17: Mexico Electronic Pens Revenue (undefined) Forecast, by Application 2020 & 2033
- Table 18: Mexico Electronic Pens Volume (K) Forecast, by Application 2020 & 2033
- Table 19: Global Electronic Pens Revenue undefined Forecast, by Application 2020 & 2033
- Table 20: Global Electronic Pens Volume K Forecast, by Application 2020 & 2033
- Table 21: Global Electronic Pens Revenue undefined Forecast, by Types 2020 & 2033
- Table 22: Global Electronic Pens Volume K Forecast, by Types 2020 & 2033
- Table 23: Global Electronic Pens Revenue undefined Forecast, by Country 2020 & 2033
- Table 24: Global Electronic Pens Volume K Forecast, by Country 2020 & 2033
- Table 25: Brazil Electronic Pens Revenue (undefined) Forecast, by Application 2020 & 2033
- Table 26: Brazil Electronic Pens Volume (K) Forecast, by Application 2020 & 2033
- Table 27: Argentina Electronic Pens Revenue (undefined) Forecast, by Application 2020 & 2033
- Table 28: Argentina Electronic Pens Volume (K) Forecast, by Application 2020 & 2033
- Table 29: Rest of South America Electronic Pens Revenue (undefined) Forecast, by Application 2020 & 2033
- Table 30: Rest of South America Electronic Pens Volume (K) Forecast, by Application 2020 & 2033
- Table 31: Global Electronic Pens Revenue undefined Forecast, by Application 2020 & 2033
- Table 32: Global Electronic Pens Volume K Forecast, by Application 2020 & 2033
- Table 33: Global Electronic Pens Revenue undefined Forecast, by Types 2020 & 2033
- Table 34: Global Electronic Pens Volume K Forecast, by Types 2020 & 2033
- Table 35: Global Electronic Pens Revenue undefined Forecast, by Country 2020 & 2033
- Table 36: Global Electronic Pens Volume K Forecast, by Country 2020 & 2033
- Table 37: United Kingdom Electronic Pens Revenue (undefined) Forecast, by Application 2020 & 2033
- Table 38: United Kingdom Electronic Pens Volume (K) Forecast, by Application 2020 & 2033
- Table 39: Germany Electronic Pens Revenue (undefined) Forecast, by Application 2020 & 2033
- Table 40: Germany Electronic Pens Volume (K) Forecast, by Application 2020 & 2033
- Table 41: France Electronic Pens Revenue (undefined) Forecast, by Application 2020 & 2033
- Table 42: France Electronic Pens Volume (K) Forecast, by Application 2020 & 2033
- Table 43: Italy Electronic Pens Revenue (undefined) Forecast, by Application 2020 & 2033
- Table 44: Italy Electronic Pens Volume (K) Forecast, by Application 2020 & 2033
- Table 45: Spain Electronic Pens Revenue (undefined) Forecast, by Application 2020 & 2033
- Table 46: Spain Electronic Pens Volume (K) Forecast, by Application 2020 & 2033
- Table 47: Russia Electronic Pens Revenue (undefined) Forecast, by Application 2020 & 2033
- Table 48: Russia Electronic Pens Volume (K) Forecast, by Application 2020 & 2033
- Table 49: Benelux Electronic Pens Revenue (undefined) Forecast, by Application 2020 & 2033
- Table 50: Benelux Electronic Pens Volume (K) Forecast, by Application 2020 & 2033
- Table 51: Nordics Electronic Pens Revenue (undefined) Forecast, by Application 2020 & 2033
- Table 52: Nordics Electronic Pens Volume (K) Forecast, by Application 2020 & 2033
- Table 53: Rest of Europe Electronic Pens Revenue (undefined) Forecast, by Application 2020 & 2033
- Table 54: Rest of Europe Electronic Pens Volume (K) Forecast, by Application 2020 & 2033
- Table 55: Global Electronic Pens Revenue undefined Forecast, by Application 2020 & 2033
- Table 56: Global Electronic Pens Volume K Forecast, by Application 2020 & 2033
- Table 57: Global Electronic Pens Revenue undefined Forecast, by Types 2020 & 2033
- Table 58: Global Electronic Pens Volume K Forecast, by Types 2020 & 2033
- Table 59: Global Electronic Pens Revenue undefined Forecast, by Country 2020 & 2033
- Table 60: Global Electronic Pens Volume K Forecast, by Country 2020 & 2033
- Table 61: Turkey Electronic Pens Revenue (undefined) Forecast, by Application 2020 & 2033
- Table 62: Turkey Electronic Pens Volume (K) Forecast, by Application 2020 & 2033
- Table 63: Israel Electronic Pens Revenue (undefined) Forecast, by Application 2020 & 2033
- Table 64: Israel Electronic Pens Volume (K) Forecast, by Application 2020 & 2033
- Table 65: GCC Electronic Pens Revenue (undefined) Forecast, by Application 2020 & 2033
- Table 66: GCC Electronic Pens Volume (K) Forecast, by Application 2020 & 2033
- Table 67: North Africa Electronic Pens Revenue (undefined) Forecast, by Application 2020 & 2033
- Table 68: North Africa Electronic Pens Volume (K) Forecast, by Application 2020 & 2033
- Table 69: South Africa Electronic Pens Revenue (undefined) Forecast, by Application 2020 & 2033
- Table 70: South Africa Electronic Pens Volume (K) Forecast, by Application 2020 & 2033
- Table 71: Rest of Middle East & Africa Electronic Pens Revenue (undefined) Forecast, by Application 2020 & 2033
- Table 72: Rest of Middle East & Africa Electronic Pens Volume (K) Forecast, by Application 2020 & 2033
- Table 73: Global Electronic Pens Revenue undefined Forecast, by Application 2020 & 2033
- Table 74: Global Electronic Pens Volume K Forecast, by Application 2020 & 2033
- Table 75: Global Electronic Pens Revenue undefined Forecast, by Types 2020 & 2033
- Table 76: Global Electronic Pens Volume K Forecast, by Types 2020 & 2033
- Table 77: Global Electronic Pens Revenue undefined Forecast, by Country 2020 & 2033
- Table 78: Global Electronic Pens Volume K Forecast, by Country 2020 & 2033
- Table 79: China Electronic Pens Revenue (undefined) Forecast, by Application 2020 & 2033
- Table 80: China Electronic Pens Volume (K) Forecast, by Application 2020 & 2033
- Table 81: India Electronic Pens Revenue (undefined) Forecast, by Application 2020 & 2033
- Table 82: India Electronic Pens Volume (K) Forecast, by Application 2020 & 2033
- Table 83: Japan Electronic Pens Revenue (undefined) Forecast, by Application 2020 & 2033
- Table 84: Japan Electronic Pens Volume (K) Forecast, by Application 2020 & 2033
- Table 85: South Korea Electronic Pens Revenue (undefined) Forecast, by Application 2020 & 2033
- Table 86: South Korea Electronic Pens Volume (K) Forecast, by Application 2020 & 2033
- Table 87: ASEAN Electronic Pens Revenue (undefined) Forecast, by Application 2020 & 2033
- Table 88: ASEAN Electronic Pens Volume (K) Forecast, by Application 2020 & 2033
- Table 89: Oceania Electronic Pens Revenue (undefined) Forecast, by Application 2020 & 2033
- Table 90: Oceania Electronic Pens Volume (K) Forecast, by Application 2020 & 2033
- Table 91: Rest of Asia Pacific Electronic Pens Revenue (undefined) Forecast, by Application 2020 & 2033
- Table 92: Rest of Asia Pacific Electronic Pens Volume (K) Forecast, by Application 2020 & 2033
Frequently Asked Questions
1. What is the projected Compound Annual Growth Rate (CAGR) of the Electronic Pens?
The projected CAGR is approximately 16.03%.
2. Which companies are prominent players in the Electronic Pens?
Key companies in the market include Apple, Hanvon Technology, Livescribe, NeoLab Convergence, Wacom, Xcallibre, Moleskine, NEO SMARTPEN, Homagical, Ciscle, ESR GEAR.
3. What are the main segments of the Electronic Pens?
The market segments include Application, Types.
4. Can you provide details about the market size?
The market size is estimated to be USD XXX N/A as of 2022.
5. What are some drivers contributing to market growth?
N/A
6. What are the notable trends driving market growth?
N/A
7. Are there any restraints impacting market growth?
N/A
8. Can you provide examples of recent developments in the market?
N/A
9. What pricing options are available for accessing the report?
Pricing options include single-user, multi-user, and enterprise licenses priced at USD 3350.00, USD 5025.00, and USD 6700.00 respectively.
10. Is the market size provided in terms of value or volume?
The market size is provided in terms of value, measured in N/A and volume, measured in K.
11. Are there any specific market keywords associated with the report?
Yes, the market keyword associated with the report is "Electronic Pens," which aids in identifying and referencing the specific market segment covered.
12. How do I determine which pricing option suits my needs best?
The pricing options vary based on user requirements and access needs. Individual users may opt for single-user licenses, while businesses requiring broader access may choose multi-user or enterprise licenses for cost-effective access to the report.
13. Are there any additional resources or data provided in the Electronic Pens report?
While the report offers comprehensive insights, it's advisable to review the specific contents or supplementary materials provided to ascertain if additional resources or data are available.
14. How can I stay updated on further developments or reports in the Electronic Pens?
To stay informed about further developments, trends, and reports in the Electronic Pens, consider subscribing to industry newsletters, following relevant companies and organizations, or regularly checking reputable industry news sources and publications.
Methodology
Step 1 - Identification of Relevant Samples Size from Population Database


Step 2 - Approaches for Defining Global Market Size (Value, Volume* & Price*)

Note*: In applicable scenarios
Step 3 - Data Sources
Primary Research
- Web Analytics
- Survey Reports
- Research Institute
- Latest Research Reports
- Opinion Leaders
Secondary Research
- Annual Reports
- White Paper
- Latest Press Release
- Industry Association
- Paid Database
- Investor Presentations

Step 4 - Data Triangulation
Involves using different sources of information in order to increase the validity of a study
These sources are likely to be stakeholders in a program - participants, other researchers, program staff, other community members, and so on.
Then we put all data in single framework & apply various statistical tools to find out the dynamic on the market.
During the analysis stage, feedback from the stakeholder groups would be compared to determine areas of agreement as well as areas of divergence