

Key Insights
The global electronic ureteroscopy market is experiencing robust growth, driven by the increasing prevalence of urological diseases, technological advancements leading to minimally invasive procedures, and the rising demand for improved patient outcomes. The market's expansion is fueled by factors such as the growing adoption of flexible ureteroscopes, which offer enhanced visualization and maneuverability during procedures, and the increasing preference for outpatient procedures, reducing hospital stays and associated costs. This shift towards minimally invasive techniques is particularly significant in developed regions like North America and Europe, where healthcare infrastructure is well-established and patient awareness is high. However, the market's growth is tempered by factors including the high cost of electronic ureteroscopes, the need for skilled medical professionals, and the potential risk of complications associated with the procedure. Despite these challenges, ongoing research and development efforts focused on improving the technology and expanding its applications are poised to drive continued market expansion.
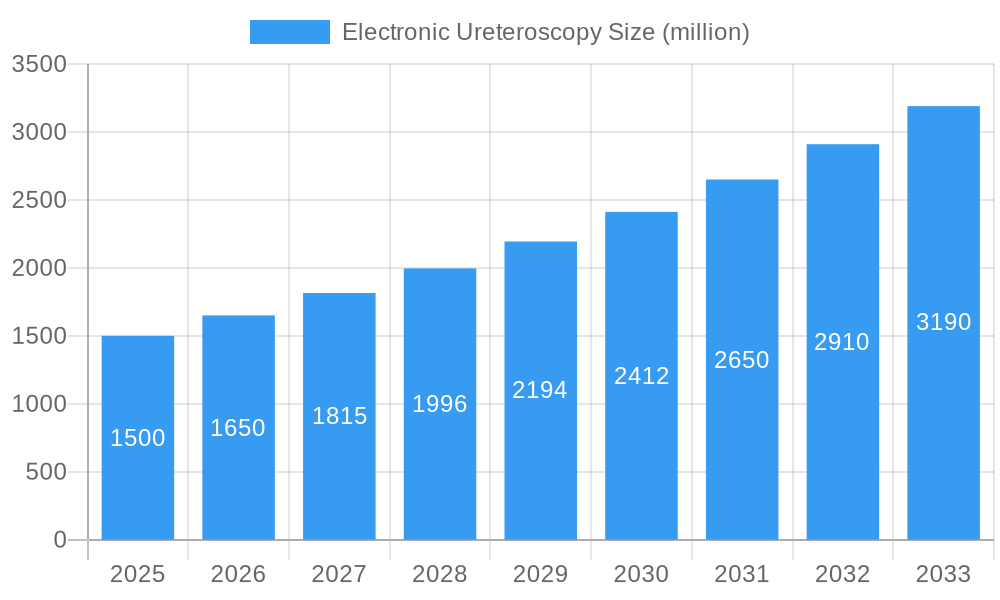
Electronic Ureteroscopy Market Size (In Billion)
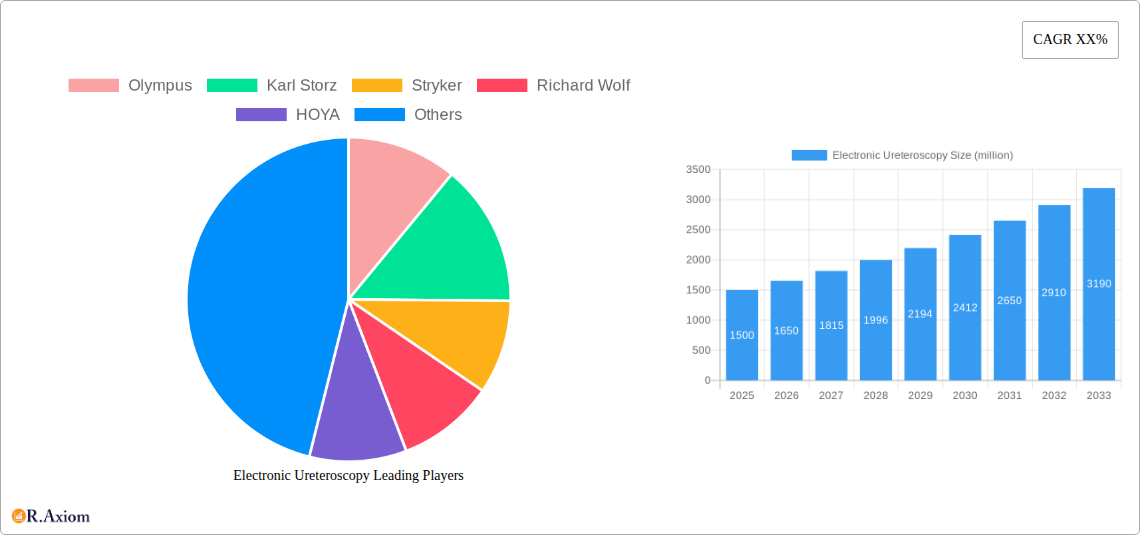
The competitive landscape is characterized by the presence of established players like Olympus, Karl Storz, Stryker, Richard Wolf, HOYA, Boston Scientific, and Maxer Endoscopy, each contributing to innovation and market penetration through product development and strategic partnerships. Ongoing competition among these firms is likely to lead to further price reductions and technological improvements, making electronic ureteroscopy more accessible and enhancing its efficacy. Future growth will likely be significantly influenced by the adoption rates in emerging markets, the development of innovative imaging technologies, and the increasing focus on the integration of advanced digital platforms for procedural guidance and data analysis. We anticipate a continued upward trend in market size, driven by these positive market forces and the growing need for effective and less-invasive urological treatments.
Electronic Ureteroscopy Company Market Share
Electronic Ureteroscopy Market Report: 2019-2033
This comprehensive report provides a detailed analysis of the global Electronic Ureteroscopy market, offering invaluable insights for stakeholders across the medical device industry. The report covers the period 2019-2033, with a focus on the 2025-2033 forecast period. This in-depth analysis leverages extensive primary and secondary research, providing a robust understanding of market dynamics, competitive landscapes, and future growth potential. The global Electronic Ureteroscopy market is projected to reach xx million by 2033, exhibiting a CAGR of xx% during the forecast period.
Electronic Ureteroscopy Market Concentration & Innovation
The Electronic Ureteroscopy market is moderately concentrated, with key players like Olympus, Karl Storz, Stryker, Richard Wolf, HOYA, Boston Scientific, and Maxer Endoscopy holding significant market share. Olympus and Karl Storz are estimated to collectively hold approximately xx% of the market in 2025, reflecting their established presence and technological leadership. The market exhibits a high level of innovation, driven by the continuous development of flexible ureteroscopes with enhanced image quality, smaller diameters, and improved maneuverability.
- Market Share (2025 Estimate): Olympus (xx%), Karl Storz (xx%), Stryker (xx%), Richard Wolf (xx%), HOYA (xx%), Boston Scientific (xx%), Maxer Endoscopy (xx%), Others (xx%).
- M&A Activity: Significant M&A activity has been observed in the historical period (2019-2024), with a total deal value exceeding $xx million. This activity is primarily driven by companies seeking to expand their product portfolios and geographic reach. Further consolidation is expected during the forecast period.
- Regulatory Frameworks: Stringent regulatory approvals (e.g., FDA, CE marking) impact market entry and product development timelines.
- Product Substitutes: While limited, traditional ureteroscopy techniques remain a substitute, particularly in settings with limited access to advanced technology.
- End-User Trends: Increasing adoption of minimally invasive procedures and a preference for improved visualization are driving demand for electronic ureteroscopes.
Electronic Ureteroscopy Industry Trends & Insights
The Electronic Ureteroscopy market is experiencing robust growth, driven by several key factors. Technological advancements, such as improved image resolution, smaller scope diameters, and integrated lithotripsy capabilities, are enhancing procedural efficiency and patient outcomes. This translates to increased adoption rates, particularly in developed regions with advanced healthcare infrastructure. The market penetration of electronic ureteroscopes in emerging markets is also gradually increasing, driven by growing awareness of minimally invasive surgical techniques.
The market witnessed a compound annual growth rate (CAGR) of xx% during the historical period (2019-2024) and is projected to maintain a healthy CAGR of xx% from 2025 to 2033. Increasing prevalence of urological diseases, rising geriatric population, and growing demand for minimally invasive surgeries are further fueling market expansion. Competitive dynamics remain intense, with established players investing heavily in R&D and strategic partnerships to maintain their market position.
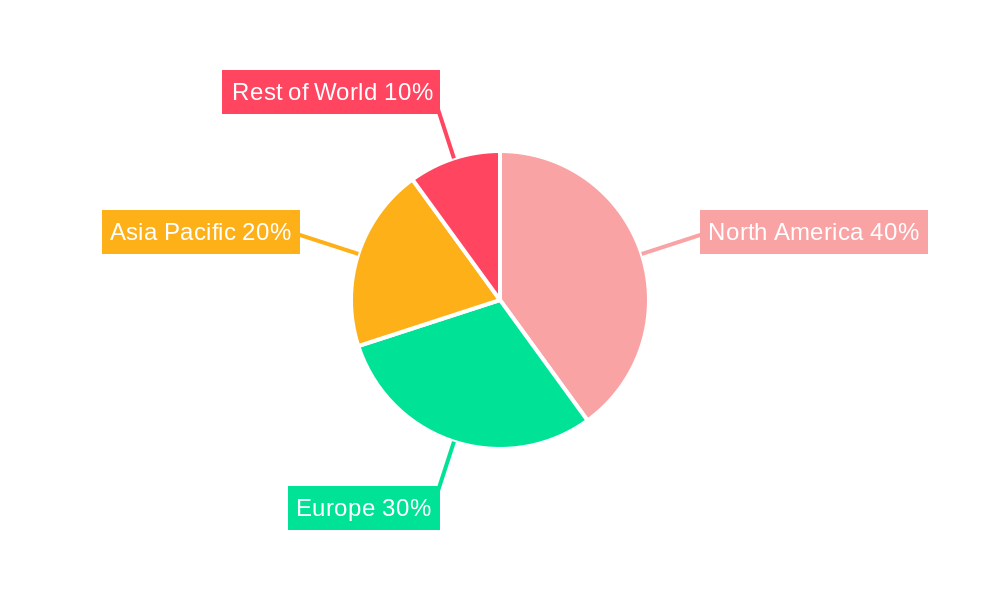
Dominant Markets & Segments in Electronic Ureteroscopy
North America currently dominates the Electronic Ureteroscopy market, driven by high healthcare expenditure, robust technological infrastructure, and a high prevalence of urological diseases. Europe holds a significant share, closely followed by the Asia Pacific region, where growth is fueled by increasing healthcare investments and rising disposable incomes. Within the segments, flexible ureteroscopes represent the largest segment, driven by their improved maneuverability and ability to access complex anatomical structures.
- North America: High healthcare spending, advanced medical infrastructure, and high prevalence of urological diseases are key drivers.
- Europe: Well-established healthcare systems and a significant number of urology procedures contribute to market dominance.
- Asia Pacific: Rapid economic growth, increasing healthcare expenditure, and rising awareness of minimally invasive procedures are driving market growth.
- Flexible Ureteroscopes: Superior maneuverability and better access to challenging anatomical sites contribute to this segment's dominance.
Electronic Ureteroscopy Product Developments
Recent product innovations focus on enhancing image quality through advancements in optics and illumination technologies, minimizing the diameter of ureteroscopes for improved patient comfort, and integrating additional functionalities such as lithotripsy and laser ablation. These developments directly improve procedural efficiency, minimize trauma, and enhance patient outcomes, contributing to wider market adoption.
Report Scope & Segmentation Analysis
This report segments the Electronic Ureteroscopy market by product type (flexible, rigid), application (stone removal, biopsy, tumor resection), end-user (hospitals, clinics, ambulatory surgical centers), and geography (North America, Europe, Asia Pacific, Rest of World). Each segment's growth projections, market size, and competitive dynamics are thoroughly analyzed to provide a comprehensive understanding of the market structure and future trends.
Key Drivers of Electronic Ureteroscopy Growth
Technological advancements, rising prevalence of urological diseases, a growing aging population, increasing demand for minimally invasive procedures, and supportive regulatory environments are the primary drivers of Electronic Ureteroscopy market growth. Increased healthcare spending and improved access to healthcare in developing nations are also significant factors.
Challenges in the Electronic Ureteroscopy Sector
Stringent regulatory approvals, high manufacturing costs, potential complications associated with the procedure, and intense competition among established players pose significant challenges. Supply chain disruptions can also impact the availability and cost of electronic ureteroscopes, affecting market growth.
Emerging Opportunities in Electronic Ureteroscopy
The development of advanced imaging techniques (e.g., fluorescence imaging), integration of artificial intelligence for improved navigation and precision, and expansion into emerging markets present significant opportunities. Developing minimally invasive, single-use devices with integrated features and improving access to remote areas holds considerable potential for the future.
Leading Players in the Electronic Ureteroscopy Market
- Olympus
- Karl Storz
- Stryker
- Richard Wolf
- HOYA
- Boston Scientific
- Maxer Endoscopy
Key Developments in Electronic Ureteroscopy Industry
- 2022 Q3: Olympus launches a new flexible ureteroscope with enhanced image quality.
- 2023 Q1: Karl Storz announces a strategic partnership to expand its distribution network in Asia.
- 2024 Q2: Stryker acquires a smaller competitor, strengthening its market position.
- Further key developments will be detailed in the full report.
Strategic Outlook for Electronic Ureteroscopy Market
The Electronic Ureteroscopy market is poised for continued growth driven by technological innovation, increasing demand for minimally invasive procedures, and expanding access to healthcare in developing regions. Strategic investments in R&D, focusing on advanced imaging and integrated functionalities, and expansion into untapped markets are critical for success in this dynamic and competitive landscape. Companies with strong innovation capabilities and a global reach are expected to gain a significant advantage.
Electronic Ureteroscopy Segmentation
-
1. Application
- 1.1. Hospitals
- 1.2. Clinic
- 1.3. Ambulatory Surgical Centers
-
2. Types
- 2.1. Single-Use Ureteroscope
- 2.2. Reuseable Ureteroscope
Electronic Ureteroscopy Segmentation By Geography
-
1. North America
- 1.1. United States
- 1.2. Canada
- 1.3. Mexico
-
2. South America
- 2.1. Brazil
- 2.2. Argentina
- 2.3. Rest of South America
-
3. Europe
- 3.1. United Kingdom
- 3.2. Germany
- 3.3. France
- 3.4. Italy
- 3.5. Spain
- 3.6. Russia
- 3.7. Benelux
- 3.8. Nordics
- 3.9. Rest of Europe
-
4. Middle East & Africa
- 4.1. Turkey
- 4.2. Israel
- 4.3. GCC
- 4.4. North Africa
- 4.5. South Africa
- 4.6. Rest of Middle East & Africa
-
5. Asia Pacific
- 5.1. China
- 5.2. India
- 5.3. Japan
- 5.4. South Korea
- 5.5. ASEAN
- 5.6. Oceania
- 5.7. Rest of Asia Pacific
Electronic Ureteroscopy Regional Market Share
Geographic Coverage of Electronic Ureteroscopy
Electronic Ureteroscopy REPORT HIGHLIGHTS
| Aspects | Details |
|---|---|
| Study Period | 2020-2034 |
| Base Year | 2025 |
| Estimated Year | 2026 |
| Forecast Period | 2026-2034 |
| Historical Period | 2020-2025 |
| Growth Rate | CAGR of XX% from 2020-2034 |
| Segmentation |
|
Table of Contents
- 1. Introduction
- 1.1. Research Scope
- 1.2. Market Segmentation
- 1.3. Research Objective
- 1.4. Definitions and Assumptions
- 2. Executive Summary
- 2.1. Market Snapshot
- 3. Market Dynamics
- 3.1. Market Drivers
- 3.2. Market Restrains
- 3.3. Market Trends
- 3.4. Market Opportunities
- 4. Market Factor Analysis
- 4.1. Porters Five Forces
- 4.1.1. Bargaining Power of Suppliers
- 4.1.2. Bargaining Power of Buyers
- 4.1.3. Threat of New Entrants
- 4.1.4. Threat of Substitutes
- 4.1.5. Competitive Rivalry
- 4.2. PESTEL analysis
- 4.3. BCG Analysis
- 4.3.1. Stars (High Growth, High Market Share)
- 4.3.2. Cash Cows (Low Growth, High Market Share)
- 4.3.3. Question Mark (High Growth, Low Market Share)
- 4.3.4. Dogs (Low Growth, Low Market Share)
- 4.4. Ansoff Matrix Analysis
- 4.5. Supply Chain Analysis
- 4.6. Regulatory Landscape
- 4.7. Current Market Potential and Opportunity Assessment (TAM–SAM–SOM Framework)
- 4.8. RAX Analyst Note
- 4.1. Porters Five Forces
- 5. Market Analysis, Insights and Forecast 2021-2033
- 5.1. Market Analysis, Insights and Forecast - by Application
- 5.1.1. Hospitals
- 5.1.2. Clinic
- 5.1.3. Ambulatory Surgical Centers
- 5.2. Market Analysis, Insights and Forecast - by Types
- 5.2.1. Single-Use Ureteroscope
- 5.2.2. Reuseable Ureteroscope
- 5.3. Market Analysis, Insights and Forecast - by Region
- 5.3.1. North America
- 5.3.2. South America
- 5.3.3. Europe
- 5.3.4. Middle East & Africa
- 5.3.5. Asia Pacific
- 5.1. Market Analysis, Insights and Forecast - by Application
- 6. Global Electronic Ureteroscopy Analysis, Insights and Forecast, 2021-2033
- 6.1. Market Analysis, Insights and Forecast - by Application
- 6.1.1. Hospitals
- 6.1.2. Clinic
- 6.1.3. Ambulatory Surgical Centers
- 6.2. Market Analysis, Insights and Forecast - by Types
- 6.2.1. Single-Use Ureteroscope
- 6.2.2. Reuseable Ureteroscope
- 6.1. Market Analysis, Insights and Forecast - by Application
- 7. North America Electronic Ureteroscopy Analysis, Insights and Forecast, 2020-2032
- 7.1. Market Analysis, Insights and Forecast - by Application
- 7.1.1. Hospitals
- 7.1.2. Clinic
- 7.1.3. Ambulatory Surgical Centers
- 7.2. Market Analysis, Insights and Forecast - by Types
- 7.2.1. Single-Use Ureteroscope
- 7.2.2. Reuseable Ureteroscope
- 7.1. Market Analysis, Insights and Forecast - by Application
- 8. South America Electronic Ureteroscopy Analysis, Insights and Forecast, 2020-2032
- 8.1. Market Analysis, Insights and Forecast - by Application
- 8.1.1. Hospitals
- 8.1.2. Clinic
- 8.1.3. Ambulatory Surgical Centers
- 8.2. Market Analysis, Insights and Forecast - by Types
- 8.2.1. Single-Use Ureteroscope
- 8.2.2. Reuseable Ureteroscope
- 8.1. Market Analysis, Insights and Forecast - by Application
- 9. Europe Electronic Ureteroscopy Analysis, Insights and Forecast, 2020-2032
- 9.1. Market Analysis, Insights and Forecast - by Application
- 9.1.1. Hospitals
- 9.1.2. Clinic
- 9.1.3. Ambulatory Surgical Centers
- 9.2. Market Analysis, Insights and Forecast - by Types
- 9.2.1. Single-Use Ureteroscope
- 9.2.2. Reuseable Ureteroscope
- 9.1. Market Analysis, Insights and Forecast - by Application
- 10. Middle East & Africa Electronic Ureteroscopy Analysis, Insights and Forecast, 2020-2032
- 10.1. Market Analysis, Insights and Forecast - by Application
- 10.1.1. Hospitals
- 10.1.2. Clinic
- 10.1.3. Ambulatory Surgical Centers
- 10.2. Market Analysis, Insights and Forecast - by Types
- 10.2.1. Single-Use Ureteroscope
- 10.2.2. Reuseable Ureteroscope
- 10.1. Market Analysis, Insights and Forecast - by Application
- 11. Asia Pacific Electronic Ureteroscopy Analysis, Insights and Forecast, 2020-2032
- 11.1. Market Analysis, Insights and Forecast - by Application
- 11.1.1. Hospitals
- 11.1.2. Clinic
- 11.1.3. Ambulatory Surgical Centers
- 11.2. Market Analysis, Insights and Forecast - by Types
- 11.2.1. Single-Use Ureteroscope
- 11.2.2. Reuseable Ureteroscope
- 11.1. Market Analysis, Insights and Forecast - by Application
- 12. Competitive Analysis
- 12.1. Company Profiles
- 12.1.1 Olympus
- 12.1.1.1. Company Overview
- 12.1.1.2. Products
- 12.1.1.3. Company Financials
- 12.1.1.4. SWOT Analysis
- 12.1.2 Karl Storz
- 12.1.2.1. Company Overview
- 12.1.2.2. Products
- 12.1.2.3. Company Financials
- 12.1.2.4. SWOT Analysis
- 12.1.3 Stryker
- 12.1.3.1. Company Overview
- 12.1.3.2. Products
- 12.1.3.3. Company Financials
- 12.1.3.4. SWOT Analysis
- 12.1.4 Richard Wolf
- 12.1.4.1. Company Overview
- 12.1.4.2. Products
- 12.1.4.3. Company Financials
- 12.1.4.4. SWOT Analysis
- 12.1.5 HOYA
- 12.1.5.1. Company Overview
- 12.1.5.2. Products
- 12.1.5.3. Company Financials
- 12.1.5.4. SWOT Analysis
- 12.1.6 Boston Scientific
- 12.1.6.1. Company Overview
- 12.1.6.2. Products
- 12.1.6.3. Company Financials
- 12.1.6.4. SWOT Analysis
- 12.1.7 Maxer Endoscopy
- 12.1.7.1. Company Overview
- 12.1.7.2. Products
- 12.1.7.3. Company Financials
- 12.1.7.4. SWOT Analysis
- 12.1.1 Olympus
- 12.2. Market Entropy
- 12.2.1 Company's Key Areas Served
- 12.2.2 Recent Developments
- 12.3. Company Market Share Analysis 2025
- 12.3.1 Top 5 Companies Market Share Analysis
- 12.3.2 Top 3 Companies Market Share Analysis
- 12.4. List of Potential Customers
- 13. Research Methodology
List of Figures
- Figure 1: Global Electronic Ureteroscopy Revenue Breakdown (million, %) by Region 2025 & 2033
- Figure 2: Global Electronic Ureteroscopy Volume Breakdown (K, %) by Region 2025 & 2033
- Figure 3: North America Electronic Ureteroscopy Revenue (million), by Application 2025 & 2033
- Figure 4: North America Electronic Ureteroscopy Volume (K), by Application 2025 & 2033
- Figure 5: North America Electronic Ureteroscopy Revenue Share (%), by Application 2025 & 2033
- Figure 6: North America Electronic Ureteroscopy Volume Share (%), by Application 2025 & 2033
- Figure 7: North America Electronic Ureteroscopy Revenue (million), by Types 2025 & 2033
- Figure 8: North America Electronic Ureteroscopy Volume (K), by Types 2025 & 2033
- Figure 9: North America Electronic Ureteroscopy Revenue Share (%), by Types 2025 & 2033
- Figure 10: North America Electronic Ureteroscopy Volume Share (%), by Types 2025 & 2033
- Figure 11: North America Electronic Ureteroscopy Revenue (million), by Country 2025 & 2033
- Figure 12: North America Electronic Ureteroscopy Volume (K), by Country 2025 & 2033
- Figure 13: North America Electronic Ureteroscopy Revenue Share (%), by Country 2025 & 2033
- Figure 14: North America Electronic Ureteroscopy Volume Share (%), by Country 2025 & 2033
- Figure 15: South America Electronic Ureteroscopy Revenue (million), by Application 2025 & 2033
- Figure 16: South America Electronic Ureteroscopy Volume (K), by Application 2025 & 2033
- Figure 17: South America Electronic Ureteroscopy Revenue Share (%), by Application 2025 & 2033
- Figure 18: South America Electronic Ureteroscopy Volume Share (%), by Application 2025 & 2033
- Figure 19: South America Electronic Ureteroscopy Revenue (million), by Types 2025 & 2033
- Figure 20: South America Electronic Ureteroscopy Volume (K), by Types 2025 & 2033
- Figure 21: South America Electronic Ureteroscopy Revenue Share (%), by Types 2025 & 2033
- Figure 22: South America Electronic Ureteroscopy Volume Share (%), by Types 2025 & 2033
- Figure 23: South America Electronic Ureteroscopy Revenue (million), by Country 2025 & 2033
- Figure 24: South America Electronic Ureteroscopy Volume (K), by Country 2025 & 2033
- Figure 25: South America Electronic Ureteroscopy Revenue Share (%), by Country 2025 & 2033
- Figure 26: South America Electronic Ureteroscopy Volume Share (%), by Country 2025 & 2033
- Figure 27: Europe Electronic Ureteroscopy Revenue (million), by Application 2025 & 2033
- Figure 28: Europe Electronic Ureteroscopy Volume (K), by Application 2025 & 2033
- Figure 29: Europe Electronic Ureteroscopy Revenue Share (%), by Application 2025 & 2033
- Figure 30: Europe Electronic Ureteroscopy Volume Share (%), by Application 2025 & 2033
- Figure 31: Europe Electronic Ureteroscopy Revenue (million), by Types 2025 & 2033
- Figure 32: Europe Electronic Ureteroscopy Volume (K), by Types 2025 & 2033
- Figure 33: Europe Electronic Ureteroscopy Revenue Share (%), by Types 2025 & 2033
- Figure 34: Europe Electronic Ureteroscopy Volume Share (%), by Types 2025 & 2033
- Figure 35: Europe Electronic Ureteroscopy Revenue (million), by Country 2025 & 2033
- Figure 36: Europe Electronic Ureteroscopy Volume (K), by Country 2025 & 2033
- Figure 37: Europe Electronic Ureteroscopy Revenue Share (%), by Country 2025 & 2033
- Figure 38: Europe Electronic Ureteroscopy Volume Share (%), by Country 2025 & 2033
- Figure 39: Middle East & Africa Electronic Ureteroscopy Revenue (million), by Application 2025 & 2033
- Figure 40: Middle East & Africa Electronic Ureteroscopy Volume (K), by Application 2025 & 2033
- Figure 41: Middle East & Africa Electronic Ureteroscopy Revenue Share (%), by Application 2025 & 2033
- Figure 42: Middle East & Africa Electronic Ureteroscopy Volume Share (%), by Application 2025 & 2033
- Figure 43: Middle East & Africa Electronic Ureteroscopy Revenue (million), by Types 2025 & 2033
- Figure 44: Middle East & Africa Electronic Ureteroscopy Volume (K), by Types 2025 & 2033
- Figure 45: Middle East & Africa Electronic Ureteroscopy Revenue Share (%), by Types 2025 & 2033
- Figure 46: Middle East & Africa Electronic Ureteroscopy Volume Share (%), by Types 2025 & 2033
- Figure 47: Middle East & Africa Electronic Ureteroscopy Revenue (million), by Country 2025 & 2033
- Figure 48: Middle East & Africa Electronic Ureteroscopy Volume (K), by Country 2025 & 2033
- Figure 49: Middle East & Africa Electronic Ureteroscopy Revenue Share (%), by Country 2025 & 2033
- Figure 50: Middle East & Africa Electronic Ureteroscopy Volume Share (%), by Country 2025 & 2033
- Figure 51: Asia Pacific Electronic Ureteroscopy Revenue (million), by Application 2025 & 2033
- Figure 52: Asia Pacific Electronic Ureteroscopy Volume (K), by Application 2025 & 2033
- Figure 53: Asia Pacific Electronic Ureteroscopy Revenue Share (%), by Application 2025 & 2033
- Figure 54: Asia Pacific Electronic Ureteroscopy Volume Share (%), by Application 2025 & 2033
- Figure 55: Asia Pacific Electronic Ureteroscopy Revenue (million), by Types 2025 & 2033
- Figure 56: Asia Pacific Electronic Ureteroscopy Volume (K), by Types 2025 & 2033
- Figure 57: Asia Pacific Electronic Ureteroscopy Revenue Share (%), by Types 2025 & 2033
- Figure 58: Asia Pacific Electronic Ureteroscopy Volume Share (%), by Types 2025 & 2033
- Figure 59: Asia Pacific Electronic Ureteroscopy Revenue (million), by Country 2025 & 2033
- Figure 60: Asia Pacific Electronic Ureteroscopy Volume (K), by Country 2025 & 2033
- Figure 61: Asia Pacific Electronic Ureteroscopy Revenue Share (%), by Country 2025 & 2033
- Figure 62: Asia Pacific Electronic Ureteroscopy Volume Share (%), by Country 2025 & 2033
List of Tables
- Table 1: Global Electronic Ureteroscopy Revenue million Forecast, by Application 2020 & 2033
- Table 2: Global Electronic Ureteroscopy Volume K Forecast, by Application 2020 & 2033
- Table 3: Global Electronic Ureteroscopy Revenue million Forecast, by Types 2020 & 2033
- Table 4: Global Electronic Ureteroscopy Volume K Forecast, by Types 2020 & 2033
- Table 5: Global Electronic Ureteroscopy Revenue million Forecast, by Region 2020 & 2033
- Table 6: Global Electronic Ureteroscopy Volume K Forecast, by Region 2020 & 2033
- Table 7: Global Electronic Ureteroscopy Revenue million Forecast, by Application 2020 & 2033
- Table 8: Global Electronic Ureteroscopy Volume K Forecast, by Application 2020 & 2033
- Table 9: Global Electronic Ureteroscopy Revenue million Forecast, by Types 2020 & 2033
- Table 10: Global Electronic Ureteroscopy Volume K Forecast, by Types 2020 & 2033
- Table 11: Global Electronic Ureteroscopy Revenue million Forecast, by Country 2020 & 2033
- Table 12: Global Electronic Ureteroscopy Volume K Forecast, by Country 2020 & 2033
- Table 13: United States Electronic Ureteroscopy Revenue (million) Forecast, by Application 2020 & 2033
- Table 14: United States Electronic Ureteroscopy Volume (K) Forecast, by Application 2020 & 2033
- Table 15: Canada Electronic Ureteroscopy Revenue (million) Forecast, by Application 2020 & 2033
- Table 16: Canada Electronic Ureteroscopy Volume (K) Forecast, by Application 2020 & 2033
- Table 17: Mexico Electronic Ureteroscopy Revenue (million) Forecast, by Application 2020 & 2033
- Table 18: Mexico Electronic Ureteroscopy Volume (K) Forecast, by Application 2020 & 2033
- Table 19: Global Electronic Ureteroscopy Revenue million Forecast, by Application 2020 & 2033
- Table 20: Global Electronic Ureteroscopy Volume K Forecast, by Application 2020 & 2033
- Table 21: Global Electronic Ureteroscopy Revenue million Forecast, by Types 2020 & 2033
- Table 22: Global Electronic Ureteroscopy Volume K Forecast, by Types 2020 & 2033
- Table 23: Global Electronic Ureteroscopy Revenue million Forecast, by Country 2020 & 2033
- Table 24: Global Electronic Ureteroscopy Volume K Forecast, by Country 2020 & 2033
- Table 25: Brazil Electronic Ureteroscopy Revenue (million) Forecast, by Application 2020 & 2033
- Table 26: Brazil Electronic Ureteroscopy Volume (K) Forecast, by Application 2020 & 2033
- Table 27: Argentina Electronic Ureteroscopy Revenue (million) Forecast, by Application 2020 & 2033
- Table 28: Argentina Electronic Ureteroscopy Volume (K) Forecast, by Application 2020 & 2033
- Table 29: Rest of South America Electronic Ureteroscopy Revenue (million) Forecast, by Application 2020 & 2033
- Table 30: Rest of South America Electronic Ureteroscopy Volume (K) Forecast, by Application 2020 & 2033
- Table 31: Global Electronic Ureteroscopy Revenue million Forecast, by Application 2020 & 2033
- Table 32: Global Electronic Ureteroscopy Volume K Forecast, by Application 2020 & 2033
- Table 33: Global Electronic Ureteroscopy Revenue million Forecast, by Types 2020 & 2033
- Table 34: Global Electronic Ureteroscopy Volume K Forecast, by Types 2020 & 2033
- Table 35: Global Electronic Ureteroscopy Revenue million Forecast, by Country 2020 & 2033
- Table 36: Global Electronic Ureteroscopy Volume K Forecast, by Country 2020 & 2033
- Table 37: United Kingdom Electronic Ureteroscopy Revenue (million) Forecast, by Application 2020 & 2033
- Table 38: United Kingdom Electronic Ureteroscopy Volume (K) Forecast, by Application 2020 & 2033
- Table 39: Germany Electronic Ureteroscopy Revenue (million) Forecast, by Application 2020 & 2033
- Table 40: Germany Electronic Ureteroscopy Volume (K) Forecast, by Application 2020 & 2033
- Table 41: France Electronic Ureteroscopy Revenue (million) Forecast, by Application 2020 & 2033
- Table 42: France Electronic Ureteroscopy Volume (K) Forecast, by Application 2020 & 2033
- Table 43: Italy Electronic Ureteroscopy Revenue (million) Forecast, by Application 2020 & 2033
- Table 44: Italy Electronic Ureteroscopy Volume (K) Forecast, by Application 2020 & 2033
- Table 45: Spain Electronic Ureteroscopy Revenue (million) Forecast, by Application 2020 & 2033
- Table 46: Spain Electronic Ureteroscopy Volume (K) Forecast, by Application 2020 & 2033
- Table 47: Russia Electronic Ureteroscopy Revenue (million) Forecast, by Application 2020 & 2033
- Table 48: Russia Electronic Ureteroscopy Volume (K) Forecast, by Application 2020 & 2033
- Table 49: Benelux Electronic Ureteroscopy Revenue (million) Forecast, by Application 2020 & 2033
- Table 50: Benelux Electronic Ureteroscopy Volume (K) Forecast, by Application 2020 & 2033
- Table 51: Nordics Electronic Ureteroscopy Revenue (million) Forecast, by Application 2020 & 2033
- Table 52: Nordics Electronic Ureteroscopy Volume (K) Forecast, by Application 2020 & 2033
- Table 53: Rest of Europe Electronic Ureteroscopy Revenue (million) Forecast, by Application 2020 & 2033
- Table 54: Rest of Europe Electronic Ureteroscopy Volume (K) Forecast, by Application 2020 & 2033
- Table 55: Global Electronic Ureteroscopy Revenue million Forecast, by Application 2020 & 2033
- Table 56: Global Electronic Ureteroscopy Volume K Forecast, by Application 2020 & 2033
- Table 57: Global Electronic Ureteroscopy Revenue million Forecast, by Types 2020 & 2033
- Table 58: Global Electronic Ureteroscopy Volume K Forecast, by Types 2020 & 2033
- Table 59: Global Electronic Ureteroscopy Revenue million Forecast, by Country 2020 & 2033
- Table 60: Global Electronic Ureteroscopy Volume K Forecast, by Country 2020 & 2033
- Table 61: Turkey Electronic Ureteroscopy Revenue (million) Forecast, by Application 2020 & 2033
- Table 62: Turkey Electronic Ureteroscopy Volume (K) Forecast, by Application 2020 & 2033
- Table 63: Israel Electronic Ureteroscopy Revenue (million) Forecast, by Application 2020 & 2033
- Table 64: Israel Electronic Ureteroscopy Volume (K) Forecast, by Application 2020 & 2033
- Table 65: GCC Electronic Ureteroscopy Revenue (million) Forecast, by Application 2020 & 2033
- Table 66: GCC Electronic Ureteroscopy Volume (K) Forecast, by Application 2020 & 2033
- Table 67: North Africa Electronic Ureteroscopy Revenue (million) Forecast, by Application 2020 & 2033
- Table 68: North Africa Electronic Ureteroscopy Volume (K) Forecast, by Application 2020 & 2033
- Table 69: South Africa Electronic Ureteroscopy Revenue (million) Forecast, by Application 2020 & 2033
- Table 70: South Africa Electronic Ureteroscopy Volume (K) Forecast, by Application 2020 & 2033
- Table 71: Rest of Middle East & Africa Electronic Ureteroscopy Revenue (million) Forecast, by Application 2020 & 2033
- Table 72: Rest of Middle East & Africa Electronic Ureteroscopy Volume (K) Forecast, by Application 2020 & 2033
- Table 73: Global Electronic Ureteroscopy Revenue million Forecast, by Application 2020 & 2033
- Table 74: Global Electronic Ureteroscopy Volume K Forecast, by Application 2020 & 2033
- Table 75: Global Electronic Ureteroscopy Revenue million Forecast, by Types 2020 & 2033
- Table 76: Global Electronic Ureteroscopy Volume K Forecast, by Types 2020 & 2033
- Table 77: Global Electronic Ureteroscopy Revenue million Forecast, by Country 2020 & 2033
- Table 78: Global Electronic Ureteroscopy Volume K Forecast, by Country 2020 & 2033
- Table 79: China Electronic Ureteroscopy Revenue (million) Forecast, by Application 2020 & 2033
- Table 80: China Electronic Ureteroscopy Volume (K) Forecast, by Application 2020 & 2033
- Table 81: India Electronic Ureteroscopy Revenue (million) Forecast, by Application 2020 & 2033
- Table 82: India Electronic Ureteroscopy Volume (K) Forecast, by Application 2020 & 2033
- Table 83: Japan Electronic Ureteroscopy Revenue (million) Forecast, by Application 2020 & 2033
- Table 84: Japan Electronic Ureteroscopy Volume (K) Forecast, by Application 2020 & 2033
- Table 85: South Korea Electronic Ureteroscopy Revenue (million) Forecast, by Application 2020 & 2033
- Table 86: South Korea Electronic Ureteroscopy Volume (K) Forecast, by Application 2020 & 2033
- Table 87: ASEAN Electronic Ureteroscopy Revenue (million) Forecast, by Application 2020 & 2033
- Table 88: ASEAN Electronic Ureteroscopy Volume (K) Forecast, by Application 2020 & 2033
- Table 89: Oceania Electronic Ureteroscopy Revenue (million) Forecast, by Application 2020 & 2033
- Table 90: Oceania Electronic Ureteroscopy Volume (K) Forecast, by Application 2020 & 2033
- Table 91: Rest of Asia Pacific Electronic Ureteroscopy Revenue (million) Forecast, by Application 2020 & 2033
- Table 92: Rest of Asia Pacific Electronic Ureteroscopy Volume (K) Forecast, by Application 2020 & 2033
Frequently Asked Questions
1. What is the projected Compound Annual Growth Rate (CAGR) of the Electronic Ureteroscopy?
The projected CAGR is approximately XX%.
2. Which companies are prominent players in the Electronic Ureteroscopy?
Key companies in the market include Olympus, Karl Storz, Stryker, Richard Wolf, HOYA, Boston Scientific, Maxer Endoscopy.
3. What are the main segments of the Electronic Ureteroscopy?
The market segments include Application, Types.
4. Can you provide details about the market size?
The market size is estimated to be USD XXX million as of 2022.
5. What are some drivers contributing to market growth?
N/A
6. What are the notable trends driving market growth?
N/A
7. Are there any restraints impacting market growth?
N/A
8. Can you provide examples of recent developments in the market?
N/A
9. What pricing options are available for accessing the report?
Pricing options include single-user, multi-user, and enterprise licenses priced at USD 3350.00, USD 5025.00, and USD 6700.00 respectively.
10. Is the market size provided in terms of value or volume?
The market size is provided in terms of value, measured in million and volume, measured in K.
11. Are there any specific market keywords associated with the report?
Yes, the market keyword associated with the report is "Electronic Ureteroscopy," which aids in identifying and referencing the specific market segment covered.
12. How do I determine which pricing option suits my needs best?
The pricing options vary based on user requirements and access needs. Individual users may opt for single-user licenses, while businesses requiring broader access may choose multi-user or enterprise licenses for cost-effective access to the report.
13. Are there any additional resources or data provided in the Electronic Ureteroscopy report?
While the report offers comprehensive insights, it's advisable to review the specific contents or supplementary materials provided to ascertain if additional resources or data are available.
14. How can I stay updated on further developments or reports in the Electronic Ureteroscopy?
To stay informed about further developments, trends, and reports in the Electronic Ureteroscopy, consider subscribing to industry newsletters, following relevant companies and organizations, or regularly checking reputable industry news sources and publications.
Methodology
Step 1 - Identification of Relevant Samples Size from Population Database


Step 2 - Approaches for Defining Global Market Size (Value, Volume* & Price*)

Note*: In applicable scenarios
Step 3 - Data Sources
Primary Research
- Web Analytics
- Survey Reports
- Research Institute
- Latest Research Reports
- Opinion Leaders
Secondary Research
- Annual Reports
- White Paper
- Latest Press Release
- Industry Association
- Paid Database
- Investor Presentations

Step 4 - Data Triangulation
Involves using different sources of information in order to increase the validity of a study
These sources are likely to be stakeholders in a program - participants, other researchers, program staff, other community members, and so on.
Then we put all data in single framework & apply various statistical tools to find out the dynamic on the market.
During the analysis stage, feedback from the stakeholder groups would be compared to determine areas of agreement as well as areas of divergence