

Key Insights
The global engineered wood market is poised for substantial expansion, driven by the escalating demand for sustainable, high-performance, and cost-efficient construction materials. Products like Laminated Veneer Lumber (LVL), Cross-Laminated Timber (CLT), and Oriented Strand Board (OSB) offer superior structural integrity and versatility, making them increasingly preferred over conventional lumber in diverse construction applications. Supportive building codes and regulations promoting green construction further accelerate the adoption of engineered wood solutions. Technological advancements in manufacturing are enhancing production efficiency and product quality, contributing to market growth. Significant opportunities arise from global population increases, urbanization trends, and robust infrastructure development, particularly in emerging economies.
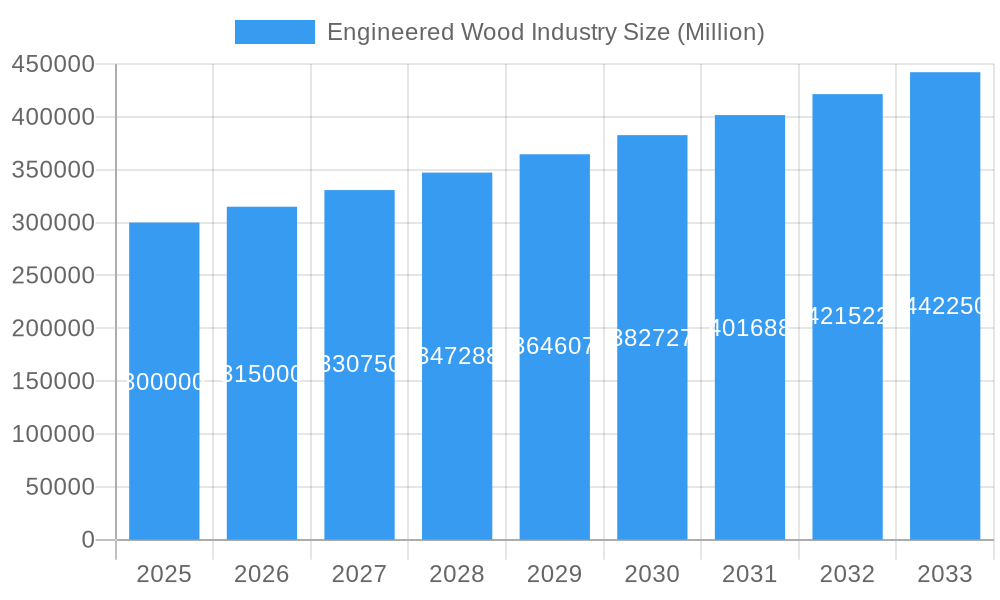
Engineered Wood Industry Market Size (In Million)
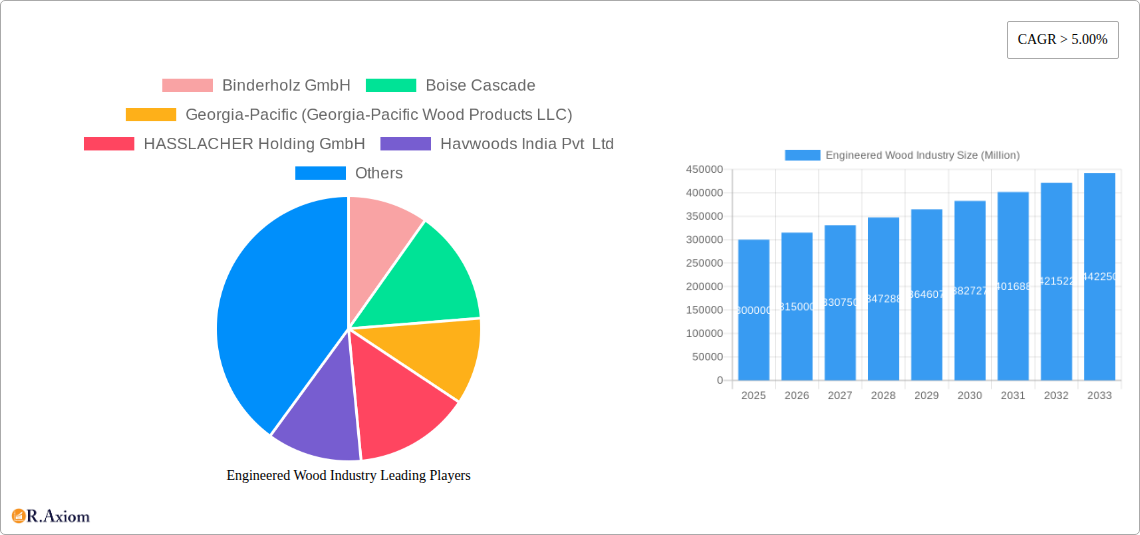
The market size for engineered wood is estimated at 299.11 million in the base year 2025, with a projected Compound Annual Growth Rate (CAGR) of 4.88%. This valuation considers the scale of key industry participants and broader market dynamics.
Engineered Wood Industry Company Market Share
While the outlook is positive, the industry navigates challenges including raw material price volatility, primarily timber, impacting production costs. Growing environmental scrutiny regarding deforestation and sustainable forestry necessitates a commitment to responsible sourcing and eco-friendly production. Intensifying competition requires continuous innovation and product enhancement. Geopolitical shifts can also influence supply chains and market access. Despite these hurdles, the long-term growth trajectory remains strong, supported by sustained demand and ongoing technological progress. Industry players are actively implementing sustainable practices, including certified timber sourcing and environmentally conscious manufacturing. The integration of digital technologies in production and supply chain management is expected to further boost efficiency and sustainability.
Engineered Wood Industry Market Report: 2019-2033
This comprehensive report provides a detailed analysis of the Engineered Wood Industry, offering invaluable insights for stakeholders seeking to navigate this dynamic market. The report covers the period 2019-2033, with a base year of 2025 and a forecast period of 2025-2033. The study leverages extensive data analysis and expert insights to present a clear picture of market trends, competitive landscapes, and future growth opportunities. The global market size is estimated at $XX Million in 2025 and is projected to reach $XX Million by 2033, exhibiting a CAGR of XX%.
Engineered Wood Industry Market Concentration & Innovation
This section analyzes the level of market concentration within the engineered wood industry, identifying key players and assessing their respective market shares. The report examines the influence of innovation drivers, such as advancements in manufacturing technology and the development of sustainable materials, on market dynamics. It also investigates the impact of regulatory frameworks, the availability of substitute products, evolving end-user trends, and mergers & acquisitions (M&A) activities on industry growth and competition.
- Market Concentration: The industry exhibits a moderately concentrated structure, with a few large players holding significant market share, such as Weyerhaeuser Company, West Fraser, and Stora Enso. Smaller companies and regional players also contribute significantly to the overall market. The report estimates that the top 5 companies collectively hold approximately XX% of the global market share in 2025.
- Innovation Drivers: Technological advancements in wood processing, such as improved gluing techniques and the development of high-performance engineered wood products, are driving innovation. The increasing demand for sustainable building materials also fuels the development of eco-friendly engineered wood solutions.
- M&A Activity: The report analyzes significant M&A deals within the industry, highlighting deal values and their impact on market consolidation. For instance, the expansion activities of Boise Cascade in 2022, detailed later in the report, indicate a strategy of market share expansion through geographical reach. The total value of M&A deals in the industry from 2019 to 2024 is estimated to be $XX Million.
- Regulatory Frameworks: Government regulations related to sustainability and building codes significantly influence the industry. The report discusses the impact of these regulations on product development and market access.
Engineered Wood Industry Industry Trends & Insights
This section delves into the key trends shaping the engineered wood industry. It examines market growth drivers, including increasing construction activity globally and the rising demand for sustainable and high-performance building materials. The analysis also considers the impact of technological disruptions, shifts in consumer preferences towards eco-friendly products, and the evolving competitive dynamics within the sector. The report projects that the market will be primarily driven by growth in residential construction, particularly in developing economies, and increasing demand from the commercial construction sector.
The report quantifies these trends with specific metrics, including the compound annual growth rate (CAGR) for various segments and market penetration rates of innovative engineered wood products. The report projects a continued growth in the adoption of engineered wood products over the forecast period driven by its superior strength-to-weight ratio, cost-effectiveness and design flexibility. The market penetration rate of Cross Laminated Timber (CLT) is projected to increase from XX% in 2025 to XX% by 2033, reflecting increased awareness of its benefits and a growing pool of qualified contractors and designers to install it.
Dominant Markets & Segments in Engineered Wood Industry
This section identifies the leading regions, countries, and segments within the engineered wood industry. It provides a detailed analysis of the factors contributing to the dominance of specific markets, including economic policies that promote sustainable construction, investments in infrastructure development, and the availability of skilled labor.
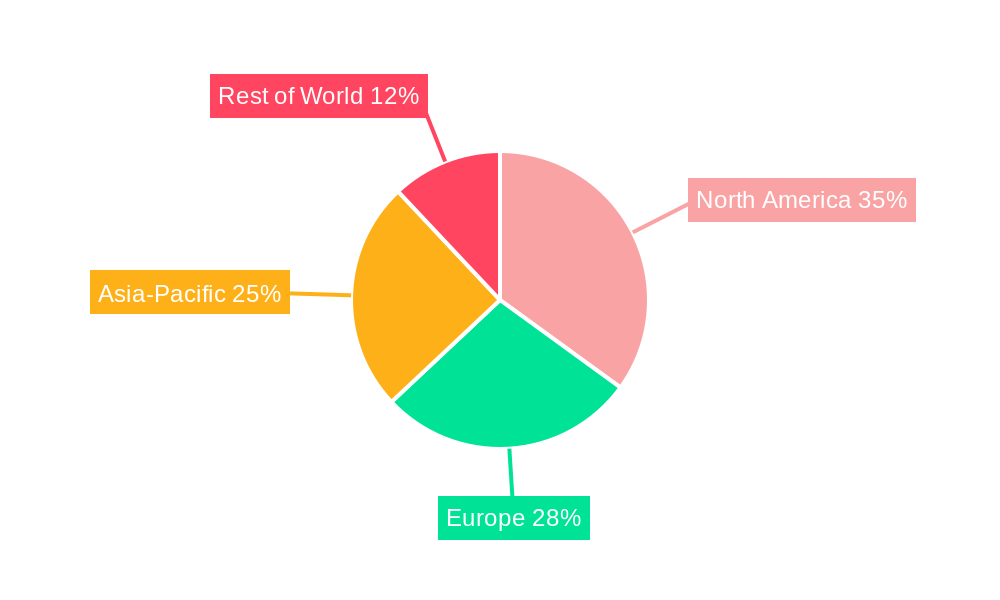
- North America: This region holds a significant share of the global market due to substantial construction activities and the presence of major industry players. Key drivers include robust residential and non-residential construction sectors, favorable government policies, and readily available raw materials.
- Europe: This region shows strong growth potential owing to a renewed focus on sustainable construction practices and the increasing adoption of engineered wood in modern architecture.
- Asia-Pacific: This region demonstrates considerable growth prospects fueled by rapid urbanization and infrastructure development. However, challenges include dependence on imports of raw materials and the need for skilled labor.
The report uses bullet points to highlight key drivers for each dominant market. The dominance analysis considers aspects like per capita income, government incentives, and building construction trends.
Engineered Wood Industry Product Developments
Recent product innovations include advancements in cross-laminated timber (CLT) technology, leading to improved structural performance and design flexibility. The development of new engineered wood products with enhanced fire resistance and acoustic properties caters to specific building requirements. These innovations are primarily driven by the need for sustainable and high-performance building materials, which are increasingly preferred by consumers and mandated by building regulations. These products demonstrate a strong market fit due to their cost-effectiveness, durability, and environmental benefits.
Report Scope & Segmentation Analysis
This report segments the engineered wood market based on product type (e.g., plywood, oriented strand board (OSB), laminated veneer lumber (LVL), CLT), application (e.g., residential, commercial, industrial), and region. Each segment’s growth projections, market size, and competitive dynamics are analyzed, revealing insights into market opportunities and potential challenges.
Growth projections for each segment vary depending on regional and application-specific factors. The fastest growing segments are expected to be CLT and other innovative mass timber products, mainly driven by sustainable building trends. The report also includes a detailed analysis of competitive dynamics across segments, including the presence of both large multinational companies and smaller niche players.
Key Drivers of Engineered Wood Industry Growth
Several factors drive the growth of the engineered wood industry. The increasing global construction activity, particularly in developing countries, fuels significant demand. Government initiatives promoting sustainable building practices encourage the use of engineered wood products. Technological advancements leading to improved product performance and cost-effectiveness further enhance market appeal. Finally, the rising awareness of the environmental benefits of wood as a renewable resource contributes to growth.
Challenges in the Engineered Wood Industry Sector
The industry faces challenges, including fluctuating raw material prices, increasing transportation costs, and competition from alternative building materials. Regulatory hurdles and stringent environmental standards may restrict production and increase operational costs. Supply chain disruptions can also lead to production delays and impact profitability. The report quantifies these impacts through the analysis of historical data and market trends. For example, the impact of raw material price fluctuations on profitability is estimated to have averaged XX% in the historical period (2019-2024).
Emerging Opportunities in Engineered Wood Industry
Emerging opportunities lie in the growing demand for sustainable and high-performance building materials, the development of innovative engineered wood products, and expansion into new markets. The increasing use of engineered wood in mass timber construction, particularly in multi-story buildings, presents significant growth potential. Furthermore, opportunities exist in developing regions with rapid urbanization and infrastructure development.
Leading Players in the Engineered Wood Industry Market
- Binderholz GmbH
- Boise Cascade
- Georgia-Pacific (Georgia-Pacific Wood Products LLC)
- HASSLACHER Holding GmbH
- Havwoods India Pvt Ltd
- Huber Engineered Woods LLC
- KLH Massivholz Wiesenau GmbH
- Kronoplus Limited
- Louisiana-Pacific Corporation
- Mayr-Melnhof Holz Holding AG
- Nordic Structures
- Pacific Woodtech Corporation
- Resolute Forest Products
- Roseburg
- Stora Enso
- West Fraser
- Weyerhaeuser Company
- *List Not Exhaustive
Key Developments in Engineered Wood Industry Industry
- October 2022: Boise Cascade announced the expansion of its distribution center through the acquisition of 4.67 acres of land adjacent to its Albuquerque, New Mexico branch. This expansion enhances its capacity to serve the Southwestern United States market, potentially increasing its market share in the region.
- December 2022: Boise Cascade expanded distribution centers in two new markets by acquiring 45 acres in Walterboro, SC, and purchasing a 34-acre land parcel in Hondo, Texas. These acquisitions significantly extend Boise Cascade's distribution network, improving delivery times and enabling the company to serve a broader customer base in the Southeast and Texas. These expansions demonstrate a proactive strategy to capitalize on growth opportunities in these regions.
Strategic Outlook for Engineered Wood Industry Market
The engineered wood industry is poised for continued growth, driven by increasing construction activity globally, the rising preference for sustainable building materials, and ongoing technological advancements. The development of innovative engineered wood products and expansion into new markets offer significant opportunities for growth. The industry will continue to see consolidation through M&A activity, with larger players seeking to expand their market share and geographic reach. The strategic outlook is positive, with significant growth potential over the forecast period.
Engineered Wood Industry Segmentation
-
1. Type
- 1.1. Plywood
- 1.2. Oriented Strand Board (OSB)
- 1.3. Glulam
- 1.4. Cross-laminated Timber (CLT)
- 1.5. Laminated Veneer Lumber (LVL)
- 1.6. Particleboard
- 1.7. Other Types (Fiber Board, Parallel Strand, Others)
-
2. Application
- 2.1. Non-residential
- 2.2. Residential
Engineered Wood Industry Segmentation By Geography
-
1. Asia Pacific
- 1.1. China
- 1.2. India
- 1.3. Japan
- 1.4. South Korea
- 1.5. Malaysia
- 1.6. Thailand
- 1.7. Indonesia
- 1.8. Vietnam
- 1.9. Rest of Asia Pacific
-
2. North America
- 2.1. United States
- 2.2. Canada
- 2.3. Mexico
-
3. Europe
- 3.1. Germany
- 3.2. United Kingdom
- 3.3. France
- 3.4. Italy
- 3.5. Spain
- 3.6. Turkey
- 3.7. Russia
- 3.8. NORDIC Countries
- 3.9. Rest of Europe
-
4. South America
- 4.1. Brazil
- 4.2. Argentina
- 4.3. Colombia
- 4.4. Rest of South America
-
5. Middle East and Africa
- 5.1. Saudi Arabia
- 5.2. Nigeria
- 5.3. Qatar
- 5.4. Egypt
- 5.5. United Arab Emirates
- 5.6. South Africa
- 5.7. Rest of Middle East and Africa
Engineered Wood Industry Regional Market Share
Geographic Coverage of Engineered Wood Industry
Engineered Wood Industry REPORT HIGHLIGHTS
| Aspects | Details |
|---|---|
| Study Period | 2020-2034 |
| Base Year | 2025 |
| Estimated Year | 2026 |
| Forecast Period | 2026-2034 |
| Historical Period | 2020-2025 |
| Growth Rate | CAGR of 4.88% from 2020-2034 |
| Segmentation |
|
Table of Contents
- 1. Introduction
- 1.1. Research Scope
- 1.2. Market Segmentation
- 1.3. Research Objective
- 1.4. Definitions and Assumptions
- 2. Executive Summary
- 2.1. Market Snapshot
- 3. Market Dynamics
- 3.1. Market Drivers
- 3.2. Market Restrains
- 3.3. Market Trends
- 3.4. Market Opportunities
- 4. Market Factor Analysis
- 4.1. Porters Five Forces
- 4.1.1. Bargaining Power of Suppliers
- 4.1.2. Bargaining Power of Buyers
- 4.1.3. Threat of New Entrants
- 4.1.4. Threat of Substitutes
- 4.1.5. Competitive Rivalry
- 4.2. PESTEL analysis
- 4.3. BCG Analysis
- 4.3.1. Stars (High Growth, High Market Share)
- 4.3.2. Cash Cows (Low Growth, High Market Share)
- 4.3.3. Question Mark (High Growth, Low Market Share)
- 4.3.4. Dogs (Low Growth, Low Market Share)
- 4.4. Ansoff Matrix Analysis
- 4.5. Supply Chain Analysis
- 4.6. Regulatory Landscape
- 4.7. Current Market Potential and Opportunity Assessment (TAM–SAM–SOM Framework)
- 4.8. RAX Analyst Note
- 4.1. Porters Five Forces
- 5. Market Analysis, Insights and Forecast 2021-2033
- 5.1. Market Analysis, Insights and Forecast - by Type
- 5.1.1. Plywood
- 5.1.2. Oriented Strand Board (OSB)
- 5.1.3. Glulam
- 5.1.4. Cross-laminated Timber (CLT)
- 5.1.5. Laminated Veneer Lumber (LVL)
- 5.1.6. Particleboard
- 5.1.7. Other Types (Fiber Board, Parallel Strand, Others)
- 5.2. Market Analysis, Insights and Forecast - by Application
- 5.2.1. Non-residential
- 5.2.2. Residential
- 5.3. Market Analysis, Insights and Forecast - by Region
- 5.3.1. Asia Pacific
- 5.3.2. North America
- 5.3.3. Europe
- 5.3.4. South America
- 5.3.5. Middle East and Africa
- 5.1. Market Analysis, Insights and Forecast - by Type
- 6. Global Engineered Wood Industry Analysis, Insights and Forecast, 2021-2033
- 6.1. Market Analysis, Insights and Forecast - by Type
- 6.1.1. Plywood
- 6.1.2. Oriented Strand Board (OSB)
- 6.1.3. Glulam
- 6.1.4. Cross-laminated Timber (CLT)
- 6.1.5. Laminated Veneer Lumber (LVL)
- 6.1.6. Particleboard
- 6.1.7. Other Types (Fiber Board, Parallel Strand, Others)
- 6.2. Market Analysis, Insights and Forecast - by Application
- 6.2.1. Non-residential
- 6.2.2. Residential
- 6.1. Market Analysis, Insights and Forecast - by Type
- 7. Asia Pacific Engineered Wood Industry Analysis, Insights and Forecast, 2020-2032
- 7.1. Market Analysis, Insights and Forecast - by Type
- 7.1.1. Plywood
- 7.1.2. Oriented Strand Board (OSB)
- 7.1.3. Glulam
- 7.1.4. Cross-laminated Timber (CLT)
- 7.1.5. Laminated Veneer Lumber (LVL)
- 7.1.6. Particleboard
- 7.1.7. Other Types (Fiber Board, Parallel Strand, Others)
- 7.2. Market Analysis, Insights and Forecast - by Application
- 7.2.1. Non-residential
- 7.2.2. Residential
- 7.1. Market Analysis, Insights and Forecast - by Type
- 8. North America Engineered Wood Industry Analysis, Insights and Forecast, 2020-2032
- 8.1. Market Analysis, Insights and Forecast - by Type
- 8.1.1. Plywood
- 8.1.2. Oriented Strand Board (OSB)
- 8.1.3. Glulam
- 8.1.4. Cross-laminated Timber (CLT)
- 8.1.5. Laminated Veneer Lumber (LVL)
- 8.1.6. Particleboard
- 8.1.7. Other Types (Fiber Board, Parallel Strand, Others)
- 8.2. Market Analysis, Insights and Forecast - by Application
- 8.2.1. Non-residential
- 8.2.2. Residential
- 8.1. Market Analysis, Insights and Forecast - by Type
- 9. Europe Engineered Wood Industry Analysis, Insights and Forecast, 2020-2032
- 9.1. Market Analysis, Insights and Forecast - by Type
- 9.1.1. Plywood
- 9.1.2. Oriented Strand Board (OSB)
- 9.1.3. Glulam
- 9.1.4. Cross-laminated Timber (CLT)
- 9.1.5. Laminated Veneer Lumber (LVL)
- 9.1.6. Particleboard
- 9.1.7. Other Types (Fiber Board, Parallel Strand, Others)
- 9.2. Market Analysis, Insights and Forecast - by Application
- 9.2.1. Non-residential
- 9.2.2. Residential
- 9.1. Market Analysis, Insights and Forecast - by Type
- 10. South America Engineered Wood Industry Analysis, Insights and Forecast, 2020-2032
- 10.1. Market Analysis, Insights and Forecast - by Type
- 10.1.1. Plywood
- 10.1.2. Oriented Strand Board (OSB)
- 10.1.3. Glulam
- 10.1.4. Cross-laminated Timber (CLT)
- 10.1.5. Laminated Veneer Lumber (LVL)
- 10.1.6. Particleboard
- 10.1.7. Other Types (Fiber Board, Parallel Strand, Others)
- 10.2. Market Analysis, Insights and Forecast - by Application
- 10.2.1. Non-residential
- 10.2.2. Residential
- 10.1. Market Analysis, Insights and Forecast - by Type
- 11. Middle East and Africa Engineered Wood Industry Analysis, Insights and Forecast, 2020-2032
- 11.1. Market Analysis, Insights and Forecast - by Type
- 11.1.1. Plywood
- 11.1.2. Oriented Strand Board (OSB)
- 11.1.3. Glulam
- 11.1.4. Cross-laminated Timber (CLT)
- 11.1.5. Laminated Veneer Lumber (LVL)
- 11.1.6. Particleboard
- 11.1.7. Other Types (Fiber Board, Parallel Strand, Others)
- 11.2. Market Analysis, Insights and Forecast - by Application
- 11.2.1. Non-residential
- 11.2.2. Residential
- 11.1. Market Analysis, Insights and Forecast - by Type
- 12. Competitive Analysis
- 12.1. Company Profiles
- 12.1.1 Binderholz GmbH
- 12.1.1.1. Company Overview
- 12.1.1.2. Products
- 12.1.1.3. Company Financials
- 12.1.1.4. SWOT Analysis
- 12.1.2 Boise Cascade
- 12.1.2.1. Company Overview
- 12.1.2.2. Products
- 12.1.2.3. Company Financials
- 12.1.2.4. SWOT Analysis
- 12.1.3 Georgia-Pacific (Georgia-Pacific Wood Products LLC)
- 12.1.3.1. Company Overview
- 12.1.3.2. Products
- 12.1.3.3. Company Financials
- 12.1.3.4. SWOT Analysis
- 12.1.4 HASSLACHER Holding GmbH
- 12.1.4.1. Company Overview
- 12.1.4.2. Products
- 12.1.4.3. Company Financials
- 12.1.4.4. SWOT Analysis
- 12.1.5 Havwoods India Pvt Ltd
- 12.1.5.1. Company Overview
- 12.1.5.2. Products
- 12.1.5.3. Company Financials
- 12.1.5.4. SWOT Analysis
- 12.1.6 Huber Engineered Woods LLC
- 12.1.6.1. Company Overview
- 12.1.6.2. Products
- 12.1.6.3. Company Financials
- 12.1.6.4. SWOT Analysis
- 12.1.7 KLH Massivholz Wiesenau GmbH
- 12.1.7.1. Company Overview
- 12.1.7.2. Products
- 12.1.7.3. Company Financials
- 12.1.7.4. SWOT Analysis
- 12.1.8 Kronoplus Limited
- 12.1.8.1. Company Overview
- 12.1.8.2. Products
- 12.1.8.3. Company Financials
- 12.1.8.4. SWOT Analysis
- 12.1.9 Louisiana-Pacific Corporation
- 12.1.9.1. Company Overview
- 12.1.9.2. Products
- 12.1.9.3. Company Financials
- 12.1.9.4. SWOT Analysis
- 12.1.10 Mayr-Melnhof Holz Holding AG
- 12.1.10.1. Company Overview
- 12.1.10.2. Products
- 12.1.10.3. Company Financials
- 12.1.10.4. SWOT Analysis
- 12.1.11 Nordic Structures
- 12.1.11.1. Company Overview
- 12.1.11.2. Products
- 12.1.11.3. Company Financials
- 12.1.11.4. SWOT Analysis
- 12.1.12 Pacific Woodtech Corporation
- 12.1.12.1. Company Overview
- 12.1.12.2. Products
- 12.1.12.3. Company Financials
- 12.1.12.4. SWOT Analysis
- 12.1.13 Resolute Forest Products
- 12.1.13.1. Company Overview
- 12.1.13.2. Products
- 12.1.13.3. Company Financials
- 12.1.13.4. SWOT Analysis
- 12.1.14 Roseburg
- 12.1.14.1. Company Overview
- 12.1.14.2. Products
- 12.1.14.3. Company Financials
- 12.1.14.4. SWOT Analysis
- 12.1.15 Stora Enso
- 12.1.15.1. Company Overview
- 12.1.15.2. Products
- 12.1.15.3. Company Financials
- 12.1.15.4. SWOT Analysis
- 12.1.16 West Fraser
- 12.1.16.1. Company Overview
- 12.1.16.2. Products
- 12.1.16.3. Company Financials
- 12.1.16.4. SWOT Analysis
- 12.1.17 Weyerhaeuser Company*List Not Exhaustive
- 12.1.17.1. Company Overview
- 12.1.17.2. Products
- 12.1.17.3. Company Financials
- 12.1.17.4. SWOT Analysis
- 12.1.1 Binderholz GmbH
- 12.2. Market Entropy
- 12.2.1 Company's Key Areas Served
- 12.2.2 Recent Developments
- 12.3. Company Market Share Analysis 2025
- 12.3.1 Top 5 Companies Market Share Analysis
- 12.3.2 Top 3 Companies Market Share Analysis
- 12.4. List of Potential Customers
- 13. Research Methodology
List of Figures
- Figure 1: Global Engineered Wood Industry Revenue Breakdown (million, %) by Region 2025 & 2033
- Figure 2: Asia Pacific Engineered Wood Industry Revenue (million), by Type 2025 & 2033
- Figure 3: Asia Pacific Engineered Wood Industry Revenue Share (%), by Type 2025 & 2033
- Figure 4: Asia Pacific Engineered Wood Industry Revenue (million), by Application 2025 & 2033
- Figure 5: Asia Pacific Engineered Wood Industry Revenue Share (%), by Application 2025 & 2033
- Figure 6: Asia Pacific Engineered Wood Industry Revenue (million), by Country 2025 & 2033
- Figure 7: Asia Pacific Engineered Wood Industry Revenue Share (%), by Country 2025 & 2033
- Figure 8: North America Engineered Wood Industry Revenue (million), by Type 2025 & 2033
- Figure 9: North America Engineered Wood Industry Revenue Share (%), by Type 2025 & 2033
- Figure 10: North America Engineered Wood Industry Revenue (million), by Application 2025 & 2033
- Figure 11: North America Engineered Wood Industry Revenue Share (%), by Application 2025 & 2033
- Figure 12: North America Engineered Wood Industry Revenue (million), by Country 2025 & 2033
- Figure 13: North America Engineered Wood Industry Revenue Share (%), by Country 2025 & 2033
- Figure 14: Europe Engineered Wood Industry Revenue (million), by Type 2025 & 2033
- Figure 15: Europe Engineered Wood Industry Revenue Share (%), by Type 2025 & 2033
- Figure 16: Europe Engineered Wood Industry Revenue (million), by Application 2025 & 2033
- Figure 17: Europe Engineered Wood Industry Revenue Share (%), by Application 2025 & 2033
- Figure 18: Europe Engineered Wood Industry Revenue (million), by Country 2025 & 2033
- Figure 19: Europe Engineered Wood Industry Revenue Share (%), by Country 2025 & 2033
- Figure 20: South America Engineered Wood Industry Revenue (million), by Type 2025 & 2033
- Figure 21: South America Engineered Wood Industry Revenue Share (%), by Type 2025 & 2033
- Figure 22: South America Engineered Wood Industry Revenue (million), by Application 2025 & 2033
- Figure 23: South America Engineered Wood Industry Revenue Share (%), by Application 2025 & 2033
- Figure 24: South America Engineered Wood Industry Revenue (million), by Country 2025 & 2033
- Figure 25: South America Engineered Wood Industry Revenue Share (%), by Country 2025 & 2033
- Figure 26: Middle East and Africa Engineered Wood Industry Revenue (million), by Type 2025 & 2033
- Figure 27: Middle East and Africa Engineered Wood Industry Revenue Share (%), by Type 2025 & 2033
- Figure 28: Middle East and Africa Engineered Wood Industry Revenue (million), by Application 2025 & 2033
- Figure 29: Middle East and Africa Engineered Wood Industry Revenue Share (%), by Application 2025 & 2033
- Figure 30: Middle East and Africa Engineered Wood Industry Revenue (million), by Country 2025 & 2033
- Figure 31: Middle East and Africa Engineered Wood Industry Revenue Share (%), by Country 2025 & 2033
List of Tables
- Table 1: Global Engineered Wood Industry Revenue million Forecast, by Type 2020 & 2033
- Table 2: Global Engineered Wood Industry Revenue million Forecast, by Application 2020 & 2033
- Table 3: Global Engineered Wood Industry Revenue million Forecast, by Region 2020 & 2033
- Table 4: Global Engineered Wood Industry Revenue million Forecast, by Type 2020 & 2033
- Table 5: Global Engineered Wood Industry Revenue million Forecast, by Application 2020 & 2033
- Table 6: Global Engineered Wood Industry Revenue million Forecast, by Country 2020 & 2033
- Table 7: China Engineered Wood Industry Revenue (million) Forecast, by Application 2020 & 2033
- Table 8: India Engineered Wood Industry Revenue (million) Forecast, by Application 2020 & 2033
- Table 9: Japan Engineered Wood Industry Revenue (million) Forecast, by Application 2020 & 2033
- Table 10: South Korea Engineered Wood Industry Revenue (million) Forecast, by Application 2020 & 2033
- Table 11: Malaysia Engineered Wood Industry Revenue (million) Forecast, by Application 2020 & 2033
- Table 12: Thailand Engineered Wood Industry Revenue (million) Forecast, by Application 2020 & 2033
- Table 13: Indonesia Engineered Wood Industry Revenue (million) Forecast, by Application 2020 & 2033
- Table 14: Vietnam Engineered Wood Industry Revenue (million) Forecast, by Application 2020 & 2033
- Table 15: Rest of Asia Pacific Engineered Wood Industry Revenue (million) Forecast, by Application 2020 & 2033
- Table 16: Global Engineered Wood Industry Revenue million Forecast, by Type 2020 & 2033
- Table 17: Global Engineered Wood Industry Revenue million Forecast, by Application 2020 & 2033
- Table 18: Global Engineered Wood Industry Revenue million Forecast, by Country 2020 & 2033
- Table 19: United States Engineered Wood Industry Revenue (million) Forecast, by Application 2020 & 2033
- Table 20: Canada Engineered Wood Industry Revenue (million) Forecast, by Application 2020 & 2033
- Table 21: Mexico Engineered Wood Industry Revenue (million) Forecast, by Application 2020 & 2033
- Table 22: Global Engineered Wood Industry Revenue million Forecast, by Type 2020 & 2033
- Table 23: Global Engineered Wood Industry Revenue million Forecast, by Application 2020 & 2033
- Table 24: Global Engineered Wood Industry Revenue million Forecast, by Country 2020 & 2033
- Table 25: Germany Engineered Wood Industry Revenue (million) Forecast, by Application 2020 & 2033
- Table 26: United Kingdom Engineered Wood Industry Revenue (million) Forecast, by Application 2020 & 2033
- Table 27: France Engineered Wood Industry Revenue (million) Forecast, by Application 2020 & 2033
- Table 28: Italy Engineered Wood Industry Revenue (million) Forecast, by Application 2020 & 2033
- Table 29: Spain Engineered Wood Industry Revenue (million) Forecast, by Application 2020 & 2033
- Table 30: Turkey Engineered Wood Industry Revenue (million) Forecast, by Application 2020 & 2033
- Table 31: Russia Engineered Wood Industry Revenue (million) Forecast, by Application 2020 & 2033
- Table 32: NORDIC Countries Engineered Wood Industry Revenue (million) Forecast, by Application 2020 & 2033
- Table 33: Rest of Europe Engineered Wood Industry Revenue (million) Forecast, by Application 2020 & 2033
- Table 34: Global Engineered Wood Industry Revenue million Forecast, by Type 2020 & 2033
- Table 35: Global Engineered Wood Industry Revenue million Forecast, by Application 2020 & 2033
- Table 36: Global Engineered Wood Industry Revenue million Forecast, by Country 2020 & 2033
- Table 37: Brazil Engineered Wood Industry Revenue (million) Forecast, by Application 2020 & 2033
- Table 38: Argentina Engineered Wood Industry Revenue (million) Forecast, by Application 2020 & 2033
- Table 39: Colombia Engineered Wood Industry Revenue (million) Forecast, by Application 2020 & 2033
- Table 40: Rest of South America Engineered Wood Industry Revenue (million) Forecast, by Application 2020 & 2033
- Table 41: Global Engineered Wood Industry Revenue million Forecast, by Type 2020 & 2033
- Table 42: Global Engineered Wood Industry Revenue million Forecast, by Application 2020 & 2033
- Table 43: Global Engineered Wood Industry Revenue million Forecast, by Country 2020 & 2033
- Table 44: Saudi Arabia Engineered Wood Industry Revenue (million) Forecast, by Application 2020 & 2033
- Table 45: Nigeria Engineered Wood Industry Revenue (million) Forecast, by Application 2020 & 2033
- Table 46: Qatar Engineered Wood Industry Revenue (million) Forecast, by Application 2020 & 2033
- Table 47: Egypt Engineered Wood Industry Revenue (million) Forecast, by Application 2020 & 2033
- Table 48: United Arab Emirates Engineered Wood Industry Revenue (million) Forecast, by Application 2020 & 2033
- Table 49: South Africa Engineered Wood Industry Revenue (million) Forecast, by Application 2020 & 2033
- Table 50: Rest of Middle East and Africa Engineered Wood Industry Revenue (million) Forecast, by Application 2020 & 2033
Frequently Asked Questions
1. What is the projected Compound Annual Growth Rate (CAGR) of the Engineered Wood Industry?
The projected CAGR is approximately 4.88%.
2. Which companies are prominent players in the Engineered Wood Industry?
Key companies in the market include Binderholz GmbH, Boise Cascade, Georgia-Pacific (Georgia-Pacific Wood Products LLC), HASSLACHER Holding GmbH, Havwoods India Pvt Ltd, Huber Engineered Woods LLC, KLH Massivholz Wiesenau GmbH, Kronoplus Limited, Louisiana-Pacific Corporation, Mayr-Melnhof Holz Holding AG, Nordic Structures, Pacific Woodtech Corporation, Resolute Forest Products, Roseburg, Stora Enso, West Fraser, Weyerhaeuser Company*List Not Exhaustive.
3. What are the main segments of the Engineered Wood Industry?
The market segments include Type, Application.
4. Can you provide details about the market size?
The market size is estimated to be USD 299.11 million as of 2022.
5. What are some drivers contributing to market growth?
Growing Demand from the Non-residential Sector; Increasing Use of Cross-laminated Timber (CLT) as Construction Materials; Other Opportunities.
6. What are the notable trends driving market growth?
The Residential Segment to Dominate the Market.
7. Are there any restraints impacting market growth?
Growing Demand from the Non-residential Sector; Increasing Use of Cross-laminated Timber (CLT) as Construction Materials; Other Opportunities.
8. Can you provide examples of recent developments in the market?
December 2022: Boise Cascade expanded distribution centers in two new markets by acquiring 45 acres in Walterboro, SC, and purchasing a 34-acre land parcel in Hondo, Texas.October 2022: Boise Cascade announced the expansion of its distribution center through the acquisition of 4.67 acres of land adjacent to its Albuquerque, New Mexico branch.
9. What pricing options are available for accessing the report?
Pricing options include single-user, multi-user, and enterprise licenses priced at USD 4750, USD 5250, and USD 8750 respectively.
10. Is the market size provided in terms of value or volume?
The market size is provided in terms of value, measured in million.
11. Are there any specific market keywords associated with the report?
Yes, the market keyword associated with the report is "Engineered Wood Industry," which aids in identifying and referencing the specific market segment covered.
12. How do I determine which pricing option suits my needs best?
The pricing options vary based on user requirements and access needs. Individual users may opt for single-user licenses, while businesses requiring broader access may choose multi-user or enterprise licenses for cost-effective access to the report.
13. Are there any additional resources or data provided in the Engineered Wood Industry report?
While the report offers comprehensive insights, it's advisable to review the specific contents or supplementary materials provided to ascertain if additional resources or data are available.
14. How can I stay updated on further developments or reports in the Engineered Wood Industry?
To stay informed about further developments, trends, and reports in the Engineered Wood Industry, consider subscribing to industry newsletters, following relevant companies and organizations, or regularly checking reputable industry news sources and publications.
Methodology
Step 1 - Identification of Relevant Samples Size from Population Database


Step 2 - Approaches for Defining Global Market Size (Value, Volume* & Price*)

Note*: In applicable scenarios
Step 3 - Data Sources
Primary Research
- Web Analytics
- Survey Reports
- Research Institute
- Latest Research Reports
- Opinion Leaders
Secondary Research
- Annual Reports
- White Paper
- Latest Press Release
- Industry Association
- Paid Database
- Investor Presentations

Step 4 - Data Triangulation
Involves using different sources of information in order to increase the validity of a study
These sources are likely to be stakeholders in a program - participants, other researchers, program staff, other community members, and so on.
Then we put all data in single framework & apply various statistical tools to find out the dynamic on the market.
During the analysis stage, feedback from the stakeholder groups would be compared to determine areas of agreement as well as areas of divergence