

Key Insights
The global epoxy composite market is projected to reach $35.04 billion by 2025, with a robust Compound Annual Growth Rate (CAGR) of 7.1%. This significant expansion is propelled by the escalating demand for high-strength, lightweight materials across key sectors including aerospace & defense, automotive & transportation, and wind energy. The inherent advantages of epoxy composites, such as exceptional durability, superior corrosion resistance, and enhanced design flexibility, further solidify their market position. Emerging trends, including the adoption of advanced manufacturing techniques like automated fiber placement (AFP) and the development of next-generation epoxy resins, are actively shaping the market's trajectory. However, fluctuating raw material prices and environmental considerations present ongoing challenges.
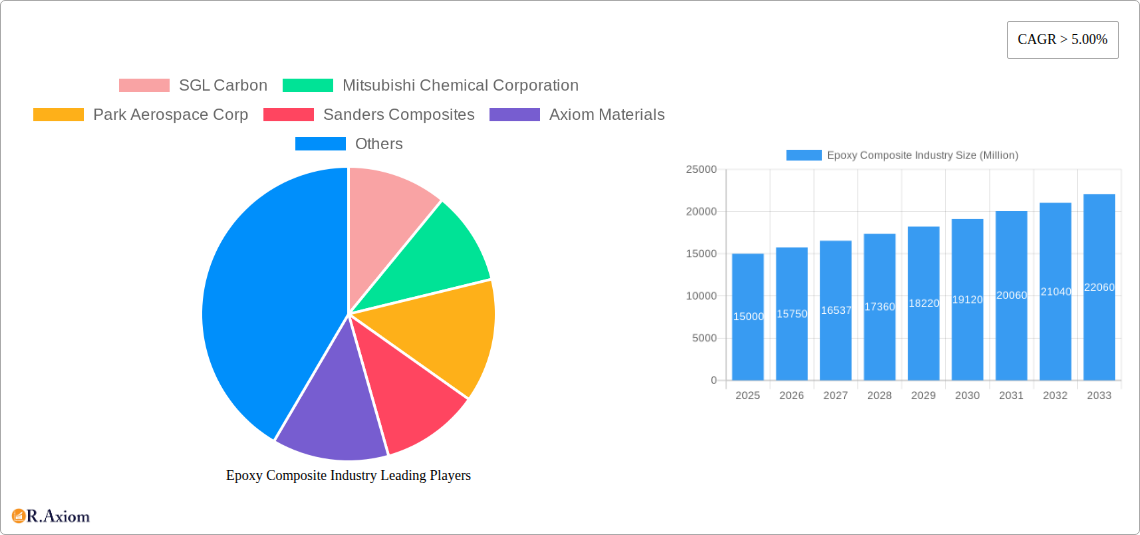
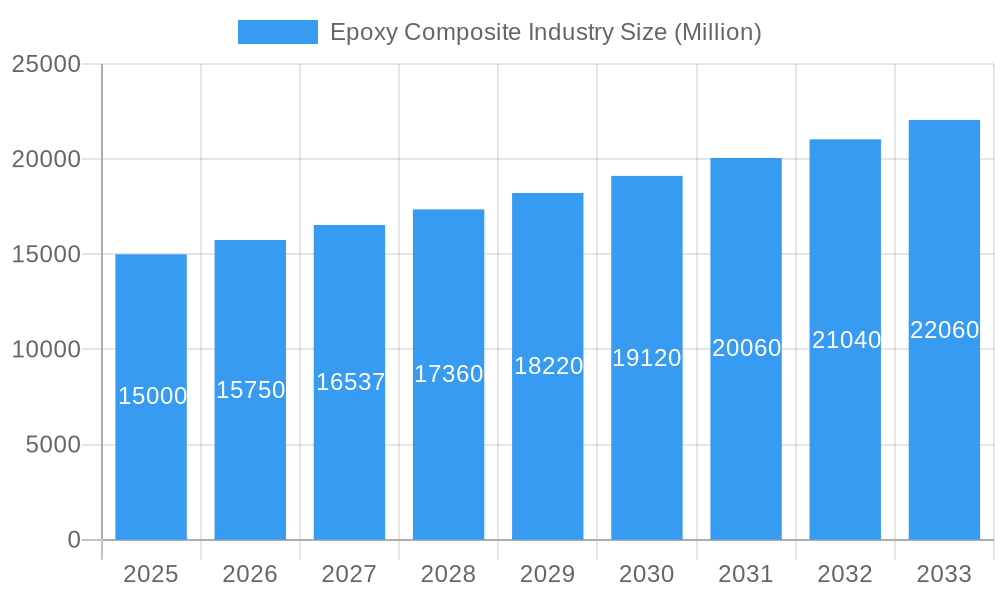
Epoxy Composite Industry Market Size (In Billion)
Segmentation analysis highlights the strong demand for cost-effective glass fiber-reinforced epoxy composites, while carbon fiber composites are increasingly favored for high-performance applications, particularly in the aerospace and automotive industries. The Asia Pacific region is anticipated to lead growth, driven by rapid industrialization and infrastructure development in countries like China and India. Leading industry players are actively pursuing innovation and market expansion through strategic collaborations and technological advancements.
Epoxy Composite Industry Company Market Share
The forecast period (2025-2033) indicates sustained market expansion, fueled by continuous technological innovation and broadening applications. The automotive and aerospace sectors are poised for substantial growth, driven by stringent fuel efficiency regulations and the need for lighter, more robust aircraft components. The wind energy sector will also be a significant contributor, supporting the global shift towards renewable energy. While material cost volatility and environmental concerns persist, ongoing research and development into sustainable and cost-effective epoxy composite solutions are expected to address these issues. The competitive landscape will continue to evolve, with established players focusing on product diversification and emerging market penetration, alongside new entrants targeting niche applications and pioneering material development.
Epoxy Composite Industry: A Comprehensive Market Report (2019-2033)
This in-depth report provides a comprehensive analysis of the Epoxy Composite Industry, offering crucial insights for stakeholders seeking to understand market dynamics, growth drivers, and future trends. The report covers the period from 2019 to 2033, with 2025 serving as the base and estimated year. The analysis encompasses market size, segmentation, competitive landscape, technological advancements, and key industry developments. With a projected market value exceeding xx Million by 2033, this report is an invaluable resource for strategic decision-making.
Epoxy Composite Industry Market Concentration & Innovation
The Epoxy Composite Industry exhibits a moderately concentrated market structure, with key players like SGL Carbon, Mitsubishi Chemical Corporation, and Hexcel Corporation holding significant market share. However, the presence of several smaller, specialized players contributes to a dynamic competitive landscape. Market share data from 2024 suggests that the top 5 players account for approximately xx% of the global market. Innovation is driven by the continuous development of high-performance materials with improved mechanical properties, thermal stability, and resistance to environmental factors. Stricter environmental regulations, particularly concerning volatile organic compounds (VOCs) in epoxy resins, are pushing innovation toward more sustainable alternatives. Product substitution is a growing concern, with alternative materials like carbon fiber-reinforced polymers (CFRP) and other advanced composites challenging the dominance of epoxy composites in specific applications. End-user trends, such as the increasing demand for lightweight and high-strength materials in the aerospace and automotive sectors, are significant drivers of industry growth. Recent M&A activities, totaling an estimated xx Million in deal value in 2024, indicate a consolidation trend within the industry.
- Key Metrics: Top 5 players market share: xx%; Total M&A deal value (2024): xx Million.
- Innovation Drivers: Sustainability concerns, demand for high-performance materials, regulatory pressures.
- Competitive Dynamics: Consolidation through M&A, ongoing competition from alternative materials.
Epoxy Composite Industry Industry Trends & Insights
The Epoxy Composite Industry is experiencing robust growth, driven by increasing demand across various end-user sectors. The market is projected to achieve a Compound Annual Growth Rate (CAGR) of xx% during the forecast period (2025-2033). This growth is fueled by several factors, including the rising adoption of lightweight materials in the automotive and aerospace industries to improve fuel efficiency and reduce emissions. Technological advancements, such as the development of advanced resin systems with enhanced properties and the use of automated manufacturing processes, are further accelerating market expansion. Consumer preferences for durable, high-performance products are also contributing to the industry's growth. The competitive landscape is characterized by intense competition among established players and emerging entrants. Market penetration of epoxy composites is high in certain niche applications, such as aerospace and high-end sporting goods, while opportunities remain for expansion in other sectors.
Dominant Markets & Segments in Epoxy Composite Industry
The Aerospace & Defence sector represents the dominant end-user industry for epoxy composites, accounting for approximately xx% of the total market value in 2024. This is driven by the stringent requirements for lightweight, high-strength materials in aircraft and defense applications. Within fiber types, carbon fiber epoxy composites hold a significant share due to their superior mechanical properties. Geographically, North America and Europe are currently the leading regions for epoxy composite consumption, primarily due to established aerospace and automotive industries.
- Key Drivers for Aerospace & Defence: Stringent lightweighting requirements, high performance demands, government investments.
- Key Drivers for North America and Europe: Established manufacturing base, strong aerospace and automotive sectors.
- Dominant Fiber Type: Carbon Fiber.
- Dominant End-User: Aerospace & Defence.
Epoxy Composite Industry Product Developments
Recent product developments focus on enhancing the mechanical properties, durability, and sustainability of epoxy composites. Innovations include the introduction of bio-based epoxy resins, self-healing composites, and advanced manufacturing techniques like 3D printing. These innovations aim to improve performance characteristics, reduce costs, and address environmental concerns. The market fit for these new products is strong in high-value applications requiring enhanced performance or environmentally friendly solutions.
Report Scope & Segmentation Analysis
This report segments the Epoxy Composite Industry by fiber type (Glass, Carbon, Others) and end-user industry (Aerospace & Defence, Automotive & Transportation, Electrical & Electronics, Wind Energy, Sporting Goods, Others). Each segment's growth projections, market size, and competitive dynamics are comprehensively analyzed, offering insights into specific market opportunities. The detailed segmentation allows for a granular understanding of the market and its various segments' growth potential.
Key Drivers of Epoxy Composite Industry Growth
The growth of the Epoxy Composite Industry is driven by several key factors: increasing demand for lightweight materials in various industries, advancements in material science leading to enhanced performance characteristics, and the rising adoption of automation in manufacturing. Government regulations promoting fuel efficiency and emission reduction further boost the market.
Challenges in the Epoxy Composite Industry Sector
The Epoxy Composite Industry faces challenges such as volatile raw material prices, potential supply chain disruptions, and intense competition from alternative materials. Stringent regulatory requirements related to environmental sustainability also pose hurdles. These factors can affect profitability and growth, demanding strategic adjustments from industry players.
Emerging Opportunities in Epoxy Composite Industry
Emerging opportunities lie in the expansion into new applications like 3D printing, the development of bio-based epoxy resins, and advancements in recyclable composites. Exploring new markets, such as renewable energy and construction, also presents significant potential.
Leading Players in the Epoxy Composite Industry Market
- SGL Carbon
- Mitsubishi Chemical Corporation
- Park Aerospace Corp
- Sanders Composites
- Axiom Materials
- Barrday
- Veplas d d
- Hexcel Corporation
Key Developments in Epoxy Composite Industry Industry
- 2024 Q4: Hexcel Corporation announced a significant investment in expanding its carbon fiber production capacity.
- 2023 Q3: Mitsubishi Chemical Corporation launched a new line of bio-based epoxy resins.
- 2022 Q1: SGL Carbon acquired a smaller composite manufacturer, expanding its market reach.
Strategic Outlook for Epoxy Composite Industry Market
The Epoxy Composite Industry is poised for sustained growth, driven by technological advancements, increasing demand from key end-user sectors, and the growing adoption of sustainable solutions. Opportunities abound for companies that can innovate, optimize their supply chains, and effectively target key markets. The market's future trajectory hinges on continuous innovation and adaptation to evolving industry demands.
Epoxy Composite Industry Segmentation
-
1. Fiber Type
- 1.1. Glass
- 1.2. Carbon
- 1.3. Other Fiber Types
-
2. End-user Industry
- 2.1. Aerospace and Defense
- 2.2. Automotive and Transportation
- 2.3. Electrical and Electronics
- 2.4. Wind Energy
- 2.5. Sporting Goods
- 2.6. Other End-user Industries
Epoxy Composite Industry Segmentation By Geography
-
1. Asia Pacific
- 1.1. China
- 1.2. India
- 1.3. Japan
- 1.4. South Korea
- 1.5. Malaysia
- 1.6. Thailand
- 1.7. Indonesia
- 1.8. Vietnam
- 1.9. Rest of Asia Pacific
-
2. North America
- 2.1. United States
- 2.2. Canada
- 2.3. Mexico
-
3. Europe
- 3.1. Germany
- 3.2. United Kingdom
- 3.3. Italy
- 3.4. France
- 3.5. Spain
- 3.6. NORDIC Countries
- 3.7. Turkey
- 3.8. Russia
- 3.9. Rest of Europe
-
4. South America
- 4.1. Brazil
- 4.2. Argentina
- 4.3. Colombia
- 4.4. Rest of South America
-
5. Middle East and Africa
- 5.1. Saudi Arabia
- 5.2. South Africa
- 5.3. Nigeria
- 5.4. Qatar
- 5.5. Egypt
- 5.6. United Arab Emirates
- 5.7. Rest of Middle East and Africa
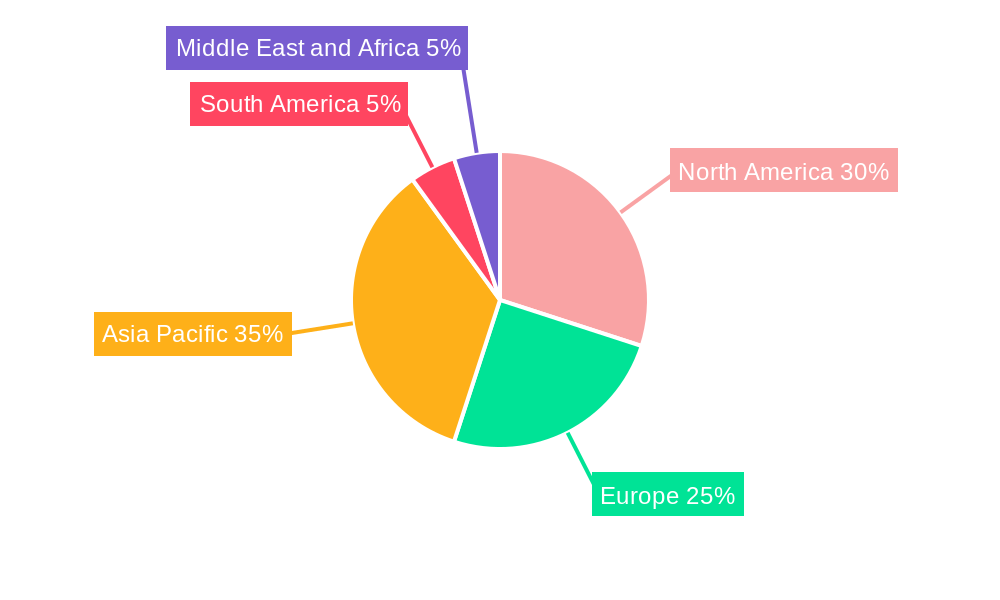
Epoxy Composite Industry Regional Market Share
Geographic Coverage of Epoxy Composite Industry
Epoxy Composite Industry REPORT HIGHLIGHTS
| Aspects | Details |
|---|---|
| Study Period | 2020-2034 |
| Base Year | 2025 |
| Estimated Year | 2026 |
| Forecast Period | 2026-2034 |
| Historical Period | 2020-2025 |
| Growth Rate | CAGR of 7.1% from 2020-2034 |
| Segmentation |
|
Table of Contents
- 1. Introduction
- 1.1. Research Scope
- 1.2. Market Segmentation
- 1.3. Research Objective
- 1.4. Definitions and Assumptions
- 2. Executive Summary
- 2.1. Market Snapshot
- 3. Market Dynamics
- 3.1. Market Drivers
- 3.2. Market Restrains
- 3.3. Market Trends
- 3.4. Market Opportunities
- 4. Market Factor Analysis
- 4.1. Porters Five Forces
- 4.1.1. Bargaining Power of Suppliers
- 4.1.2. Bargaining Power of Buyers
- 4.1.3. Threat of New Entrants
- 4.1.4. Threat of Substitutes
- 4.1.5. Competitive Rivalry
- 4.2. PESTEL analysis
- 4.3. BCG Analysis
- 4.3.1. Stars (High Growth, High Market Share)
- 4.3.2. Cash Cows (Low Growth, High Market Share)
- 4.3.3. Question Mark (High Growth, Low Market Share)
- 4.3.4. Dogs (Low Growth, Low Market Share)
- 4.4. Ansoff Matrix Analysis
- 4.5. Supply Chain Analysis
- 4.6. Regulatory Landscape
- 4.7. Current Market Potential and Opportunity Assessment (TAM–SAM–SOM Framework)
- 4.8. RAX Analyst Note
- 4.1. Porters Five Forces
- 5. Market Analysis, Insights and Forecast 2021-2033
- 5.1. Market Analysis, Insights and Forecast - by Fiber Type
- 5.1.1. Glass
- 5.1.2. Carbon
- 5.1.3. Other Fiber Types
- 5.2. Market Analysis, Insights and Forecast - by End-user Industry
- 5.2.1. Aerospace and Defense
- 5.2.2. Automotive and Transportation
- 5.2.3. Electrical and Electronics
- 5.2.4. Wind Energy
- 5.2.5. Sporting Goods
- 5.2.6. Other End-user Industries
- 5.3. Market Analysis, Insights and Forecast - by Region
- 5.3.1. Asia Pacific
- 5.3.2. North America
- 5.3.3. Europe
- 5.3.4. South America
- 5.3.5. Middle East and Africa
- 5.1. Market Analysis, Insights and Forecast - by Fiber Type
- 6. Global Epoxy Composite Industry Analysis, Insights and Forecast, 2021-2033
- 6.1. Market Analysis, Insights and Forecast - by Fiber Type
- 6.1.1. Glass
- 6.1.2. Carbon
- 6.1.3. Other Fiber Types
- 6.2. Market Analysis, Insights and Forecast - by End-user Industry
- 6.2.1. Aerospace and Defense
- 6.2.2. Automotive and Transportation
- 6.2.3. Electrical and Electronics
- 6.2.4. Wind Energy
- 6.2.5. Sporting Goods
- 6.2.6. Other End-user Industries
- 6.1. Market Analysis, Insights and Forecast - by Fiber Type
- 7. Asia Pacific Epoxy Composite Industry Analysis, Insights and Forecast, 2020-2032
- 7.1. Market Analysis, Insights and Forecast - by Fiber Type
- 7.1.1. Glass
- 7.1.2. Carbon
- 7.1.3. Other Fiber Types
- 7.2. Market Analysis, Insights and Forecast - by End-user Industry
- 7.2.1. Aerospace and Defense
- 7.2.2. Automotive and Transportation
- 7.2.3. Electrical and Electronics
- 7.2.4. Wind Energy
- 7.2.5. Sporting Goods
- 7.2.6. Other End-user Industries
- 7.1. Market Analysis, Insights and Forecast - by Fiber Type
- 8. North America Epoxy Composite Industry Analysis, Insights and Forecast, 2020-2032
- 8.1. Market Analysis, Insights and Forecast - by Fiber Type
- 8.1.1. Glass
- 8.1.2. Carbon
- 8.1.3. Other Fiber Types
- 8.2. Market Analysis, Insights and Forecast - by End-user Industry
- 8.2.1. Aerospace and Defense
- 8.2.2. Automotive and Transportation
- 8.2.3. Electrical and Electronics
- 8.2.4. Wind Energy
- 8.2.5. Sporting Goods
- 8.2.6. Other End-user Industries
- 8.1. Market Analysis, Insights and Forecast - by Fiber Type
- 9. Europe Epoxy Composite Industry Analysis, Insights and Forecast, 2020-2032
- 9.1. Market Analysis, Insights and Forecast - by Fiber Type
- 9.1.1. Glass
- 9.1.2. Carbon
- 9.1.3. Other Fiber Types
- 9.2. Market Analysis, Insights and Forecast - by End-user Industry
- 9.2.1. Aerospace and Defense
- 9.2.2. Automotive and Transportation
- 9.2.3. Electrical and Electronics
- 9.2.4. Wind Energy
- 9.2.5. Sporting Goods
- 9.2.6. Other End-user Industries
- 9.1. Market Analysis, Insights and Forecast - by Fiber Type
- 10. South America Epoxy Composite Industry Analysis, Insights and Forecast, 2020-2032
- 10.1. Market Analysis, Insights and Forecast - by Fiber Type
- 10.1.1. Glass
- 10.1.2. Carbon
- 10.1.3. Other Fiber Types
- 10.2. Market Analysis, Insights and Forecast - by End-user Industry
- 10.2.1. Aerospace and Defense
- 10.2.2. Automotive and Transportation
- 10.2.3. Electrical and Electronics
- 10.2.4. Wind Energy
- 10.2.5. Sporting Goods
- 10.2.6. Other End-user Industries
- 10.1. Market Analysis, Insights and Forecast - by Fiber Type
- 11. Middle East and Africa Epoxy Composite Industry Analysis, Insights and Forecast, 2020-2032
- 11.1. Market Analysis, Insights and Forecast - by Fiber Type
- 11.1.1. Glass
- 11.1.2. Carbon
- 11.1.3. Other Fiber Types
- 11.2. Market Analysis, Insights and Forecast - by End-user Industry
- 11.2.1. Aerospace and Defense
- 11.2.2. Automotive and Transportation
- 11.2.3. Electrical and Electronics
- 11.2.4. Wind Energy
- 11.2.5. Sporting Goods
- 11.2.6. Other End-user Industries
- 11.1. Market Analysis, Insights and Forecast - by Fiber Type
- 12. Competitive Analysis
- 12.1. Company Profiles
- 12.1.1 SGL Carbon
- 12.1.1.1. Company Overview
- 12.1.1.2. Products
- 12.1.1.3. Company Financials
- 12.1.1.4. SWOT Analysis
- 12.1.2 Mitsubishi Chemical Corporation
- 12.1.2.1. Company Overview
- 12.1.2.2. Products
- 12.1.2.3. Company Financials
- 12.1.2.4. SWOT Analysis
- 12.1.3 Park Aerospace Corp
- 12.1.3.1. Company Overview
- 12.1.3.2. Products
- 12.1.3.3. Company Financials
- 12.1.3.4. SWOT Analysis
- 12.1.4 Sanders Composites
- 12.1.4.1. Company Overview
- 12.1.4.2. Products
- 12.1.4.3. Company Financials
- 12.1.4.4. SWOT Analysis
- 12.1.5 Axiom Materials
- 12.1.5.1. Company Overview
- 12.1.5.2. Products
- 12.1.5.3. Company Financials
- 12.1.5.4. SWOT Analysis
- 12.1.6 Barrday
- 12.1.6.1. Company Overview
- 12.1.6.2. Products
- 12.1.6.3. Company Financials
- 12.1.6.4. SWOT Analysis
- 12.1.7 Veplas d d
- 12.1.7.1. Company Overview
- 12.1.7.2. Products
- 12.1.7.3. Company Financials
- 12.1.7.4. SWOT Analysis
- 12.1.8 Hexcel Corporation
- 12.1.8.1. Company Overview
- 12.1.8.2. Products
- 12.1.8.3. Company Financials
- 12.1.8.4. SWOT Analysis
- 12.1.1 SGL Carbon
- 12.2. Market Entropy
- 12.2.1 Company's Key Areas Served
- 12.2.2 Recent Developments
- 12.3. Company Market Share Analysis 2025
- 12.3.1 Top 5 Companies Market Share Analysis
- 12.3.2 Top 3 Companies Market Share Analysis
- 12.4. List of Potential Customers
- 13. Research Methodology
List of Figures
- Figure 1: Global Epoxy Composite Industry Revenue Breakdown (billion, %) by Region 2025 & 2033
- Figure 2: Global Epoxy Composite Industry Volume Breakdown (K Tons, %) by Region 2025 & 2033
- Figure 3: Asia Pacific Epoxy Composite Industry Revenue (billion), by Fiber Type 2025 & 2033
- Figure 4: Asia Pacific Epoxy Composite Industry Volume (K Tons), by Fiber Type 2025 & 2033
- Figure 5: Asia Pacific Epoxy Composite Industry Revenue Share (%), by Fiber Type 2025 & 2033
- Figure 6: Asia Pacific Epoxy Composite Industry Volume Share (%), by Fiber Type 2025 & 2033
- Figure 7: Asia Pacific Epoxy Composite Industry Revenue (billion), by End-user Industry 2025 & 2033
- Figure 8: Asia Pacific Epoxy Composite Industry Volume (K Tons), by End-user Industry 2025 & 2033
- Figure 9: Asia Pacific Epoxy Composite Industry Revenue Share (%), by End-user Industry 2025 & 2033
- Figure 10: Asia Pacific Epoxy Composite Industry Volume Share (%), by End-user Industry 2025 & 2033
- Figure 11: Asia Pacific Epoxy Composite Industry Revenue (billion), by Country 2025 & 2033
- Figure 12: Asia Pacific Epoxy Composite Industry Volume (K Tons), by Country 2025 & 2033
- Figure 13: Asia Pacific Epoxy Composite Industry Revenue Share (%), by Country 2025 & 2033
- Figure 14: Asia Pacific Epoxy Composite Industry Volume Share (%), by Country 2025 & 2033
- Figure 15: North America Epoxy Composite Industry Revenue (billion), by Fiber Type 2025 & 2033
- Figure 16: North America Epoxy Composite Industry Volume (K Tons), by Fiber Type 2025 & 2033
- Figure 17: North America Epoxy Composite Industry Revenue Share (%), by Fiber Type 2025 & 2033
- Figure 18: North America Epoxy Composite Industry Volume Share (%), by Fiber Type 2025 & 2033
- Figure 19: North America Epoxy Composite Industry Revenue (billion), by End-user Industry 2025 & 2033
- Figure 20: North America Epoxy Composite Industry Volume (K Tons), by End-user Industry 2025 & 2033
- Figure 21: North America Epoxy Composite Industry Revenue Share (%), by End-user Industry 2025 & 2033
- Figure 22: North America Epoxy Composite Industry Volume Share (%), by End-user Industry 2025 & 2033
- Figure 23: North America Epoxy Composite Industry Revenue (billion), by Country 2025 & 2033
- Figure 24: North America Epoxy Composite Industry Volume (K Tons), by Country 2025 & 2033
- Figure 25: North America Epoxy Composite Industry Revenue Share (%), by Country 2025 & 2033
- Figure 26: North America Epoxy Composite Industry Volume Share (%), by Country 2025 & 2033
- Figure 27: Europe Epoxy Composite Industry Revenue (billion), by Fiber Type 2025 & 2033
- Figure 28: Europe Epoxy Composite Industry Volume (K Tons), by Fiber Type 2025 & 2033
- Figure 29: Europe Epoxy Composite Industry Revenue Share (%), by Fiber Type 2025 & 2033
- Figure 30: Europe Epoxy Composite Industry Volume Share (%), by Fiber Type 2025 & 2033
- Figure 31: Europe Epoxy Composite Industry Revenue (billion), by End-user Industry 2025 & 2033
- Figure 32: Europe Epoxy Composite Industry Volume (K Tons), by End-user Industry 2025 & 2033
- Figure 33: Europe Epoxy Composite Industry Revenue Share (%), by End-user Industry 2025 & 2033
- Figure 34: Europe Epoxy Composite Industry Volume Share (%), by End-user Industry 2025 & 2033
- Figure 35: Europe Epoxy Composite Industry Revenue (billion), by Country 2025 & 2033
- Figure 36: Europe Epoxy Composite Industry Volume (K Tons), by Country 2025 & 2033
- Figure 37: Europe Epoxy Composite Industry Revenue Share (%), by Country 2025 & 2033
- Figure 38: Europe Epoxy Composite Industry Volume Share (%), by Country 2025 & 2033
- Figure 39: South America Epoxy Composite Industry Revenue (billion), by Fiber Type 2025 & 2033
- Figure 40: South America Epoxy Composite Industry Volume (K Tons), by Fiber Type 2025 & 2033
- Figure 41: South America Epoxy Composite Industry Revenue Share (%), by Fiber Type 2025 & 2033
- Figure 42: South America Epoxy Composite Industry Volume Share (%), by Fiber Type 2025 & 2033
- Figure 43: South America Epoxy Composite Industry Revenue (billion), by End-user Industry 2025 & 2033
- Figure 44: South America Epoxy Composite Industry Volume (K Tons), by End-user Industry 2025 & 2033
- Figure 45: South America Epoxy Composite Industry Revenue Share (%), by End-user Industry 2025 & 2033
- Figure 46: South America Epoxy Composite Industry Volume Share (%), by End-user Industry 2025 & 2033
- Figure 47: South America Epoxy Composite Industry Revenue (billion), by Country 2025 & 2033
- Figure 48: South America Epoxy Composite Industry Volume (K Tons), by Country 2025 & 2033
- Figure 49: South America Epoxy Composite Industry Revenue Share (%), by Country 2025 & 2033
- Figure 50: South America Epoxy Composite Industry Volume Share (%), by Country 2025 & 2033
- Figure 51: Middle East and Africa Epoxy Composite Industry Revenue (billion), by Fiber Type 2025 & 2033
- Figure 52: Middle East and Africa Epoxy Composite Industry Volume (K Tons), by Fiber Type 2025 & 2033
- Figure 53: Middle East and Africa Epoxy Composite Industry Revenue Share (%), by Fiber Type 2025 & 2033
- Figure 54: Middle East and Africa Epoxy Composite Industry Volume Share (%), by Fiber Type 2025 & 2033
- Figure 55: Middle East and Africa Epoxy Composite Industry Revenue (billion), by End-user Industry 2025 & 2033
- Figure 56: Middle East and Africa Epoxy Composite Industry Volume (K Tons), by End-user Industry 2025 & 2033
- Figure 57: Middle East and Africa Epoxy Composite Industry Revenue Share (%), by End-user Industry 2025 & 2033
- Figure 58: Middle East and Africa Epoxy Composite Industry Volume Share (%), by End-user Industry 2025 & 2033
- Figure 59: Middle East and Africa Epoxy Composite Industry Revenue (billion), by Country 2025 & 2033
- Figure 60: Middle East and Africa Epoxy Composite Industry Volume (K Tons), by Country 2025 & 2033
- Figure 61: Middle East and Africa Epoxy Composite Industry Revenue Share (%), by Country 2025 & 2033
- Figure 62: Middle East and Africa Epoxy Composite Industry Volume Share (%), by Country 2025 & 2033
List of Tables
- Table 1: Global Epoxy Composite Industry Revenue billion Forecast, by Fiber Type 2020 & 2033
- Table 2: Global Epoxy Composite Industry Volume K Tons Forecast, by Fiber Type 2020 & 2033
- Table 3: Global Epoxy Composite Industry Revenue billion Forecast, by End-user Industry 2020 & 2033
- Table 4: Global Epoxy Composite Industry Volume K Tons Forecast, by End-user Industry 2020 & 2033
- Table 5: Global Epoxy Composite Industry Revenue billion Forecast, by Region 2020 & 2033
- Table 6: Global Epoxy Composite Industry Volume K Tons Forecast, by Region 2020 & 2033
- Table 7: Global Epoxy Composite Industry Revenue billion Forecast, by Fiber Type 2020 & 2033
- Table 8: Global Epoxy Composite Industry Volume K Tons Forecast, by Fiber Type 2020 & 2033
- Table 9: Global Epoxy Composite Industry Revenue billion Forecast, by End-user Industry 2020 & 2033
- Table 10: Global Epoxy Composite Industry Volume K Tons Forecast, by End-user Industry 2020 & 2033
- Table 11: Global Epoxy Composite Industry Revenue billion Forecast, by Country 2020 & 2033
- Table 12: Global Epoxy Composite Industry Volume K Tons Forecast, by Country 2020 & 2033
- Table 13: China Epoxy Composite Industry Revenue (billion) Forecast, by Application 2020 & 2033
- Table 14: China Epoxy Composite Industry Volume (K Tons) Forecast, by Application 2020 & 2033
- Table 15: India Epoxy Composite Industry Revenue (billion) Forecast, by Application 2020 & 2033
- Table 16: India Epoxy Composite Industry Volume (K Tons) Forecast, by Application 2020 & 2033
- Table 17: Japan Epoxy Composite Industry Revenue (billion) Forecast, by Application 2020 & 2033
- Table 18: Japan Epoxy Composite Industry Volume (K Tons) Forecast, by Application 2020 & 2033
- Table 19: South Korea Epoxy Composite Industry Revenue (billion) Forecast, by Application 2020 & 2033
- Table 20: South Korea Epoxy Composite Industry Volume (K Tons) Forecast, by Application 2020 & 2033
- Table 21: Malaysia Epoxy Composite Industry Revenue (billion) Forecast, by Application 2020 & 2033
- Table 22: Malaysia Epoxy Composite Industry Volume (K Tons) Forecast, by Application 2020 & 2033
- Table 23: Thailand Epoxy Composite Industry Revenue (billion) Forecast, by Application 2020 & 2033
- Table 24: Thailand Epoxy Composite Industry Volume (K Tons) Forecast, by Application 2020 & 2033
- Table 25: Indonesia Epoxy Composite Industry Revenue (billion) Forecast, by Application 2020 & 2033
- Table 26: Indonesia Epoxy Composite Industry Volume (K Tons) Forecast, by Application 2020 & 2033
- Table 27: Vietnam Epoxy Composite Industry Revenue (billion) Forecast, by Application 2020 & 2033
- Table 28: Vietnam Epoxy Composite Industry Volume (K Tons) Forecast, by Application 2020 & 2033
- Table 29: Rest of Asia Pacific Epoxy Composite Industry Revenue (billion) Forecast, by Application 2020 & 2033
- Table 30: Rest of Asia Pacific Epoxy Composite Industry Volume (K Tons) Forecast, by Application 2020 & 2033
- Table 31: Global Epoxy Composite Industry Revenue billion Forecast, by Fiber Type 2020 & 2033
- Table 32: Global Epoxy Composite Industry Volume K Tons Forecast, by Fiber Type 2020 & 2033
- Table 33: Global Epoxy Composite Industry Revenue billion Forecast, by End-user Industry 2020 & 2033
- Table 34: Global Epoxy Composite Industry Volume K Tons Forecast, by End-user Industry 2020 & 2033
- Table 35: Global Epoxy Composite Industry Revenue billion Forecast, by Country 2020 & 2033
- Table 36: Global Epoxy Composite Industry Volume K Tons Forecast, by Country 2020 & 2033
- Table 37: United States Epoxy Composite Industry Revenue (billion) Forecast, by Application 2020 & 2033
- Table 38: United States Epoxy Composite Industry Volume (K Tons) Forecast, by Application 2020 & 2033
- Table 39: Canada Epoxy Composite Industry Revenue (billion) Forecast, by Application 2020 & 2033
- Table 40: Canada Epoxy Composite Industry Volume (K Tons) Forecast, by Application 2020 & 2033
- Table 41: Mexico Epoxy Composite Industry Revenue (billion) Forecast, by Application 2020 & 2033
- Table 42: Mexico Epoxy Composite Industry Volume (K Tons) Forecast, by Application 2020 & 2033
- Table 43: Global Epoxy Composite Industry Revenue billion Forecast, by Fiber Type 2020 & 2033
- Table 44: Global Epoxy Composite Industry Volume K Tons Forecast, by Fiber Type 2020 & 2033
- Table 45: Global Epoxy Composite Industry Revenue billion Forecast, by End-user Industry 2020 & 2033
- Table 46: Global Epoxy Composite Industry Volume K Tons Forecast, by End-user Industry 2020 & 2033
- Table 47: Global Epoxy Composite Industry Revenue billion Forecast, by Country 2020 & 2033
- Table 48: Global Epoxy Composite Industry Volume K Tons Forecast, by Country 2020 & 2033
- Table 49: Germany Epoxy Composite Industry Revenue (billion) Forecast, by Application 2020 & 2033
- Table 50: Germany Epoxy Composite Industry Volume (K Tons) Forecast, by Application 2020 & 2033
- Table 51: United Kingdom Epoxy Composite Industry Revenue (billion) Forecast, by Application 2020 & 2033
- Table 52: United Kingdom Epoxy Composite Industry Volume (K Tons) Forecast, by Application 2020 & 2033
- Table 53: Italy Epoxy Composite Industry Revenue (billion) Forecast, by Application 2020 & 2033
- Table 54: Italy Epoxy Composite Industry Volume (K Tons) Forecast, by Application 2020 & 2033
- Table 55: France Epoxy Composite Industry Revenue (billion) Forecast, by Application 2020 & 2033
- Table 56: France Epoxy Composite Industry Volume (K Tons) Forecast, by Application 2020 & 2033
- Table 57: Spain Epoxy Composite Industry Revenue (billion) Forecast, by Application 2020 & 2033
- Table 58: Spain Epoxy Composite Industry Volume (K Tons) Forecast, by Application 2020 & 2033
- Table 59: NORDIC Countries Epoxy Composite Industry Revenue (billion) Forecast, by Application 2020 & 2033
- Table 60: NORDIC Countries Epoxy Composite Industry Volume (K Tons) Forecast, by Application 2020 & 2033
- Table 61: Turkey Epoxy Composite Industry Revenue (billion) Forecast, by Application 2020 & 2033
- Table 62: Turkey Epoxy Composite Industry Volume (K Tons) Forecast, by Application 2020 & 2033
- Table 63: Russia Epoxy Composite Industry Revenue (billion) Forecast, by Application 2020 & 2033
- Table 64: Russia Epoxy Composite Industry Volume (K Tons) Forecast, by Application 2020 & 2033
- Table 65: Rest of Europe Epoxy Composite Industry Revenue (billion) Forecast, by Application 2020 & 2033
- Table 66: Rest of Europe Epoxy Composite Industry Volume (K Tons) Forecast, by Application 2020 & 2033
- Table 67: Global Epoxy Composite Industry Revenue billion Forecast, by Fiber Type 2020 & 2033
- Table 68: Global Epoxy Composite Industry Volume K Tons Forecast, by Fiber Type 2020 & 2033
- Table 69: Global Epoxy Composite Industry Revenue billion Forecast, by End-user Industry 2020 & 2033
- Table 70: Global Epoxy Composite Industry Volume K Tons Forecast, by End-user Industry 2020 & 2033
- Table 71: Global Epoxy Composite Industry Revenue billion Forecast, by Country 2020 & 2033
- Table 72: Global Epoxy Composite Industry Volume K Tons Forecast, by Country 2020 & 2033
- Table 73: Brazil Epoxy Composite Industry Revenue (billion) Forecast, by Application 2020 & 2033
- Table 74: Brazil Epoxy Composite Industry Volume (K Tons) Forecast, by Application 2020 & 2033
- Table 75: Argentina Epoxy Composite Industry Revenue (billion) Forecast, by Application 2020 & 2033
- Table 76: Argentina Epoxy Composite Industry Volume (K Tons) Forecast, by Application 2020 & 2033
- Table 77: Colombia Epoxy Composite Industry Revenue (billion) Forecast, by Application 2020 & 2033
- Table 78: Colombia Epoxy Composite Industry Volume (K Tons) Forecast, by Application 2020 & 2033
- Table 79: Rest of South America Epoxy Composite Industry Revenue (billion) Forecast, by Application 2020 & 2033
- Table 80: Rest of South America Epoxy Composite Industry Volume (K Tons) Forecast, by Application 2020 & 2033
- Table 81: Global Epoxy Composite Industry Revenue billion Forecast, by Fiber Type 2020 & 2033
- Table 82: Global Epoxy Composite Industry Volume K Tons Forecast, by Fiber Type 2020 & 2033
- Table 83: Global Epoxy Composite Industry Revenue billion Forecast, by End-user Industry 2020 & 2033
- Table 84: Global Epoxy Composite Industry Volume K Tons Forecast, by End-user Industry 2020 & 2033
- Table 85: Global Epoxy Composite Industry Revenue billion Forecast, by Country 2020 & 2033
- Table 86: Global Epoxy Composite Industry Volume K Tons Forecast, by Country 2020 & 2033
- Table 87: Saudi Arabia Epoxy Composite Industry Revenue (billion) Forecast, by Application 2020 & 2033
- Table 88: Saudi Arabia Epoxy Composite Industry Volume (K Tons) Forecast, by Application 2020 & 2033
- Table 89: South Africa Epoxy Composite Industry Revenue (billion) Forecast, by Application 2020 & 2033
- Table 90: South Africa Epoxy Composite Industry Volume (K Tons) Forecast, by Application 2020 & 2033
- Table 91: Nigeria Epoxy Composite Industry Revenue (billion) Forecast, by Application 2020 & 2033
- Table 92: Nigeria Epoxy Composite Industry Volume (K Tons) Forecast, by Application 2020 & 2033
- Table 93: Qatar Epoxy Composite Industry Revenue (billion) Forecast, by Application 2020 & 2033
- Table 94: Qatar Epoxy Composite Industry Volume (K Tons) Forecast, by Application 2020 & 2033
- Table 95: Egypt Epoxy Composite Industry Revenue (billion) Forecast, by Application 2020 & 2033
- Table 96: Egypt Epoxy Composite Industry Volume (K Tons) Forecast, by Application 2020 & 2033
- Table 97: United Arab Emirates Epoxy Composite Industry Revenue (billion) Forecast, by Application 2020 & 2033
- Table 98: United Arab Emirates Epoxy Composite Industry Volume (K Tons) Forecast, by Application 2020 & 2033
- Table 99: Rest of Middle East and Africa Epoxy Composite Industry Revenue (billion) Forecast, by Application 2020 & 2033
- Table 100: Rest of Middle East and Africa Epoxy Composite Industry Volume (K Tons) Forecast, by Application 2020 & 2033
Frequently Asked Questions
1. What is the projected Compound Annual Growth Rate (CAGR) of the Epoxy Composite Industry?
The projected CAGR is approximately 7.1%.
2. Which companies are prominent players in the Epoxy Composite Industry?
Key companies in the market include SGL Carbon, Mitsubishi Chemical Corporation, Park Aerospace Corp, Sanders Composites, Axiom Materials, Barrday, Veplas d d , Hexcel Corporation.
3. What are the main segments of the Epoxy Composite Industry?
The market segments include Fiber Type, End-user Industry.
4. Can you provide details about the market size?
The market size is estimated to be USD 35.04 billion as of 2022.
5. What are some drivers contributing to market growth?
Growing Demand from the Wind Energy Sector; Other Drivers.
6. What are the notable trends driving market growth?
Growing Demand from the Aerospace and Defense Industry.
7. Are there any restraints impacting market growth?
Availability of Close Substitutes; Unfavorable Conditions Arising Due to COVID-19 Outbreak.
8. Can you provide examples of recent developments in the market?
N/A
9. What pricing options are available for accessing the report?
Pricing options include single-user, multi-user, and enterprise licenses priced at USD 4750, USD 5250, and USD 8750 respectively.
10. Is the market size provided in terms of value or volume?
The market size is provided in terms of value, measured in billion and volume, measured in K Tons.
11. Are there any specific market keywords associated with the report?
Yes, the market keyword associated with the report is "Epoxy Composite Industry," which aids in identifying and referencing the specific market segment covered.
12. How do I determine which pricing option suits my needs best?
The pricing options vary based on user requirements and access needs. Individual users may opt for single-user licenses, while businesses requiring broader access may choose multi-user or enterprise licenses for cost-effective access to the report.
13. Are there any additional resources or data provided in the Epoxy Composite Industry report?
While the report offers comprehensive insights, it's advisable to review the specific contents or supplementary materials provided to ascertain if additional resources or data are available.
14. How can I stay updated on further developments or reports in the Epoxy Composite Industry?
To stay informed about further developments, trends, and reports in the Epoxy Composite Industry, consider subscribing to industry newsletters, following relevant companies and organizations, or regularly checking reputable industry news sources and publications.
Methodology
Step 1 - Identification of Relevant Samples Size from Population Database


Step 2 - Approaches for Defining Global Market Size (Value, Volume* & Price*)

Note*: In applicable scenarios
Step 3 - Data Sources
Primary Research
- Web Analytics
- Survey Reports
- Research Institute
- Latest Research Reports
- Opinion Leaders
Secondary Research
- Annual Reports
- White Paper
- Latest Press Release
- Industry Association
- Paid Database
- Investor Presentations

Step 4 - Data Triangulation
Involves using different sources of information in order to increase the validity of a study
These sources are likely to be stakeholders in a program - participants, other researchers, program staff, other community members, and so on.
Then we put all data in single framework & apply various statistical tools to find out the dynamic on the market.
During the analysis stage, feedback from the stakeholder groups would be compared to determine areas of agreement as well as areas of divergence