

Key Insights
The European Activated Carbon market is poised for robust growth, projected to reach a significant valuation by 2033, fueled by an increasing demand for advanced purification solutions across diverse sectors. With a Compound Annual Growth Rate (CAGR) of 5.41%, the market's expansion is primarily driven by the stringent environmental regulations governing water and air quality across the continent. The growing emphasis on sustainable industrial practices and the rising consumer awareness regarding the health benefits of clean air and water are also key accelerators. Water purification remains a dominant application, driven by aging infrastructure, increasing population, and the need to remove contaminants like heavy metals and organic pollutants. Similarly, gas purification is experiencing substantial growth due to its critical role in industrial emission control and indoor air quality management.
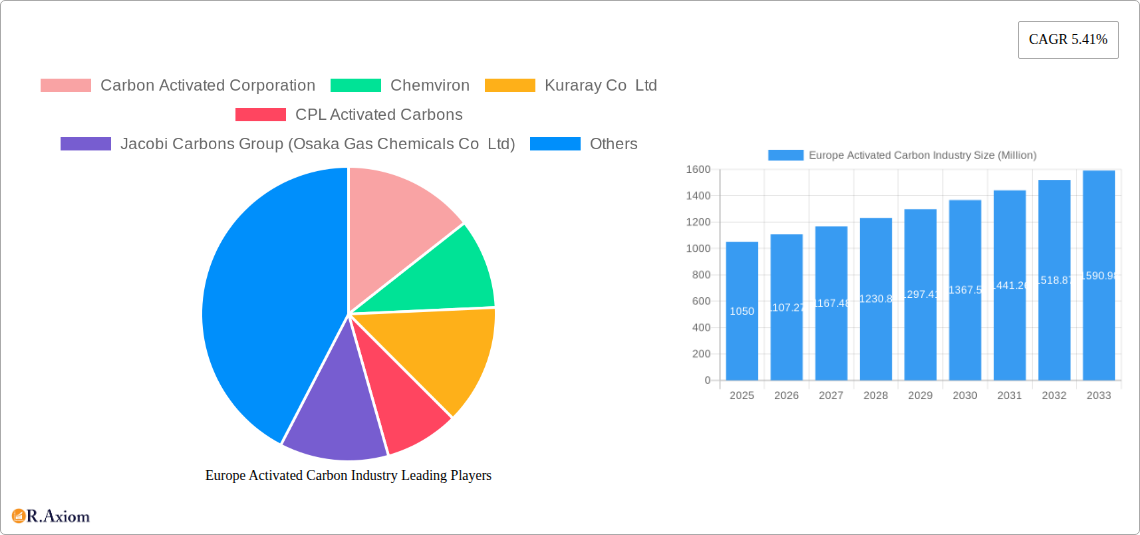
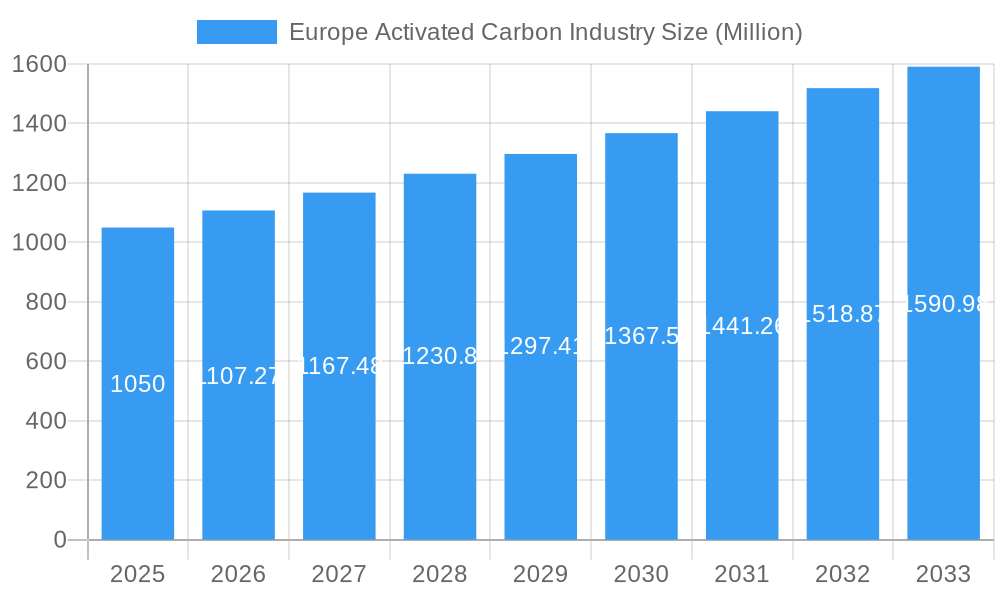
Europe Activated Carbon Industry Market Size (In Billion)
Emerging trends in the activated carbon market include the development of specialized carbons with enhanced adsorption capacities and selectivity for specific contaminants. Innovation in production technologies is also a significant factor, leading to more cost-effective and environmentally friendly manufacturing processes. The market segmentation highlights the dominance of Powdered Activated Carbon (PAC) and Granular Activated Carbon (GAC) due to their established efficacy and widespread use in various applications. However, advancements in Extruded or Pelletized Activated Carbon are gaining traction for specialized industrial processes requiring higher mechanical strength and regenerability. While the market benefits from strong drivers, potential restraints such as the volatility of raw material prices and the energy-intensive nature of activated carbon production require strategic management and technological innovation. Key players like Carbon Activated Corporation, Chemviron, and Kuraray Co Ltd are actively investing in research and development and expanding their production capacities to cater to the escalating European demand.
Europe Activated Carbon Industry Company Market Share
This comprehensive report delves into the dynamic Europe Activated Carbon Industry, providing an in-depth analysis of market concentration, innovation drivers, industry trends, dominant segments, product developments, key growth drivers, challenges, emerging opportunities, leading players, and strategic outlook. Covering the study period of 2019–2033, with 2025 as the base and estimated year, and a forecast period from 2025–2033, this report offers invaluable insights for stakeholders navigating the evolving landscape of activated carbon solutions in Europe.
Europe Activated Carbon Industry Market Concentration & Innovation
The Europe Activated Carbon Industry exhibits a moderate to high level of market concentration, with key players dominating specific application segments and regional markets. Innovation is a critical driver, fueled by increasing demand for sustainable solutions and advanced purification technologies. Regulatory frameworks, particularly those concerning environmental protection and water quality, significantly influence market dynamics and drive the adoption of high-performance activated carbon. Product substitutes, such as zeolites and ion-exchange resins, pose competition, especially in niche applications. End-user trends highlight a growing preference for customized activated carbon solutions tailored to specific purification needs across various industries. Mergers and acquisitions (M&A) are instrumental in consolidating market share and expanding technological capabilities. For instance, the August 2022 Ingevity investment signifies strategic expansion into high-growth sectors like electric vehicles, demonstrating a forward-looking approach to M&A. The M&A deal value for this particular transaction was estimated at USD 170 Million. Market share for major players varies, with estimated leading positions held by companies like Chemviron and Jacobi Carbons Group (Osaka Gas Chemicals Co Ltd) in specific segments, often exceeding 15% in their core areas.
Europe Activated Carbon Industry Industry Trends & Insights
The Europe Activated Carbon Industry is projected to experience robust growth, driven by escalating environmental regulations, growing awareness of water and air quality, and the burgeoning demand from diverse end-use industries. A significant CAGR of approximately 6.5% is anticipated throughout the forecast period. Technological advancements are continuously reshaping the market, with a focus on developing more efficient and specialized activated carbon products. These advancements include enhanced impregnation techniques for targeted contaminant removal and improved manufacturing processes for higher adsorption capacities. Consumer preferences are increasingly shifting towards sustainable and eco-friendly purification solutions, pushing manufacturers to invest in research and development of activated carbon derived from renewable resources. The competitive landscape is characterized by a blend of established global players and regional specialists, each vying for market penetration through product innovation, strategic partnerships, and competitive pricing. The market penetration of activated carbon in key applications like water treatment is already high, estimated at over 70%, with significant growth potential in emerging applications and less saturated markets. The overall market size for activated carbon in Europe is projected to reach approximately USD 2.5 Billion by 2025, expanding to over USD 4.5 Billion by 2033.
Dominant Markets & Segments in Europe Activated Carbon Industry
The Water Purification segment stands out as the most dominant application within the Europe Activated Carbon Industry, driven by stringent regulations on drinking water quality and the increasing demand for wastewater treatment. Germany, with its strong industrial base and advanced environmental policies, leads the European market in activated carbon consumption.
- Dominance of Granular Activated Carbon (GAC): GAC represents the largest segment by volume, owing to its versatility and effectiveness in large-scale water and air purification systems. Its reusability and ease of handling in filter beds contribute to its widespread adoption. The market share for GAC is estimated to be around 45% of the total activated carbon market.
- Key Drivers: Stringent EU water directives, industrial discharge regulations, and rising public health concerns contribute to the dominance of GAC in water treatment. Infrastructure development for municipal water treatment facilities further bolsters demand.
- Growth in Gas Purification: The Gas Purification segment is experiencing significant expansion, propelled by industrial emissions control requirements and the need for indoor air quality improvement.
- Key Drivers: Emission standards for industries like chemical manufacturing and power generation, coupled with the demand for air filters in automotive and residential applications, are key growth catalysts. The increasing focus on VOC (Volatile Organic Compound) removal is a significant trend.
- Emerging Potential of Powdered Activated Carbon (PAC): While historically smaller than GAC, PAC is witnessing considerable growth, particularly in batch treatment processes and emergency spill response due to its rapid adsorption kinetics. Its market share is projected to grow from an estimated 20% to 25% by 2033.
- Key Drivers: Flexibility in application, cost-effectiveness for certain contaminants, and its use in food and beverage processing are driving PAC adoption.
- Metal Extraction and Medicine: These segments, while niche, represent areas of specialized growth. Metal extraction relies on activated carbon for precious metal recovery, while the pharmaceutical industry uses it for purification of active pharmaceutical ingredients.
- Key Drivers: Fluctuations in commodity prices for metal extraction and advancements in drug manufacturing processes influence demand. The market size for these segments is expected to grow at a CAGR of around 5%.
- Extruded or Pelletized Activated Carbon: This type of activated carbon finds applications where dust control and specific flow characteristics are crucial, such as in gas phase applications. Its market share is estimated to be around 10%, with steady growth projected.
- Key Drivers: Demand from specialized industrial processes requiring precise contact time and minimal dust generation.
Europe Activated Carbon Industry Product Developments
Product innovation in the Europe Activated Carbon Industry is intensely focused on enhancing adsorption capacity, selectivity, and regenerability. Manufacturers are developing novel activated carbon formulations with tailored pore structures and surface chemistries to effectively target specific contaminants, including emerging micropollutants in water and complex gases in industrial emissions. Competitive advantages are being gained through the development of activated carbons from sustainable raw materials like biomass and agricultural waste, aligning with the circular economy. Furthermore, advancements in impregnation technologies are leading to activated carbons with superior catalytic properties, enabling simultaneous adsorption and catalytic degradation of pollutants. The market is witnessing a trend towards high-performance products offering longer service life and improved regeneration efficiency, thereby reducing operational costs for end-users.
Report Scope & Segmentation Analysis
This report provides a granular segmentation of the Europe Activated Carbon Industry across key product types and applications, offering detailed market size, growth projections, and competitive dynamics for each.
- Powdered Activated Carbon (PAC): This segment is characterized by its fine particle size, leading to rapid adsorption kinetics. PAC is widely used in batch processes for water treatment, food and beverage decolorization, and pharmaceutical purification. The market for PAC is projected to grow at a CAGR of 7%, reaching an estimated market size of USD 500 Million by 2033.
- Granular Activated Carbon (GAC): GAC, with its larger particle size and good mechanical strength, is the dominant segment for continuous flow applications like municipal water purification, industrial wastewater treatment, and air filtration. It is expected to maintain its leadership position with a projected CAGR of 6% and a market size of approximately USD 2 Billion by 2033.
- Extruded or Pelletized Activated Carbon: This form offers low dust generation and good flow properties, making it ideal for gas-phase applications such as solvent recovery, odor control, and gas masks. This segment is anticipated to grow at a CAGR of 5.5%, with an estimated market size of USD 400 Million by 2033.
- Gas Purification: This application segment is a major consumer of activated carbon, driven by stringent air quality regulations and industrial emission control needs. It is projected to grow at a CAGR of 7.5%, with significant demand from automotive, chemical, and manufacturing sectors.
- Water Purification: The largest application segment, encompassing drinking water treatment, wastewater treatment, and industrial process water purification, is expected to see a CAGR of 6.5%. Growing population and industrialization are key drivers.
- Metal Extraction: This segment, focused on precious metal recovery, is subject to commodity price fluctuations but offers steady growth driven by mining activities. An estimated CAGR of 4.5% is projected.
- Medicine: Used in pharmaceuticals for purification and detoxification, this segment is expected to grow at a CAGR of 5%, driven by the expansion of the pharmaceutical industry.
- Other Applications: This includes sectors like food and beverage, environmental remediation, and personal care, which collectively represent a growing market with a projected CAGR of 6%.
Key Drivers of Europe Activated Carbon Industry Growth
The Europe Activated Carbon Industry is propelled by several interconnected growth drivers. Stringent environmental regulations across the EU, particularly concerning water quality and industrial emissions, mandate the use of effective purification solutions like activated carbon. The increasing global emphasis on sustainability and circular economy principles is fostering demand for activated carbon derived from renewable resources and those that offer efficient regeneration. Technological advancements are leading to the development of high-performance activated carbons with enhanced adsorption capacities and specificity, catering to a wider range of emerging contaminants. Economic growth, coupled with industrial expansion in sectors like chemicals, pharmaceuticals, and automotive, directly translates to increased demand for activated carbon in their manufacturing and emission control processes.
Challenges in the Europe Activated Carbon Industry Sector
Despite its robust growth, the Europe Activated Carbon Industry faces several challenges. Fluctuations in the price and availability of raw materials, such as coal and coconut shells, can impact production costs and profit margins. The energy-intensive nature of activated carbon production also presents a challenge, particularly with rising energy prices and the drive towards decarbonization. Intense competition from both established global players and emerging regional manufacturers exerts downward pressure on prices. Furthermore, the disposal and regeneration of spent activated carbon, while improving, still pose environmental and economic considerations for end-users. Developing activated carbons that are effective against a wider array of persistent organic pollutants and emerging contaminants requires significant R&D investment.
Emerging Opportunities in Europe Activated Carbon Industry
The Europe Activated Carbon Industry is ripe with emerging opportunities. The growing demand for activated carbon in renewable energy applications, such as fuel cells and battery technologies, presents a significant growth avenue, as highlighted by Ingevity's strategic investment in Nexeon. The increasing focus on indoor air quality and the development of advanced air filtration systems for residential and commercial spaces offer substantial potential. The market for activated carbon in food and beverage processing, particularly for decolorization and purification of specialty products, is also expanding. Furthermore, advancements in carbon capture technologies and the development of activated carbons for environmental remediation of contaminated sites represent nascent but promising areas for innovation and market penetration.
Leading Players in the Europe Activated Carbon Industry Market
- Carbon Activated Corporation
- Chemviron
- Kuraray Co Ltd
- CPL Activated Carbons
- Jacobi Carbons Group (Osaka Gas Chemicals Co Ltd)
- Kureha Corporation
- Ingevity
- CarboTech
- Puragen Activated Carbons
- Donau Chemie AG
- Albemarle Corporation
Key Developments in Europe Activated Carbon Industry Industry
- August 2022: Ingevity invested USD 60 million in a USD 170 million round to acquire an equity stake in Nexeon Limited. This strategic move is aimed at establishing Ingevity's presence in the electric vehicle (EV) market and increasing opportunities to grow its activated carbon business.
Strategic Outlook for Europe Activated Carbon Industry Market
The Europe Activated Carbon Industry is poised for sustained growth, driven by a confluence of regulatory mandates, technological advancements, and evolving consumer preferences. The increasing demand for sophisticated purification solutions in water, air, and industrial processes will continue to be the primary growth catalyst. Strategic investments in research and development to create more efficient, sustainable, and application-specific activated carbons will be crucial for market leaders. Furthermore, the industry's ability to embrace the circular economy through enhanced regeneration processes and the utilization of novel, sustainable raw materials will define its long-term success. Expansion into emerging applications like energy storage and advanced environmental remediation presents significant opportunities for innovation and market leadership.
Europe Activated Carbon Industry Segmentation
-
1. Type
- 1.1. Powdered Activated Carbon (PAC)
- 1.2. Granular Activated Carbon (GAC)
- 1.3. Extruded or Pelletized Activated Carbon
-
2. Application
- 2.1. Gas Purification
- 2.2. Water Purification
- 2.3. Metal Extraction
- 2.4. Medicine
- 2.5. Other Applications
Europe Activated Carbon Industry Segmentation By Geography
- 1. Germany
- 2. United Kingdom
- 3. France
- 4. Italy
- 5. Spain
- 6. Rest of Europe
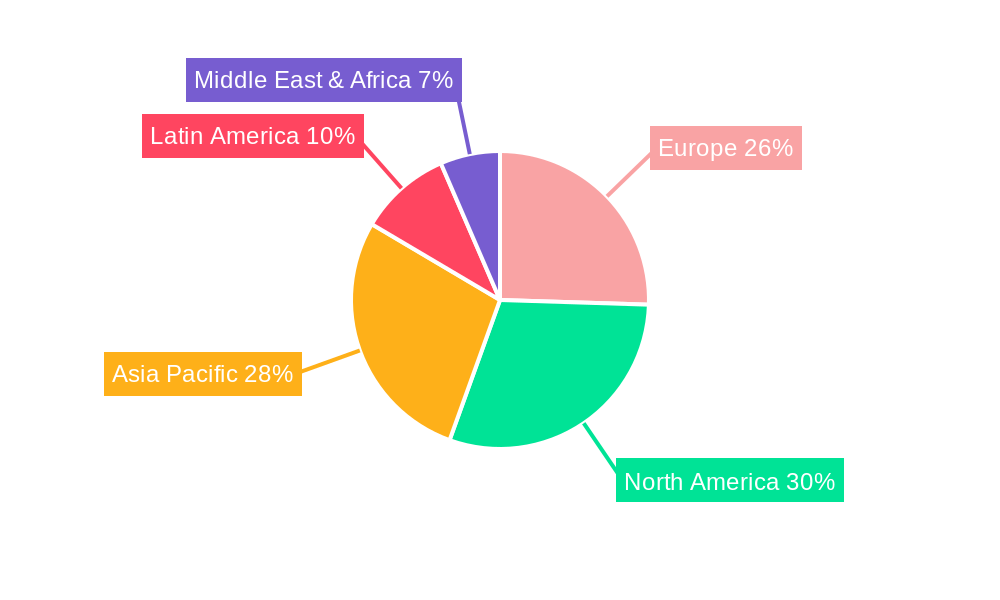
Europe Activated Carbon Industry Regional Market Share
Geographic Coverage of Europe Activated Carbon Industry
Europe Activated Carbon Industry REPORT HIGHLIGHTS
| Aspects | Details |
|---|---|
| Study Period | 2020-2034 |
| Base Year | 2025 |
| Estimated Year | 2026 |
| Forecast Period | 2026-2034 |
| Historical Period | 2020-2025 |
| Growth Rate | CAGR of 5.41% from 2020-2034 |
| Segmentation |
|
Table of Contents
- 1. Introduction
- 1.1. Research Scope
- 1.2. Market Segmentation
- 1.3. Research Objective
- 1.4. Definitions and Assumptions
- 2. Executive Summary
- 2.1. Market Snapshot
- 3. Market Dynamics
- 3.1. Market Drivers
- 3.2. Market Restrains
- 3.3. Market Trends
- 3.4. Market Opportunities
- 4. Market Factor Analysis
- 4.1. Porters Five Forces
- 4.1.1. Bargaining Power of Suppliers
- 4.1.2. Bargaining Power of Buyers
- 4.1.3. Threat of New Entrants
- 4.1.4. Threat of Substitutes
- 4.1.5. Competitive Rivalry
- 4.2. PESTEL analysis
- 4.3. BCG Analysis
- 4.3.1. Stars (High Growth, High Market Share)
- 4.3.2. Cash Cows (Low Growth, High Market Share)
- 4.3.3. Question Mark (High Growth, Low Market Share)
- 4.3.4. Dogs (Low Growth, Low Market Share)
- 4.4. Ansoff Matrix Analysis
- 4.5. Supply Chain Analysis
- 4.6. Regulatory Landscape
- 4.7. Current Market Potential and Opportunity Assessment (TAM–SAM–SOM Framework)
- 4.8. RAX Analyst Note
- 4.1. Porters Five Forces
- 5. Market Analysis, Insights and Forecast 2021-2033
- 5.1. Market Analysis, Insights and Forecast - by Type
- 5.1.1. Powdered Activated Carbon (PAC)
- 5.1.2. Granular Activated Carbon (GAC)
- 5.1.3. Extruded or Pelletized Activated Carbon
- 5.2. Market Analysis, Insights and Forecast - by Application
- 5.2.1. Gas Purification
- 5.2.2. Water Purification
- 5.2.3. Metal Extraction
- 5.2.4. Medicine
- 5.2.5. Other Applications
- 5.3. Market Analysis, Insights and Forecast - by Region
- 5.3.1. Germany
- 5.3.2. United Kingdom
- 5.3.3. France
- 5.3.4. Italy
- 5.3.5. Spain
- 5.3.6. Rest of Europe
- 5.1. Market Analysis, Insights and Forecast - by Type
- 6. Europe Activated Carbon Industry Analysis, Insights and Forecast, 2021-2033
- 6.1. Market Analysis, Insights and Forecast - by Type
- 6.1.1. Powdered Activated Carbon (PAC)
- 6.1.2. Granular Activated Carbon (GAC)
- 6.1.3. Extruded or Pelletized Activated Carbon
- 6.2. Market Analysis, Insights and Forecast - by Application
- 6.2.1. Gas Purification
- 6.2.2. Water Purification
- 6.2.3. Metal Extraction
- 6.2.4. Medicine
- 6.2.5. Other Applications
- 6.1. Market Analysis, Insights and Forecast - by Type
- 7. Germany Europe Activated Carbon Industry Analysis, Insights and Forecast, 2020-2032
- 7.1. Market Analysis, Insights and Forecast - by Type
- 7.1.1. Powdered Activated Carbon (PAC)
- 7.1.2. Granular Activated Carbon (GAC)
- 7.1.3. Extruded or Pelletized Activated Carbon
- 7.2. Market Analysis, Insights and Forecast - by Application
- 7.2.1. Gas Purification
- 7.2.2. Water Purification
- 7.2.3. Metal Extraction
- 7.2.4. Medicine
- 7.2.5. Other Applications
- 7.1. Market Analysis, Insights and Forecast - by Type
- 8. United Kingdom Europe Activated Carbon Industry Analysis, Insights and Forecast, 2020-2032
- 8.1. Market Analysis, Insights and Forecast - by Type
- 8.1.1. Powdered Activated Carbon (PAC)
- 8.1.2. Granular Activated Carbon (GAC)
- 8.1.3. Extruded or Pelletized Activated Carbon
- 8.2. Market Analysis, Insights and Forecast - by Application
- 8.2.1. Gas Purification
- 8.2.2. Water Purification
- 8.2.3. Metal Extraction
- 8.2.4. Medicine
- 8.2.5. Other Applications
- 8.1. Market Analysis, Insights and Forecast - by Type
- 9. France Europe Activated Carbon Industry Analysis, Insights and Forecast, 2020-2032
- 9.1. Market Analysis, Insights and Forecast - by Type
- 9.1.1. Powdered Activated Carbon (PAC)
- 9.1.2. Granular Activated Carbon (GAC)
- 9.1.3. Extruded or Pelletized Activated Carbon
- 9.2. Market Analysis, Insights and Forecast - by Application
- 9.2.1. Gas Purification
- 9.2.2. Water Purification
- 9.2.3. Metal Extraction
- 9.2.4. Medicine
- 9.2.5. Other Applications
- 9.1. Market Analysis, Insights and Forecast - by Type
- 10. Italy Europe Activated Carbon Industry Analysis, Insights and Forecast, 2020-2032
- 10.1. Market Analysis, Insights and Forecast - by Type
- 10.1.1. Powdered Activated Carbon (PAC)
- 10.1.2. Granular Activated Carbon (GAC)
- 10.1.3. Extruded or Pelletized Activated Carbon
- 10.2. Market Analysis, Insights and Forecast - by Application
- 10.2.1. Gas Purification
- 10.2.2. Water Purification
- 10.2.3. Metal Extraction
- 10.2.4. Medicine
- 10.2.5. Other Applications
- 10.1. Market Analysis, Insights and Forecast - by Type
- 11. Spain Europe Activated Carbon Industry Analysis, Insights and Forecast, 2020-2032
- 11.1. Market Analysis, Insights and Forecast - by Type
- 11.1.1. Powdered Activated Carbon (PAC)
- 11.1.2. Granular Activated Carbon (GAC)
- 11.1.3. Extruded or Pelletized Activated Carbon
- 11.2. Market Analysis, Insights and Forecast - by Application
- 11.2.1. Gas Purification
- 11.2.2. Water Purification
- 11.2.3. Metal Extraction
- 11.2.4. Medicine
- 11.2.5. Other Applications
- 11.1. Market Analysis, Insights and Forecast - by Type
- 12. Rest of Europe Europe Activated Carbon Industry Analysis, Insights and Forecast, 2020-2032
- 12.1. Market Analysis, Insights and Forecast - by Type
- 12.1.1. Powdered Activated Carbon (PAC)
- 12.1.2. Granular Activated Carbon (GAC)
- 12.1.3. Extruded or Pelletized Activated Carbon
- 12.2. Market Analysis, Insights and Forecast - by Application
- 12.2.1. Gas Purification
- 12.2.2. Water Purification
- 12.2.3. Metal Extraction
- 12.2.4. Medicine
- 12.2.5. Other Applications
- 12.1. Market Analysis, Insights and Forecast - by Type
- 13. Competitive Analysis
- 13.1. Company Profiles
- 13.1.1 Carbon Activated Corporation
- 13.1.1.1. Company Overview
- 13.1.1.2. Products
- 13.1.1.3. Company Financials
- 13.1.1.4. SWOT Analysis
- 13.1.2 Chemviron
- 13.1.2.1. Company Overview
- 13.1.2.2. Products
- 13.1.2.3. Company Financials
- 13.1.2.4. SWOT Analysis
- 13.1.3 Kuraray Co Ltd
- 13.1.3.1. Company Overview
- 13.1.3.2. Products
- 13.1.3.3. Company Financials
- 13.1.3.4. SWOT Analysis
- 13.1.4 CPL Activated Carbons
- 13.1.4.1. Company Overview
- 13.1.4.2. Products
- 13.1.4.3. Company Financials
- 13.1.4.4. SWOT Analysis
- 13.1.5 Jacobi Carbons Group (Osaka Gas Chemicals Co Ltd)
- 13.1.5.1. Company Overview
- 13.1.5.2. Products
- 13.1.5.3. Company Financials
- 13.1.5.4. SWOT Analysis
- 13.1.6 Kureha Corporation
- 13.1.6.1. Company Overview
- 13.1.6.2. Products
- 13.1.6.3. Company Financials
- 13.1.6.4. SWOT Analysis
- 13.1.7 Ingevity
- 13.1.7.1. Company Overview
- 13.1.7.2. Products
- 13.1.7.3. Company Financials
- 13.1.7.4. SWOT Analysis
- 13.1.8 CarboTech
- 13.1.8.1. Company Overview
- 13.1.8.2. Products
- 13.1.8.3. Company Financials
- 13.1.8.4. SWOT Analysis
- 13.1.9 Puragen Activated Carbons
- 13.1.9.1. Company Overview
- 13.1.9.2. Products
- 13.1.9.3. Company Financials
- 13.1.9.4. SWOT Analysis
- 13.1.10 Donau Chemie AG
- 13.1.10.1. Company Overview
- 13.1.10.2. Products
- 13.1.10.3. Company Financials
- 13.1.10.4. SWOT Analysis
- 13.1.11 Albemarle Corporation
- 13.1.11.1. Company Overview
- 13.1.11.2. Products
- 13.1.11.3. Company Financials
- 13.1.11.4. SWOT Analysis
- 13.1.1 Carbon Activated Corporation
- 13.2. Market Entropy
- 13.2.1 Company's Key Areas Served
- 13.2.2 Recent Developments
- 13.3. Company Market Share Analysis 2025
- 13.3.1 Top 5 Companies Market Share Analysis
- 13.3.2 Top 3 Companies Market Share Analysis
- 13.4. List of Potential Customers
- 14. Research Methodology
List of Figures
- Figure 1: Europe Activated Carbon Industry Revenue Breakdown (Million, %) by Product 2025 & 2033
- Figure 2: Europe Activated Carbon Industry Share (%) by Company 2025
List of Tables
- Table 1: Europe Activated Carbon Industry Revenue Million Forecast, by Type 2020 & 2033
- Table 2: Europe Activated Carbon Industry Volume K Tons Forecast, by Type 2020 & 2033
- Table 3: Europe Activated Carbon Industry Revenue Million Forecast, by Application 2020 & 2033
- Table 4: Europe Activated Carbon Industry Volume K Tons Forecast, by Application 2020 & 2033
- Table 5: Europe Activated Carbon Industry Revenue Million Forecast, by Region 2020 & 2033
- Table 6: Europe Activated Carbon Industry Volume K Tons Forecast, by Region 2020 & 2033
- Table 7: Europe Activated Carbon Industry Revenue Million Forecast, by Type 2020 & 2033
- Table 8: Europe Activated Carbon Industry Volume K Tons Forecast, by Type 2020 & 2033
- Table 9: Europe Activated Carbon Industry Revenue Million Forecast, by Application 2020 & 2033
- Table 10: Europe Activated Carbon Industry Volume K Tons Forecast, by Application 2020 & 2033
- Table 11: Europe Activated Carbon Industry Revenue Million Forecast, by Country 2020 & 2033
- Table 12: Europe Activated Carbon Industry Volume K Tons Forecast, by Country 2020 & 2033
- Table 13: Europe Activated Carbon Industry Revenue Million Forecast, by Type 2020 & 2033
- Table 14: Europe Activated Carbon Industry Volume K Tons Forecast, by Type 2020 & 2033
- Table 15: Europe Activated Carbon Industry Revenue Million Forecast, by Application 2020 & 2033
- Table 16: Europe Activated Carbon Industry Volume K Tons Forecast, by Application 2020 & 2033
- Table 17: Europe Activated Carbon Industry Revenue Million Forecast, by Country 2020 & 2033
- Table 18: Europe Activated Carbon Industry Volume K Tons Forecast, by Country 2020 & 2033
- Table 19: Europe Activated Carbon Industry Revenue Million Forecast, by Type 2020 & 2033
- Table 20: Europe Activated Carbon Industry Volume K Tons Forecast, by Type 2020 & 2033
- Table 21: Europe Activated Carbon Industry Revenue Million Forecast, by Application 2020 & 2033
- Table 22: Europe Activated Carbon Industry Volume K Tons Forecast, by Application 2020 & 2033
- Table 23: Europe Activated Carbon Industry Revenue Million Forecast, by Country 2020 & 2033
- Table 24: Europe Activated Carbon Industry Volume K Tons Forecast, by Country 2020 & 2033
- Table 25: Europe Activated Carbon Industry Revenue Million Forecast, by Type 2020 & 2033
- Table 26: Europe Activated Carbon Industry Volume K Tons Forecast, by Type 2020 & 2033
- Table 27: Europe Activated Carbon Industry Revenue Million Forecast, by Application 2020 & 2033
- Table 28: Europe Activated Carbon Industry Volume K Tons Forecast, by Application 2020 & 2033
- Table 29: Europe Activated Carbon Industry Revenue Million Forecast, by Country 2020 & 2033
- Table 30: Europe Activated Carbon Industry Volume K Tons Forecast, by Country 2020 & 2033
- Table 31: Europe Activated Carbon Industry Revenue Million Forecast, by Type 2020 & 2033
- Table 32: Europe Activated Carbon Industry Volume K Tons Forecast, by Type 2020 & 2033
- Table 33: Europe Activated Carbon Industry Revenue Million Forecast, by Application 2020 & 2033
- Table 34: Europe Activated Carbon Industry Volume K Tons Forecast, by Application 2020 & 2033
- Table 35: Europe Activated Carbon Industry Revenue Million Forecast, by Country 2020 & 2033
- Table 36: Europe Activated Carbon Industry Volume K Tons Forecast, by Country 2020 & 2033
- Table 37: Europe Activated Carbon Industry Revenue Million Forecast, by Type 2020 & 2033
- Table 38: Europe Activated Carbon Industry Volume K Tons Forecast, by Type 2020 & 2033
- Table 39: Europe Activated Carbon Industry Revenue Million Forecast, by Application 2020 & 2033
- Table 40: Europe Activated Carbon Industry Volume K Tons Forecast, by Application 2020 & 2033
- Table 41: Europe Activated Carbon Industry Revenue Million Forecast, by Country 2020 & 2033
- Table 42: Europe Activated Carbon Industry Volume K Tons Forecast, by Country 2020 & 2033
Frequently Asked Questions
1. What is the projected Compound Annual Growth Rate (CAGR) of the Europe Activated Carbon Industry?
The projected CAGR is approximately 5.41%.
2. Which companies are prominent players in the Europe Activated Carbon Industry?
Key companies in the market include Carbon Activated Corporation, Chemviron, Kuraray Co Ltd, CPL Activated Carbons, Jacobi Carbons Group (Osaka Gas Chemicals Co Ltd), Kureha Corporation, Ingevity, CarboTech, Puragen Activated Carbons, Donau Chemie AG, Albemarle Corporation.
3. What are the main segments of the Europe Activated Carbon Industry?
The market segments include Type, Application.
4. Can you provide details about the market size?
The market size is estimated to be USD 0.98 Million as of 2022.
5. What are some drivers contributing to market growth?
Augmenting Prominence for Air Pollution Control; Surge in Demand from Water Treatment and Water Purification Applications; Other Drivers.
6. What are the notable trends driving market growth?
Medicine Segment to be the Fastest Growing Application.
7. Are there any restraints impacting market growth?
Availability of Substitute Products; Other Restraints.
8. Can you provide examples of recent developments in the market?
August 2022: Ingevity invested USD 60 million in a USD 170 million round to acquire an equity stake in Nexeon Limited. It is a strategic move to establish the company's presence in the electric vehicle (EV) market and increase opportunities to grow its activated carbon business.
9. What pricing options are available for accessing the report?
Pricing options include single-user, multi-user, and enterprise licenses priced at USD 3,950, USD 4,950, and USD 6,950 respectively.
10. Is the market size provided in terms of value or volume?
The market size is provided in terms of value, measured in Million and volume, measured in K Tons.
11. Are there any specific market keywords associated with the report?
Yes, the market keyword associated with the report is "Europe Activated Carbon Industry," which aids in identifying and referencing the specific market segment covered.
12. How do I determine which pricing option suits my needs best?
The pricing options vary based on user requirements and access needs. Individual users may opt for single-user licenses, while businesses requiring broader access may choose multi-user or enterprise licenses for cost-effective access to the report.
13. Are there any additional resources or data provided in the Europe Activated Carbon Industry report?
While the report offers comprehensive insights, it's advisable to review the specific contents or supplementary materials provided to ascertain if additional resources or data are available.
14. How can I stay updated on further developments or reports in the Europe Activated Carbon Industry?
To stay informed about further developments, trends, and reports in the Europe Activated Carbon Industry, consider subscribing to industry newsletters, following relevant companies and organizations, or regularly checking reputable industry news sources and publications.
Methodology
Step 1 - Identification of Relevant Samples Size from Population Database


Step 2 - Approaches for Defining Global Market Size (Value, Volume* & Price*)

Note*: In applicable scenarios
Step 3 - Data Sources
Primary Research
- Web Analytics
- Survey Reports
- Research Institute
- Latest Research Reports
- Opinion Leaders
Secondary Research
- Annual Reports
- White Paper
- Latest Press Release
- Industry Association
- Paid Database
- Investor Presentations

Step 4 - Data Triangulation
Involves using different sources of information in order to increase the validity of a study
These sources are likely to be stakeholders in a program - participants, other researchers, program staff, other community members, and so on.
Then we put all data in single framework & apply various statistical tools to find out the dynamic on the market.
During the analysis stage, feedback from the stakeholder groups would be compared to determine areas of agreement as well as areas of divergence