
Key Insights
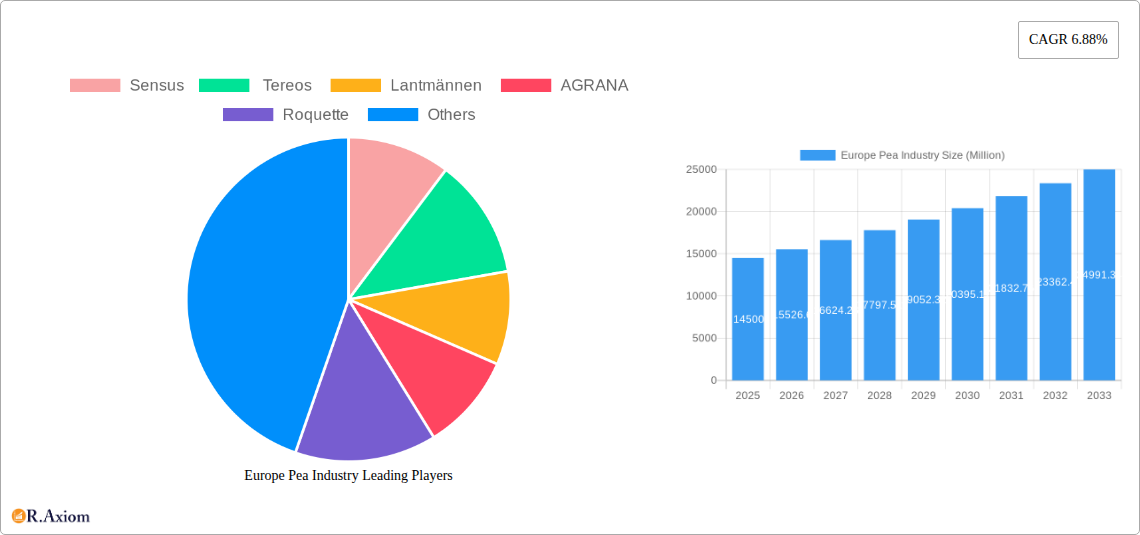
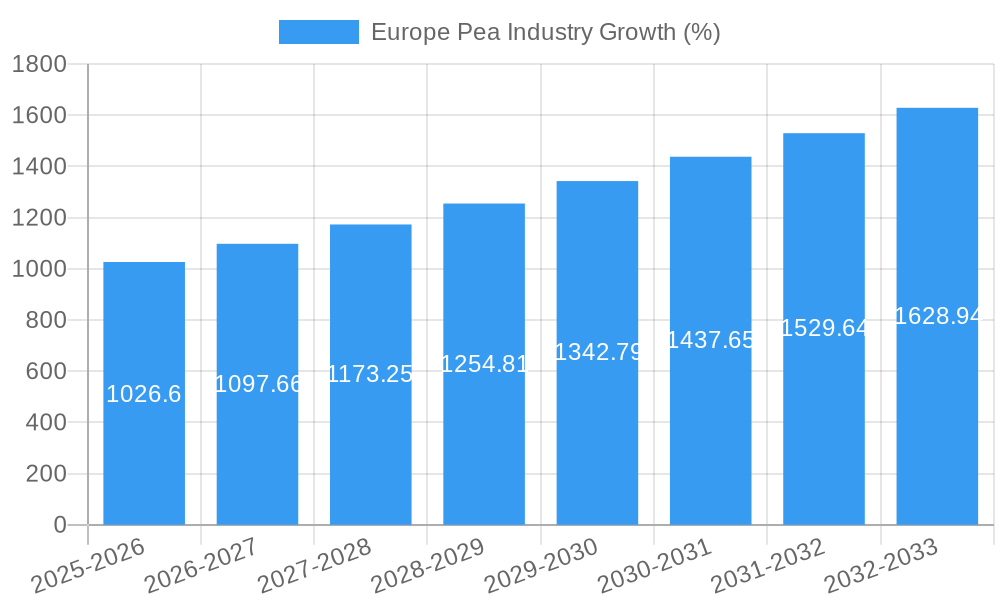
The European pea industry, valued at €14.50 billion in 2025, is projected to experience robust growth, exhibiting a Compound Annual Growth Rate (CAGR) of 6.88% from 2025 to 2033. This expansion is fueled by several key factors. Increasing consumer demand for plant-based proteins and healthier diets is driving significant growth in pea protein isolate and pea flour applications within food and beverage products. Furthermore, the growing awareness of the environmental benefits of pea cultivation, particularly its lower water footprint compared to other protein sources, is bolstering its adoption. Government initiatives promoting sustainable agriculture within the EU are also contributing to the industry's positive trajectory. Specific regional variations exist, with Germany, France, and the Netherlands representing key production and consumption hubs. Competition among major players such as Sensus, Tereos, Lantmännen, AGRANA, and Roquette is fostering innovation in processing and product diversification, leading to new applications in areas like animal feed and industrial uses. However, factors like fluctuating agricultural yields due to climate change and the potential impact of geopolitical instability, particularly in Eastern Europe, pose challenges to sustained growth.
Despite these challenges, the long-term outlook for the European pea industry remains optimistic. The ongoing expansion of the plant-based food sector, combined with continued research and development into pea-derived ingredients, points towards sustained growth. Price trends will likely be influenced by global supply and demand, as well as production costs. Eastern European countries, especially Ukraine, play a significant role in overall supply, making their production stability crucial for the market's performance. The industry’s future hinges on addressing the aforementioned challenges while leveraging opportunities for expansion into new markets and applications. Strategic partnerships between producers, processors, and food manufacturers will be key to capitalizing on the industry’s considerable growth potential.
This in-depth report provides a comprehensive analysis of the European pea industry, covering market trends, competitive landscape, and future growth prospects. The study period spans from 2019 to 2033, with 2025 serving as the base and estimated year. The report offers actionable insights for industry stakeholders, including producers, processors, distributors, and investors. It leverages extensive data analysis to forecast market performance from 2025 to 2033, detailing crucial aspects of production, pricing, and market dynamics across key European nations.
Europe Pea Industry Market Concentration & Innovation
The European pea industry exhibits a moderately concentrated market structure, with a few major players holding significant market share. Sensus, Tereos, Lantmännen, AGRANA, and Roquette are key players driving innovation and shaping market dynamics. Market share estimations for 2025 are as follows: Roquette (25%), Lantmännen (20%), Tereos (18%), AGRANA (15%), Sensus (12%), Others (10%).
Innovation is driven by increasing demand for plant-based proteins and the development of new pea-based products. Regulatory frameworks, particularly those related to food safety and sustainability, significantly influence industry practices. Product substitutes, such as soy and other legumes, create competitive pressure. End-user trends towards healthier and more sustainable food options fuel market growth. M&A activities in the sector remain moderate, with deal values averaging approximately xx Million USD annually in the historical period (2019-2024). Key M&A activities are often focused on expanding production capacity and product portfolios.
Europe Pea Industry Industry Trends & Insights
The European pea industry is experiencing robust growth, driven by several key factors. The compound annual growth rate (CAGR) during the forecast period (2025-2033) is projected to be xx%, indicating significant market expansion. Rising consumer demand for plant-based protein sources, fueled by health and environmental concerns, is a major growth driver. Technological advancements in pea processing and the development of novel pea-based ingredients are further enhancing market prospects. The market penetration of pea protein in food and beverage applications is expected to increase from xx% in 2025 to xx% by 2033. Increasing consumer awareness of pea's nutritional benefits contributes to market expansion. Competitive dynamics are characterized by innovation in product development and expansion into new market segments.
Dominant Markets & Segments in Europe Pea Industry
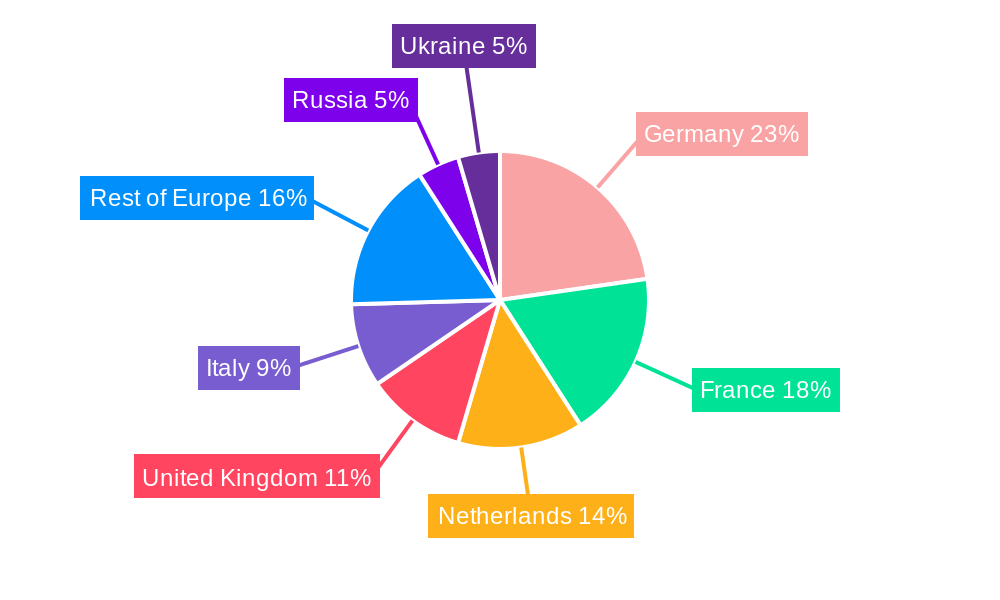
France: France holds a dominant position due to its established agricultural base and significant processing capacity, representing xx% of the European market in 2025. Key drivers include favorable climatic conditions, government support for agricultural production, and a robust food processing industry.
Netherlands: The Netherlands is another significant market, known for its advanced agricultural technologies and export capabilities, holding a xx% market share in 2025. Efficient logistics and a focus on sustainable agriculture contribute to its prominence.
Spain: Spain is a notable producer and consumer of peas, with a market share of xx% in 2025. Favorable weather conditions for pea cultivation and growing demand for plant-based foods drive its growth.
Ukraine: Before the 2022 conflict, Ukraine played a key role as a major exporter. The war significantly disrupted production and exports, affecting its market share (currently xx%). The long-term effects on Ukraine’s production and export capacity are uncertain but impactful on European pea market dynamics.
Russia: Russia's production analysis shows a fluctuating pattern over the study period. Its market share is currently xx%. A key factor in Russia's role is its export potential, especially to China as witnessed by the phytosanitary protocol signed in 2022, impacting global market competitiveness. Price trend analysis indicates significant price volatility, particularly influenced by geopolitical factors.
Rest of Europe: The “Rest of Europe” segment comprises numerous countries with varying levels of pea production and consumption, collectively holding a xx% market share in 2025. Growth in this segment is driven by increased awareness of plant-based diets and diverse application of pea products.
Europe Pea Industry Product Developments
Recent years have witnessed significant innovations in pea-based products, including the development of high-protein pea flours, pea protein isolates, pea starches, and textured pea proteins. These products are finding applications in diverse food and beverage categories, ranging from meat alternatives and dairy substitutes to bakery products and snacks. Technological advancements in processing techniques have led to improved product quality, functionality, and cost-effectiveness. This continuous innovation has significantly broadened the market reach of pea-based products and strengthened their competitive advantages against traditional protein sources.
Report Scope & Segmentation Analysis
This report segments the European pea industry based on geographic regions (Ukraine, France, Spain, Netherlands, Russia, and Rest of Europe), product types (pea protein, pea starch, whole peas, etc.), and applications (food & beverage, animal feed, industrial applications). Growth projections for each segment are provided for the forecast period (2025-2033), along with detailed analyses of market sizes and competitive dynamics. Each segment's growth is assessed based on factors like consumer demand, regulatory changes, and technological advancements, providing a nuanced understanding of the sector's evolving nature. Russia’s production analysis includes data on harvested acreage and yield, reflecting the country's role in the overall supply chain and market price fluctuations. Price trend analyses for each region consider seasonal variations, supply and demand dynamics, and global market fluctuations.
Key Drivers of Europe Pea Industry Growth
Several factors drive the growth of the European pea industry. The increasing global demand for plant-based proteins, driven by health and environmental concerns, represents a major driver. Technological advancements in pea processing and the development of novel, high-quality pea-based ingredients have broadened applications. Favorable government policies and initiatives promoting sustainable agriculture also contribute to market expansion. The rising adoption of pea protein in various food and beverage products fuels market growth.
Challenges in the Europe Pea Industry Sector
Challenges facing the European pea industry include fluctuating raw material prices, dependence on weather conditions affecting yields, and intense competition from substitute protein sources. Supply chain disruptions, particularly observed during the 2022 Ukraine conflict, highlight vulnerability in the industry's logistical systems. Regulatory hurdles related to food labeling and sustainability standards impose compliance costs. Maintaining a competitive edge requires continuous product innovation and cost-effective production methods. The industry faces pressure from other plant-based protein sources like soy and lentils, further impacting market shares and pricing strategies.
Emerging Opportunities in Europe Pea Industry
Emerging opportunities include expanding into new markets with high growth potential, particularly in developing economies. The development of novel pea-based ingredients tailored to specific applications (e.g., functional foods, nutraceuticals) presents growth avenues. Technological advancements in precision agriculture and sustainable farming practices can increase yield and reduce production costs. Meeting rising consumer demand for sustainable and ethically sourced ingredients creates additional opportunities.
Leading Players in the Europe Pea Industry Market
- Sensus
- Tereos
- Lantmännen
- AGRANA
- Roquette
Key Developments in Europe Pea Industry Industry
- October 2022: Roquette launched a new line of organic pea ingredients (starch and protein), expanding its product portfolio and catering to growing consumer demand for organic products. This move significantly bolstered their market position.
- September 2022: Lantmännen's substantial investment in a new pea protein production facility signifies its commitment to expanding production capacity and meeting the rising market demand. This proactive step strengthens its competitive standing in the long term.
- May 2022: The phytosanitary protocol between China and Russia opened new export opportunities for Russian peas, creating additional competition for Canadian exports and globally influencing pea market prices. This highlights the interconnected nature of global pea markets and the impact of geopolitical factors.
Strategic Outlook for Europe Pea Industry Market
The European pea industry is poised for sustained growth, driven by increasing demand for plant-based proteins, ongoing technological innovations, and favorable regulatory environments. Expansion into new applications and geographic markets, coupled with continuous efforts towards sustainability, will be key drivers of future market potential. The industry is expected to witness further consolidation and strategic partnerships, leading to an increase in production capacity and market share among key players. The overall outlook is positive, with strong growth prospects across all segments, particularly in the food and beverage sector.
Europe Pea Industry Segmentation
-
1. Russia
-
1.1. Production Analysis
- 1.1.1. Consumption Analysis and Market Value
- 1.1.2. Import Market Analysis (Volume and Value)
- 1.1.3. Export Market Analysis (Volume and Value)
- 1.1.4. Price Trend Analysis
- 1.2. Ukraine
- 1.3. France
- 1.4. Spain
- 1.5. Netherlands
- 1.6. Rest of Europe
-
1.1. Production Analysis
-
2. Russia
-
2.1. Production Analysis
- 2.1.1. Consumption Analysis and Market Value
- 2.1.2. Import Market Analysis (Volume and Value)
- 2.1.3. Export Market Analysis (Volume and Value)
- 2.1.4. Price Trend Analysis
- 2.2. Ukraine
- 2.3. France
- 2.4. Spain
- 2.5. Netherlands
- 2.6. Rest of Europe
-
2.1. Production Analysis
Europe Pea Industry Segmentation By Geography
-
1. Europe
- 1.1. United Kingdom
- 1.2. Germany
- 1.3. France
- 1.4. Italy
- 1.5. Spain
- 1.6. Netherlands
- 1.7. Belgium
- 1.8. Sweden
- 1.9. Norway
- 1.10. Poland
- 1.11. Denmark
Europe Pea Industry REPORT HIGHLIGHTS
| Aspects | Details |
|---|---|
| Study Period | 2019-2033 |
| Base Year | 2024 |
| Estimated Year | 2025 |
| Forecast Period | 2025-2033 |
| Historical Period | 2019-2024 |
| Growth Rate | CAGR of 6.88% from 2019-2033 |
| Segmentation |
|
Table of Contents
- 1. Introduction
- 1.1. Research Scope
- 1.2. Market Segmentation
- 1.3. Research Methodology
- 1.4. Definitions and Assumptions
- 2. Executive Summary
- 2.1. Introduction
- 3. Market Dynamics
- 3.1. Introduction
- 3.2. Market Drivers
- 3.2.1. Rising Consumption of Cashew Nuts in the Country; Favorable Government Initiatives
- 3.3. Market Restrains
- 3.3.1. Hazardous Climatic Condition Hinders Cashew Production; Stringent Regulations Related to Food Quality Standards
- 3.4. Market Trends
- 3.4.1. Growing Export Opportunity
- 4. Market Factor Analysis
- 4.1. Porters Five Forces
- 4.2. Supply/Value Chain
- 4.3. PESTEL analysis
- 4.4. Market Entropy
- 4.5. Patent/Trademark Analysis
- 5. Europe Pea Industry Analysis, Insights and Forecast, 2019-2031
- 5.1. Market Analysis, Insights and Forecast - by Russia
- 5.1.1. Production Analysis
- 5.1.1.1. Consumption Analysis and Market Value
- 5.1.1.2. Import Market Analysis (Volume and Value)
- 5.1.1.3. Export Market Analysis (Volume and Value)
- 5.1.1.4. Price Trend Analysis
- 5.1.2. Ukraine
- 5.1.3. France
- 5.1.4. Spain
- 5.1.5. Netherlands
- 5.1.6. Rest of Europe
- 5.1.1. Production Analysis
- 5.2. Market Analysis, Insights and Forecast - by Russia
- 5.2.1. Production Analysis
- 5.2.1.1. Consumption Analysis and Market Value
- 5.2.1.2. Import Market Analysis (Volume and Value)
- 5.2.1.3. Export Market Analysis (Volume and Value)
- 5.2.1.4. Price Trend Analysis
- 5.2.2. Ukraine
- 5.2.3. France
- 5.2.4. Spain
- 5.2.5. Netherlands
- 5.2.6. Rest of Europe
- 5.2.1. Production Analysis
- 5.3. Market Analysis, Insights and Forecast - by Region
- 5.3.1. Europe
- 5.1. Market Analysis, Insights and Forecast - by Russia
- 6. Germany Europe Pea Industry Analysis, Insights and Forecast, 2019-2031
- 7. France Europe Pea Industry Analysis, Insights and Forecast, 2019-2031
- 8. Italy Europe Pea Industry Analysis, Insights and Forecast, 2019-2031
- 9. United Kingdom Europe Pea Industry Analysis, Insights and Forecast, 2019-2031
- 10. Netherlands Europe Pea Industry Analysis, Insights and Forecast, 2019-2031
- 11. Sweden Europe Pea Industry Analysis, Insights and Forecast, 2019-2031
- 12. Rest of Europe Europe Pea Industry Analysis, Insights and Forecast, 2019-2031
- 13. Competitive Analysis
- 13.1. Market Share Analysis 2024
- 13.2. Company Profiles
- 13.2.1 Sensus
- 13.2.1.1. Overview
- 13.2.1.2. Products
- 13.2.1.3. SWOT Analysis
- 13.2.1.4. Recent Developments
- 13.2.1.5. Financials (Based on Availability)
- 13.2.2 Tereos
- 13.2.2.1. Overview
- 13.2.2.2. Products
- 13.2.2.3. SWOT Analysis
- 13.2.2.4. Recent Developments
- 13.2.2.5. Financials (Based on Availability)
- 13.2.3 Lantmännen
- 13.2.3.1. Overview
- 13.2.3.2. Products
- 13.2.3.3. SWOT Analysis
- 13.2.3.4. Recent Developments
- 13.2.3.5. Financials (Based on Availability)
- 13.2.4 AGRANA
- 13.2.4.1. Overview
- 13.2.4.2. Products
- 13.2.4.3. SWOT Analysis
- 13.2.4.4. Recent Developments
- 13.2.4.5. Financials (Based on Availability)
- 13.2.5 Roquette
- 13.2.5.1. Overview
- 13.2.5.2. Products
- 13.2.5.3. SWOT Analysis
- 13.2.5.4. Recent Developments
- 13.2.5.5. Financials (Based on Availability)
- 13.2.1 Sensus
List of Figures
- Figure 1: Europe Pea Industry Revenue Breakdown (Million, %) by Product 2024 & 2032
- Figure 2: Europe Pea Industry Share (%) by Company 2024
List of Tables
- Table 1: Europe Pea Industry Revenue Million Forecast, by Region 2019 & 2032
- Table 2: Europe Pea Industry Volume million units Forecast, by Region 2019 & 2032
- Table 3: Europe Pea Industry Revenue Million Forecast, by Russia 2019 & 2032
- Table 4: Europe Pea Industry Volume million units Forecast, by Russia 2019 & 2032
- Table 5: Europe Pea Industry Revenue Million Forecast, by Russia 2019 & 2032
- Table 6: Europe Pea Industry Volume million units Forecast, by Russia 2019 & 2032
- Table 7: Europe Pea Industry Revenue Million Forecast, by Region 2019 & 2032
- Table 8: Europe Pea Industry Volume million units Forecast, by Region 2019 & 2032
- Table 9: Europe Pea Industry Revenue Million Forecast, by Country 2019 & 2032
- Table 10: Europe Pea Industry Volume million units Forecast, by Country 2019 & 2032
- Table 11: Germany Europe Pea Industry Revenue (Million) Forecast, by Application 2019 & 2032
- Table 12: Germany Europe Pea Industry Volume (million units) Forecast, by Application 2019 & 2032
- Table 13: France Europe Pea Industry Revenue (Million) Forecast, by Application 2019 & 2032
- Table 14: France Europe Pea Industry Volume (million units) Forecast, by Application 2019 & 2032
- Table 15: Italy Europe Pea Industry Revenue (Million) Forecast, by Application 2019 & 2032
- Table 16: Italy Europe Pea Industry Volume (million units) Forecast, by Application 2019 & 2032
- Table 17: United Kingdom Europe Pea Industry Revenue (Million) Forecast, by Application 2019 & 2032
- Table 18: United Kingdom Europe Pea Industry Volume (million units) Forecast, by Application 2019 & 2032
- Table 19: Netherlands Europe Pea Industry Revenue (Million) Forecast, by Application 2019 & 2032
- Table 20: Netherlands Europe Pea Industry Volume (million units) Forecast, by Application 2019 & 2032
- Table 21: Sweden Europe Pea Industry Revenue (Million) Forecast, by Application 2019 & 2032
- Table 22: Sweden Europe Pea Industry Volume (million units) Forecast, by Application 2019 & 2032
- Table 23: Rest of Europe Europe Pea Industry Revenue (Million) Forecast, by Application 2019 & 2032
- Table 24: Rest of Europe Europe Pea Industry Volume (million units) Forecast, by Application 2019 & 2032
- Table 25: Europe Pea Industry Revenue Million Forecast, by Russia 2019 & 2032
- Table 26: Europe Pea Industry Volume million units Forecast, by Russia 2019 & 2032
- Table 27: Europe Pea Industry Revenue Million Forecast, by Russia 2019 & 2032
- Table 28: Europe Pea Industry Volume million units Forecast, by Russia 2019 & 2032
- Table 29: Europe Pea Industry Revenue Million Forecast, by Country 2019 & 2032
- Table 30: Europe Pea Industry Volume million units Forecast, by Country 2019 & 2032
- Table 31: United Kingdom Europe Pea Industry Revenue (Million) Forecast, by Application 2019 & 2032
- Table 32: United Kingdom Europe Pea Industry Volume (million units) Forecast, by Application 2019 & 2032
- Table 33: Germany Europe Pea Industry Revenue (Million) Forecast, by Application 2019 & 2032
- Table 34: Germany Europe Pea Industry Volume (million units) Forecast, by Application 2019 & 2032
- Table 35: France Europe Pea Industry Revenue (Million) Forecast, by Application 2019 & 2032
- Table 36: France Europe Pea Industry Volume (million units) Forecast, by Application 2019 & 2032
- Table 37: Italy Europe Pea Industry Revenue (Million) Forecast, by Application 2019 & 2032
- Table 38: Italy Europe Pea Industry Volume (million units) Forecast, by Application 2019 & 2032
- Table 39: Spain Europe Pea Industry Revenue (Million) Forecast, by Application 2019 & 2032
- Table 40: Spain Europe Pea Industry Volume (million units) Forecast, by Application 2019 & 2032
- Table 41: Netherlands Europe Pea Industry Revenue (Million) Forecast, by Application 2019 & 2032
- Table 42: Netherlands Europe Pea Industry Volume (million units) Forecast, by Application 2019 & 2032
- Table 43: Belgium Europe Pea Industry Revenue (Million) Forecast, by Application 2019 & 2032
- Table 44: Belgium Europe Pea Industry Volume (million units) Forecast, by Application 2019 & 2032
- Table 45: Sweden Europe Pea Industry Revenue (Million) Forecast, by Application 2019 & 2032
- Table 46: Sweden Europe Pea Industry Volume (million units) Forecast, by Application 2019 & 2032
- Table 47: Norway Europe Pea Industry Revenue (Million) Forecast, by Application 2019 & 2032
- Table 48: Norway Europe Pea Industry Volume (million units) Forecast, by Application 2019 & 2032
- Table 49: Poland Europe Pea Industry Revenue (Million) Forecast, by Application 2019 & 2032
- Table 50: Poland Europe Pea Industry Volume (million units) Forecast, by Application 2019 & 2032
- Table 51: Denmark Europe Pea Industry Revenue (Million) Forecast, by Application 2019 & 2032
- Table 52: Denmark Europe Pea Industry Volume (million units) Forecast, by Application 2019 & 2032
Frequently Asked Questions
1. What is the projected Compound Annual Growth Rate (CAGR) of the Europe Pea Industry?
The projected CAGR is approximately 6.88%.
2. Which companies are prominent players in the Europe Pea Industry?
Key companies in the market include Sensus, Tereos , Lantmännen , AGRANA, Roquette .
3. What are the main segments of the Europe Pea Industry?
The market segments include Russia, Russia.
4. Can you provide details about the market size?
The market size is estimated to be USD 14.50 Million as of 2022.
5. What are some drivers contributing to market growth?
Rising Consumption of Cashew Nuts in the Country; Favorable Government Initiatives.
6. What are the notable trends driving market growth?
Growing Export Opportunity.
7. Are there any restraints impacting market growth?
Hazardous Climatic Condition Hinders Cashew Production; Stringent Regulations Related to Food Quality Standards.
8. Can you provide examples of recent developments in the market?
October 2022: Roquette, a global leader in plant-based ingredients and a pioneer of plant proteins, launched a new line of organic pea ingredients: organic pea starch and organic pea protein to the Europe market.
9. What pricing options are available for accessing the report?
Pricing options include single-user, multi-user, and enterprise licenses priced at USD 4750, USD 4950, and USD 6800 respectively.
10. Is the market size provided in terms of value or volume?
The market size is provided in terms of value, measured in Million and volume, measured in million units.
11. Are there any specific market keywords associated with the report?
Yes, the market keyword associated with the report is "Europe Pea Industry," which aids in identifying and referencing the specific market segment covered.
12. How do I determine which pricing option suits my needs best?
The pricing options vary based on user requirements and access needs. Individual users may opt for single-user licenses, while businesses requiring broader access may choose multi-user or enterprise licenses for cost-effective access to the report.
13. Are there any additional resources or data provided in the Europe Pea Industry report?
While the report offers comprehensive insights, it's advisable to review the specific contents or supplementary materials provided to ascertain if additional resources or data are available.
14. How can I stay updated on further developments or reports in the Europe Pea Industry?
To stay informed about further developments, trends, and reports in the Europe Pea Industry, consider subscribing to industry newsletters, following relevant companies and organizations, or regularly checking reputable industry news sources and publications.
Methodology
Step 1 - Identification of Relevant Samples Size from Population Database


Step 2 - Approaches for Defining Global Market Size (Value, Volume* & Price*)

Note*: In applicable scenarios
Step 3 - Data Sources
Primary Research
- Web Analytics
- Survey Reports
- Research Institute
- Latest Research Reports
- Opinion Leaders
Secondary Research
- Annual Reports
- White Paper
- Latest Press Release
- Industry Association
- Paid Database
- Investor Presentations

Step 4 - Data Triangulation
Involves using different sources of information in order to increase the validity of a study
These sources are likely to be stakeholders in a program - participants, other researchers, program staff, other community members, and so on.
Then we put all data in single framework & apply various statistical tools to find out the dynamic on the market.
During the analysis stage, feedback from the stakeholder groups would be compared to determine areas of agreement as well as areas of divergence


