
Key Insights
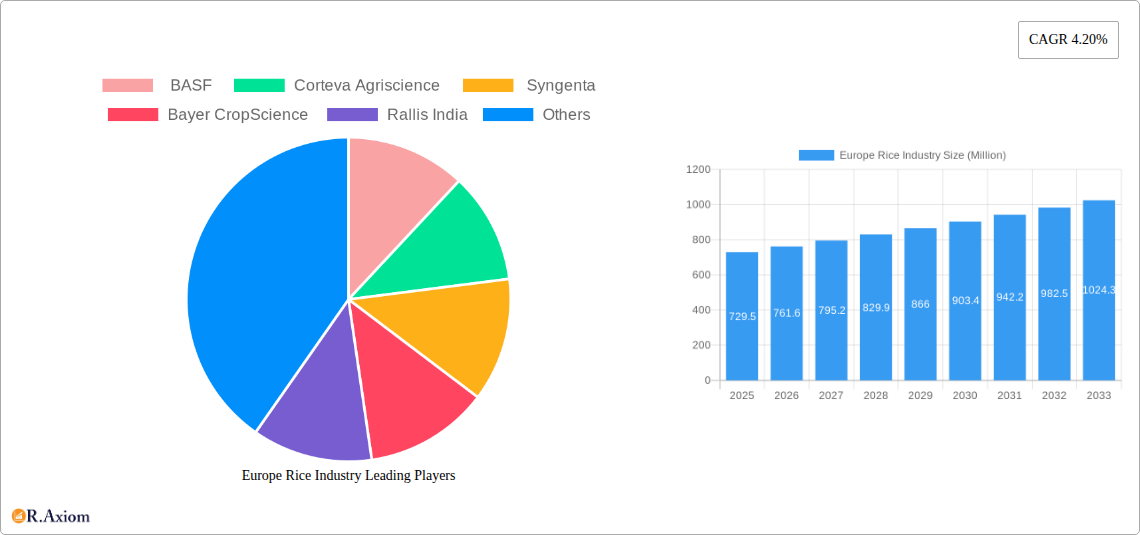
The European rice industry, valued at €729.5 million in 2025, is projected to experience steady growth, driven by increasing consumer demand for convenient and healthy food options, a rising preference for organic and parboiled rice varieties, and the expanding food processing and beverage sectors. The 4.2% CAGR indicates a consistent upward trajectory throughout the forecast period (2025-2033). Key segments fueling this growth include parboiled rice, favored for its longer shelf life and nutritional benefits, and organic rice, capitalizing on the growing health-conscious consumer base. The food and beverage sector dominates application, with significant contributions from the animal feed industry. Leading players like BASF, Corteva Agriscience, Syngenta, Bayer CropScience, and Rallis India are strategically investing in research and development, focusing on improved crop yields, disease resistance, and sustainable farming practices to maintain their market share. Competition is intense, with companies focusing on brand building, product differentiation, and efficient supply chains to secure their position in this evolving market.
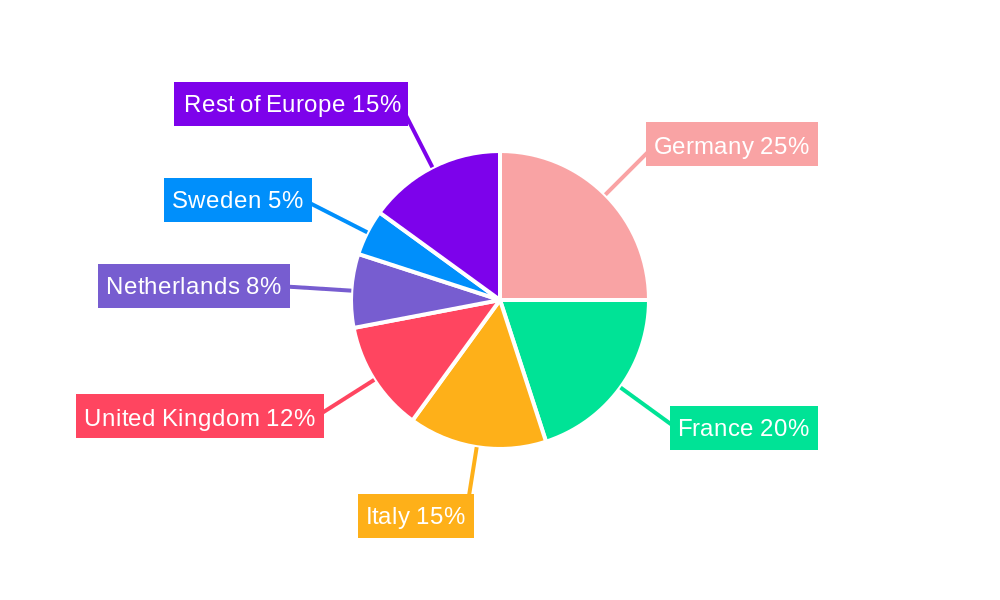
Growth in specific European nations will vary. Germany, France, Italy, and the United Kingdom are likely to be the major contributors to the overall market value, driven by higher per capita consumption and a robust food processing industry. However, smaller markets within the "Rest of Europe" category present significant opportunities for expansion, particularly in countries experiencing rising disposable incomes and changing dietary habits. Challenges include fluctuations in rice prices due to global market volatility and environmental factors impacting crop yields. The industry’s focus on sustainable practices and addressing these challenges will be crucial for long-term, sustainable growth.
Europe Rice Industry: A Comprehensive Market Analysis (2019-2033)
This in-depth report provides a comprehensive analysis of the Europe rice industry, offering invaluable insights for stakeholders, investors, and industry professionals. The study covers the period 2019-2033, with a base year of 2025 and a forecast period spanning 2025-2033. The report meticulously examines market dynamics, competitive landscapes, and future growth potential, leveraging extensive data analysis and expert insights. Key segments analyzed include parboiled rice, organic rice, and conventional rice, across food & beverage and animal feed applications. Leading players like BASF, Corteva Agriscience, Syngenta, Bayer CropScience, and Rallis India are profiled, providing a 360-degree view of the market.
Europe Rice Industry Market Concentration & Innovation
The Europe rice industry exhibits a moderately concentrated market structure, with a few major players holding significant market share. BASF, Corteva Agriscience, and Syngenta collectively account for approximately xx% of the market in 2025. However, the market is witnessing increasing competition from regional players and new entrants, especially in the organic and specialty rice segments. Innovation is driven by consumer demand for healthier and more sustainable rice options, leading to advancements in rice cultivation techniques, processing methods, and product formulations. Stringent regulatory frameworks concerning food safety and environmental sustainability are shaping industry practices. Product substitutes like other grains and pasta present competitive challenges, while rising health consciousness and increasing demand for convenience foods are fueling market growth. M&A activity within the sector has been relatively moderate in recent years, with the largest deal valued at approximately xx Million in 2023.
- Market Concentration: xx% controlled by top 3 players in 2025.
- Innovation Drivers: Consumer demand for organic and sustainable rice; advancements in rice cultivation and processing.
- Regulatory Framework: Stringent food safety and environmental regulations impacting production practices.
- M&A Activity: Largest deal valued at approximately xx Million (2023).
Europe Rice Industry Industry Trends & Insights
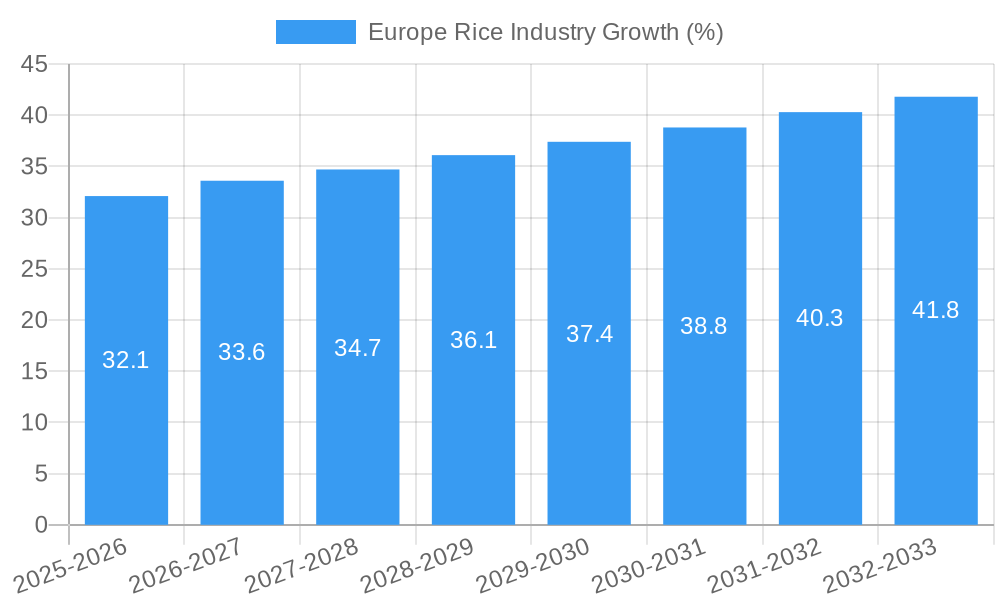
The Europe rice industry is experiencing steady growth, projected to achieve a CAGR of xx% during the forecast period (2025-2033). Key growth drivers include rising consumer disposable incomes, increasing preference for rice-based foods, and expanding food processing and retail sectors. Technological advancements in rice cultivation, such as precision agriculture and improved irrigation techniques, are boosting productivity and yield. Consumer preferences are shifting towards healthier and more convenient rice options, driving demand for organic, parboiled, and functional rice varieties. The market is witnessing increased competition, with both established players and new entrants vying for market share. Market penetration of organic rice is increasing steadily, with a projected penetration rate of xx% by 2033. This is largely due to the growing awareness of health benefits and environmental sustainability.
Dominant Markets & Segments in Europe Rice Industry
The Germany market currently holds the largest share within the Europe rice industry, driven by strong consumer demand, well-established distribution networks, and favorable economic conditions. Within the product types, conventional rice dominates the market, accounting for the largest volume share. However, the organic rice segment is experiencing the fastest growth rate, fueled by the increasing health consciousness of consumers. In terms of applications, the food & beverage sector is the dominant end-use segment, while the animal feed sector shows promising growth potential.
- Germany: Leading market due to high demand, strong distribution, and favorable economic conditions.
- Conventional Rice: Dominates by volume, but organic rice shows the fastest growth.
- Food & Beverage: Largest application segment, with animal feed showing strong growth prospects.
- Key Drivers (Germany): Strong domestic consumption, well-developed retail infrastructure, supportive government policies.
Europe Rice Industry Product Developments
Recent product innovations focus on enhancing rice quality, extending shelf life, and meeting consumer demand for healthier and more convenient options. This includes the development of fortified rice with added nutrients, pre-cooked and ready-to-eat rice varieties, and organic and sustainably sourced rice. These developments are driven by technological advancements in rice processing and packaging, as well as an increased focus on sustainable agriculture practices. Companies are emphasizing the health benefits and convenience factors in their marketing strategies to attract health-conscious consumers and busy lifestyles.
Report Scope & Segmentation Analysis
This report provides a detailed segmentation analysis of the Europe rice industry across product type (Parboiled Rice, Organic Rice, Conventional Rice) and application (Food & Beverage, Animal Feed). Each segment is analyzed based on market size, growth rate, and competitive dynamics.
- Parboiled Rice: This segment is characterized by its longer shelf life and nutritional benefits, leading to steady growth.
- Organic Rice: This segment witnesses the highest growth rate due to the increasing demand for healthy and sustainable food products.
- Conventional Rice: This segment remains dominant due to its affordability and wide availability.
- Food & Beverage: This segment accounts for the largest share of rice consumption, and continued growth is expected.
- Animal Feed: This segment demonstrates moderate growth driven by rising demand for animal feed ingredients.
Key Drivers of Europe Rice Industry Growth
Several factors contribute to the growth of the Europe rice industry, including rising disposable incomes boosting consumer spending on food, changing dietary habits with a preference for rice-based meals, and technological advancements in cultivation and processing enhancing efficiency and yields. Government initiatives promoting sustainable agriculture practices also support growth. The expanding food processing and retail sector provides distribution channels for rice products, further fueling market expansion.
Challenges in the Europe Rice Industry Sector
The Europe rice industry faces challenges such as fluctuating rice prices influenced by global supply and demand, increasing competition from other grain alternatives, and stringent regulations on food safety and environmental standards impacting production costs. Supply chain disruptions and climate change pose additional threats to rice production and availability, potentially affecting market stability and prices. Competition from imported rice with lower prices can impact the profitability of domestic producers.
Emerging Opportunities in Europe Rice Industry
Emerging opportunities exist in the development and marketing of specialized rice varieties like functional rice, enriched with vitamins and minerals, catering to the growing demand for healthier food options. Technological advancements in precision agriculture and improved farming practices offer potential for increased yields and efficiency. Exploring new markets and export opportunities in underserved regions could also unlock significant growth potential.
Leading Players in the Europe Rice Industry Market
- BASF
- Corteva Agriscience
- Syngenta
- Bayer CropScience
- Rallis India
Key Developments in Europe Rice Industry Industry
- 2022 Q4: Syngenta launches a new high-yield rice variety.
- 2023 Q1: BASF invests in advanced rice processing technology.
- 2023 Q3: Corteva Agriscience partners with a regional producer to expand organic rice production.
Strategic Outlook for Europe Rice Industry Market
The Europe rice industry is poised for continued growth driven by increasing consumer demand, technological advancements, and favorable economic conditions. Companies focusing on product innovation, sustainable production practices, and effective marketing strategies are well-positioned to capitalize on emerging opportunities. Expansion into new markets and diversification into value-added rice products will be key to long-term success.
Europe Rice Industry Segmentation
- 1. Production Analysis
- 2. Consumption Analysis
- 3. Import Market Analysis (Value & Volume)
- 4. Export Market Analysis (Value & Volume)
- 5. Price Trend Analysis
Europe Rice Industry Segmentation By Geography
- 1. Belgium
- 2. United Kingdom
- 3. France
- 4. Italy
- 5. Germany
- 6. Spain
Europe Rice Industry REPORT HIGHLIGHTS
| Aspects | Details |
|---|---|
| Study Period | 2019-2033 |
| Base Year | 2024 |
| Estimated Year | 2025 |
| Forecast Period | 2025-2033 |
| Historical Period | 2019-2024 |
| Growth Rate | CAGR of 4.20% from 2019-2033 |
| Segmentation |
|
Table of Contents
- 1. Introduction
- 1.1. Research Scope
- 1.2. Market Segmentation
- 1.3. Research Methodology
- 1.4. Definitions and Assumptions
- 2. Executive Summary
- 2.1. Introduction
- 3. Market Dynamics
- 3.1. Introduction
- 3.2. Market Drivers
- 3.2.1. Rising Consumption of Cashew Nuts in the Country; Favorable Government Initiatives
- 3.3. Market Restrains
- 3.3.1. Hazardous Climatic Condition Hinders Cashew Production; Stringent Regulations Related to Food Quality Standards
- 3.4. Market Trends
- 3.4.1. Strong Demand in Northwestern Europe
- 4. Market Factor Analysis
- 4.1. Porters Five Forces
- 4.2. Supply/Value Chain
- 4.3. PESTEL analysis
- 4.4. Market Entropy
- 4.5. Patent/Trademark Analysis
- 5. Europe Rice Industry Analysis, Insights and Forecast, 2019-2031
- 5.1. Market Analysis, Insights and Forecast - by Production Analysis
- 5.2. Market Analysis, Insights and Forecast - by Consumption Analysis
- 5.3. Market Analysis, Insights and Forecast - by Import Market Analysis (Value & Volume)
- 5.4. Market Analysis, Insights and Forecast - by Export Market Analysis (Value & Volume)
- 5.5. Market Analysis, Insights and Forecast - by Price Trend Analysis
- 5.6. Market Analysis, Insights and Forecast - by Region
- 5.6.1. Belgium
- 5.6.2. United Kingdom
- 5.6.3. France
- 5.6.4. Italy
- 5.6.5. Germany
- 5.6.6. Spain
- 5.1. Market Analysis, Insights and Forecast - by Production Analysis
- 6. Belgium Europe Rice Industry Analysis, Insights and Forecast, 2019-2031
- 6.1. Market Analysis, Insights and Forecast - by Production Analysis
- 6.2. Market Analysis, Insights and Forecast - by Consumption Analysis
- 6.3. Market Analysis, Insights and Forecast - by Import Market Analysis (Value & Volume)
- 6.4. Market Analysis, Insights and Forecast - by Export Market Analysis (Value & Volume)
- 6.5. Market Analysis, Insights and Forecast - by Price Trend Analysis
- 6.1. Market Analysis, Insights and Forecast - by Production Analysis
- 7. United Kingdom Europe Rice Industry Analysis, Insights and Forecast, 2019-2031
- 7.1. Market Analysis, Insights and Forecast - by Production Analysis
- 7.2. Market Analysis, Insights and Forecast - by Consumption Analysis
- 7.3. Market Analysis, Insights and Forecast - by Import Market Analysis (Value & Volume)
- 7.4. Market Analysis, Insights and Forecast - by Export Market Analysis (Value & Volume)
- 7.5. Market Analysis, Insights and Forecast - by Price Trend Analysis
- 7.1. Market Analysis, Insights and Forecast - by Production Analysis
- 8. France Europe Rice Industry Analysis, Insights and Forecast, 2019-2031
- 8.1. Market Analysis, Insights and Forecast - by Production Analysis
- 8.2. Market Analysis, Insights and Forecast - by Consumption Analysis
- 8.3. Market Analysis, Insights and Forecast - by Import Market Analysis (Value & Volume)
- 8.4. Market Analysis, Insights and Forecast - by Export Market Analysis (Value & Volume)
- 8.5. Market Analysis, Insights and Forecast - by Price Trend Analysis
- 8.1. Market Analysis, Insights and Forecast - by Production Analysis
- 9. Italy Europe Rice Industry Analysis, Insights and Forecast, 2019-2031
- 9.1. Market Analysis, Insights and Forecast - by Production Analysis
- 9.2. Market Analysis, Insights and Forecast - by Consumption Analysis
- 9.3. Market Analysis, Insights and Forecast - by Import Market Analysis (Value & Volume)
- 9.4. Market Analysis, Insights and Forecast - by Export Market Analysis (Value & Volume)
- 9.5. Market Analysis, Insights and Forecast - by Price Trend Analysis
- 9.1. Market Analysis, Insights and Forecast - by Production Analysis
- 10. Germany Europe Rice Industry Analysis, Insights and Forecast, 2019-2031
- 10.1. Market Analysis, Insights and Forecast - by Production Analysis
- 10.2. Market Analysis, Insights and Forecast - by Consumption Analysis
- 10.3. Market Analysis, Insights and Forecast - by Import Market Analysis (Value & Volume)
- 10.4. Market Analysis, Insights and Forecast - by Export Market Analysis (Value & Volume)
- 10.5. Market Analysis, Insights and Forecast - by Price Trend Analysis
- 10.1. Market Analysis, Insights and Forecast - by Production Analysis
- 11. Spain Europe Rice Industry Analysis, Insights and Forecast, 2019-2031
- 11.1. Market Analysis, Insights and Forecast - by Production Analysis
- 11.2. Market Analysis, Insights and Forecast - by Consumption Analysis
- 11.3. Market Analysis, Insights and Forecast - by Import Market Analysis (Value & Volume)
- 11.4. Market Analysis, Insights and Forecast - by Export Market Analysis (Value & Volume)
- 11.5. Market Analysis, Insights and Forecast - by Price Trend Analysis
- 11.1. Market Analysis, Insights and Forecast - by Production Analysis
- 12. Germany Europe Rice Industry Analysis, Insights and Forecast, 2019-2031
- 13. France Europe Rice Industry Analysis, Insights and Forecast, 2019-2031
- 14. Italy Europe Rice Industry Analysis, Insights and Forecast, 2019-2031
- 15. United Kingdom Europe Rice Industry Analysis, Insights and Forecast, 2019-2031
- 16. Netherlands Europe Rice Industry Analysis, Insights and Forecast, 2019-2031
- 17. Sweden Europe Rice Industry Analysis, Insights and Forecast, 2019-2031
- 18. Rest of Europe Europe Rice Industry Analysis, Insights and Forecast, 2019-2031
- 19. Competitive Analysis
- 19.1. Market Share Analysis 2024
- 19.2. Company Profiles
- 19.2.1 BASF
- 19.2.1.1. Overview
- 19.2.1.2. Products
- 19.2.1.3. SWOT Analysis
- 19.2.1.4. Recent Developments
- 19.2.1.5. Financials (Based on Availability)
- 19.2.2 Corteva Agriscience
- 19.2.2.1. Overview
- 19.2.2.2. Products
- 19.2.2.3. SWOT Analysis
- 19.2.2.4. Recent Developments
- 19.2.2.5. Financials (Based on Availability)
- 19.2.3 Syngenta
- 19.2.3.1. Overview
- 19.2.3.2. Products
- 19.2.3.3. SWOT Analysis
- 19.2.3.4. Recent Developments
- 19.2.3.5. Financials (Based on Availability)
- 19.2.4 Bayer CropScience
- 19.2.4.1. Overview
- 19.2.4.2. Products
- 19.2.4.3. SWOT Analysis
- 19.2.4.4. Recent Developments
- 19.2.4.5. Financials (Based on Availability)
- 19.2.5 Rallis India
- 19.2.5.1. Overview
- 19.2.5.2. Products
- 19.2.5.3. SWOT Analysis
- 19.2.5.4. Recent Developments
- 19.2.5.5. Financials (Based on Availability)
- 19.2.1 BASF
List of Figures
- Figure 1: Europe Rice Industry Revenue Breakdown (Million, %) by Product 2024 & 2032
- Figure 2: Europe Rice Industry Share (%) by Company 2024
List of Tables
- Table 1: Europe Rice Industry Revenue Million Forecast, by Region 2019 & 2032
- Table 2: Europe Rice Industry Volume Kiloton Forecast, by Region 2019 & 2032
- Table 3: Europe Rice Industry Revenue Million Forecast, by Production Analysis 2019 & 2032
- Table 4: Europe Rice Industry Volume Kiloton Forecast, by Production Analysis 2019 & 2032
- Table 5: Europe Rice Industry Revenue Million Forecast, by Consumption Analysis 2019 & 2032
- Table 6: Europe Rice Industry Volume Kiloton Forecast, by Consumption Analysis 2019 & 2032
- Table 7: Europe Rice Industry Revenue Million Forecast, by Import Market Analysis (Value & Volume) 2019 & 2032
- Table 8: Europe Rice Industry Volume Kiloton Forecast, by Import Market Analysis (Value & Volume) 2019 & 2032
- Table 9: Europe Rice Industry Revenue Million Forecast, by Export Market Analysis (Value & Volume) 2019 & 2032
- Table 10: Europe Rice Industry Volume Kiloton Forecast, by Export Market Analysis (Value & Volume) 2019 & 2032
- Table 11: Europe Rice Industry Revenue Million Forecast, by Price Trend Analysis 2019 & 2032
- Table 12: Europe Rice Industry Volume Kiloton Forecast, by Price Trend Analysis 2019 & 2032
- Table 13: Europe Rice Industry Revenue Million Forecast, by Region 2019 & 2032
- Table 14: Europe Rice Industry Volume Kiloton Forecast, by Region 2019 & 2032
- Table 15: Europe Rice Industry Revenue Million Forecast, by Country 2019 & 2032
- Table 16: Europe Rice Industry Volume Kiloton Forecast, by Country 2019 & 2032
- Table 17: Germany Europe Rice Industry Revenue (Million) Forecast, by Application 2019 & 2032
- Table 18: Germany Europe Rice Industry Volume (Kiloton) Forecast, by Application 2019 & 2032
- Table 19: France Europe Rice Industry Revenue (Million) Forecast, by Application 2019 & 2032
- Table 20: France Europe Rice Industry Volume (Kiloton) Forecast, by Application 2019 & 2032
- Table 21: Italy Europe Rice Industry Revenue (Million) Forecast, by Application 2019 & 2032
- Table 22: Italy Europe Rice Industry Volume (Kiloton) Forecast, by Application 2019 & 2032
- Table 23: United Kingdom Europe Rice Industry Revenue (Million) Forecast, by Application 2019 & 2032
- Table 24: United Kingdom Europe Rice Industry Volume (Kiloton) Forecast, by Application 2019 & 2032
- Table 25: Netherlands Europe Rice Industry Revenue (Million) Forecast, by Application 2019 & 2032
- Table 26: Netherlands Europe Rice Industry Volume (Kiloton) Forecast, by Application 2019 & 2032
- Table 27: Sweden Europe Rice Industry Revenue (Million) Forecast, by Application 2019 & 2032
- Table 28: Sweden Europe Rice Industry Volume (Kiloton) Forecast, by Application 2019 & 2032
- Table 29: Rest of Europe Europe Rice Industry Revenue (Million) Forecast, by Application 2019 & 2032
- Table 30: Rest of Europe Europe Rice Industry Volume (Kiloton) Forecast, by Application 2019 & 2032
- Table 31: Europe Rice Industry Revenue Million Forecast, by Production Analysis 2019 & 2032
- Table 32: Europe Rice Industry Volume Kiloton Forecast, by Production Analysis 2019 & 2032
- Table 33: Europe Rice Industry Revenue Million Forecast, by Consumption Analysis 2019 & 2032
- Table 34: Europe Rice Industry Volume Kiloton Forecast, by Consumption Analysis 2019 & 2032
- Table 35: Europe Rice Industry Revenue Million Forecast, by Import Market Analysis (Value & Volume) 2019 & 2032
- Table 36: Europe Rice Industry Volume Kiloton Forecast, by Import Market Analysis (Value & Volume) 2019 & 2032
- Table 37: Europe Rice Industry Revenue Million Forecast, by Export Market Analysis (Value & Volume) 2019 & 2032
- Table 38: Europe Rice Industry Volume Kiloton Forecast, by Export Market Analysis (Value & Volume) 2019 & 2032
- Table 39: Europe Rice Industry Revenue Million Forecast, by Price Trend Analysis 2019 & 2032
- Table 40: Europe Rice Industry Volume Kiloton Forecast, by Price Trend Analysis 2019 & 2032
- Table 41: Europe Rice Industry Revenue Million Forecast, by Country 2019 & 2032
- Table 42: Europe Rice Industry Volume Kiloton Forecast, by Country 2019 & 2032
- Table 43: Europe Rice Industry Revenue Million Forecast, by Production Analysis 2019 & 2032
- Table 44: Europe Rice Industry Volume Kiloton Forecast, by Production Analysis 2019 & 2032
- Table 45: Europe Rice Industry Revenue Million Forecast, by Consumption Analysis 2019 & 2032
- Table 46: Europe Rice Industry Volume Kiloton Forecast, by Consumption Analysis 2019 & 2032
- Table 47: Europe Rice Industry Revenue Million Forecast, by Import Market Analysis (Value & Volume) 2019 & 2032
- Table 48: Europe Rice Industry Volume Kiloton Forecast, by Import Market Analysis (Value & Volume) 2019 & 2032
- Table 49: Europe Rice Industry Revenue Million Forecast, by Export Market Analysis (Value & Volume) 2019 & 2032
- Table 50: Europe Rice Industry Volume Kiloton Forecast, by Export Market Analysis (Value & Volume) 2019 & 2032
- Table 51: Europe Rice Industry Revenue Million Forecast, by Price Trend Analysis 2019 & 2032
- Table 52: Europe Rice Industry Volume Kiloton Forecast, by Price Trend Analysis 2019 & 2032
- Table 53: Europe Rice Industry Revenue Million Forecast, by Country 2019 & 2032
- Table 54: Europe Rice Industry Volume Kiloton Forecast, by Country 2019 & 2032
- Table 55: Europe Rice Industry Revenue Million Forecast, by Production Analysis 2019 & 2032
- Table 56: Europe Rice Industry Volume Kiloton Forecast, by Production Analysis 2019 & 2032
- Table 57: Europe Rice Industry Revenue Million Forecast, by Consumption Analysis 2019 & 2032
- Table 58: Europe Rice Industry Volume Kiloton Forecast, by Consumption Analysis 2019 & 2032
- Table 59: Europe Rice Industry Revenue Million Forecast, by Import Market Analysis (Value & Volume) 2019 & 2032
- Table 60: Europe Rice Industry Volume Kiloton Forecast, by Import Market Analysis (Value & Volume) 2019 & 2032
- Table 61: Europe Rice Industry Revenue Million Forecast, by Export Market Analysis (Value & Volume) 2019 & 2032
- Table 62: Europe Rice Industry Volume Kiloton Forecast, by Export Market Analysis (Value & Volume) 2019 & 2032
- Table 63: Europe Rice Industry Revenue Million Forecast, by Price Trend Analysis 2019 & 2032
- Table 64: Europe Rice Industry Volume Kiloton Forecast, by Price Trend Analysis 2019 & 2032
- Table 65: Europe Rice Industry Revenue Million Forecast, by Country 2019 & 2032
- Table 66: Europe Rice Industry Volume Kiloton Forecast, by Country 2019 & 2032
- Table 67: Europe Rice Industry Revenue Million Forecast, by Production Analysis 2019 & 2032
- Table 68: Europe Rice Industry Volume Kiloton Forecast, by Production Analysis 2019 & 2032
- Table 69: Europe Rice Industry Revenue Million Forecast, by Consumption Analysis 2019 & 2032
- Table 70: Europe Rice Industry Volume Kiloton Forecast, by Consumption Analysis 2019 & 2032
- Table 71: Europe Rice Industry Revenue Million Forecast, by Import Market Analysis (Value & Volume) 2019 & 2032
- Table 72: Europe Rice Industry Volume Kiloton Forecast, by Import Market Analysis (Value & Volume) 2019 & 2032
- Table 73: Europe Rice Industry Revenue Million Forecast, by Export Market Analysis (Value & Volume) 2019 & 2032
- Table 74: Europe Rice Industry Volume Kiloton Forecast, by Export Market Analysis (Value & Volume) 2019 & 2032
- Table 75: Europe Rice Industry Revenue Million Forecast, by Price Trend Analysis 2019 & 2032
- Table 76: Europe Rice Industry Volume Kiloton Forecast, by Price Trend Analysis 2019 & 2032
- Table 77: Europe Rice Industry Revenue Million Forecast, by Country 2019 & 2032
- Table 78: Europe Rice Industry Volume Kiloton Forecast, by Country 2019 & 2032
- Table 79: Europe Rice Industry Revenue Million Forecast, by Production Analysis 2019 & 2032
- Table 80: Europe Rice Industry Volume Kiloton Forecast, by Production Analysis 2019 & 2032
- Table 81: Europe Rice Industry Revenue Million Forecast, by Consumption Analysis 2019 & 2032
- Table 82: Europe Rice Industry Volume Kiloton Forecast, by Consumption Analysis 2019 & 2032
- Table 83: Europe Rice Industry Revenue Million Forecast, by Import Market Analysis (Value & Volume) 2019 & 2032
- Table 84: Europe Rice Industry Volume Kiloton Forecast, by Import Market Analysis (Value & Volume) 2019 & 2032
- Table 85: Europe Rice Industry Revenue Million Forecast, by Export Market Analysis (Value & Volume) 2019 & 2032
- Table 86: Europe Rice Industry Volume Kiloton Forecast, by Export Market Analysis (Value & Volume) 2019 & 2032
- Table 87: Europe Rice Industry Revenue Million Forecast, by Price Trend Analysis 2019 & 2032
- Table 88: Europe Rice Industry Volume Kiloton Forecast, by Price Trend Analysis 2019 & 2032
- Table 89: Europe Rice Industry Revenue Million Forecast, by Country 2019 & 2032
- Table 90: Europe Rice Industry Volume Kiloton Forecast, by Country 2019 & 2032
- Table 91: Europe Rice Industry Revenue Million Forecast, by Production Analysis 2019 & 2032
- Table 92: Europe Rice Industry Volume Kiloton Forecast, by Production Analysis 2019 & 2032
- Table 93: Europe Rice Industry Revenue Million Forecast, by Consumption Analysis 2019 & 2032
- Table 94: Europe Rice Industry Volume Kiloton Forecast, by Consumption Analysis 2019 & 2032
- Table 95: Europe Rice Industry Revenue Million Forecast, by Import Market Analysis (Value & Volume) 2019 & 2032
- Table 96: Europe Rice Industry Volume Kiloton Forecast, by Import Market Analysis (Value & Volume) 2019 & 2032
- Table 97: Europe Rice Industry Revenue Million Forecast, by Export Market Analysis (Value & Volume) 2019 & 2032
- Table 98: Europe Rice Industry Volume Kiloton Forecast, by Export Market Analysis (Value & Volume) 2019 & 2032
- Table 99: Europe Rice Industry Revenue Million Forecast, by Price Trend Analysis 2019 & 2032
- Table 100: Europe Rice Industry Volume Kiloton Forecast, by Price Trend Analysis 2019 & 2032
- Table 101: Europe Rice Industry Revenue Million Forecast, by Country 2019 & 2032
- Table 102: Europe Rice Industry Volume Kiloton Forecast, by Country 2019 & 2032
Frequently Asked Questions
1. What is the projected Compound Annual Growth Rate (CAGR) of the Europe Rice Industry?
The projected CAGR is approximately 4.20%.
2. Which companies are prominent players in the Europe Rice Industry?
Key companies in the market include BASF , Corteva Agriscience , Syngenta, Bayer CropScience , Rallis India.
3. What are the main segments of the Europe Rice Industry?
The market segments include Production Analysis, Consumption Analysis, Import Market Analysis (Value & Volume), Export Market Analysis (Value & Volume), Price Trend Analysis.
4. Can you provide details about the market size?
The market size is estimated to be USD 729.50 Million as of 2022.
5. What are some drivers contributing to market growth?
Rising Consumption of Cashew Nuts in the Country; Favorable Government Initiatives.
6. What are the notable trends driving market growth?
Strong Demand in Northwestern Europe.
7. Are there any restraints impacting market growth?
Hazardous Climatic Condition Hinders Cashew Production; Stringent Regulations Related to Food Quality Standards.
8. Can you provide examples of recent developments in the market?
N/A
9. What pricing options are available for accessing the report?
Pricing options include single-user, multi-user, and enterprise licenses priced at USD 4750, USD 5250, and USD 8750 respectively.
10. Is the market size provided in terms of value or volume?
The market size is provided in terms of value, measured in Million and volume, measured in Kiloton.
11. Are there any specific market keywords associated with the report?
Yes, the market keyword associated with the report is "Europe Rice Industry," which aids in identifying and referencing the specific market segment covered.
12. How do I determine which pricing option suits my needs best?
The pricing options vary based on user requirements and access needs. Individual users may opt for single-user licenses, while businesses requiring broader access may choose multi-user or enterprise licenses for cost-effective access to the report.
13. Are there any additional resources or data provided in the Europe Rice Industry report?
While the report offers comprehensive insights, it's advisable to review the specific contents or supplementary materials provided to ascertain if additional resources or data are available.
14. How can I stay updated on further developments or reports in the Europe Rice Industry?
To stay informed about further developments, trends, and reports in the Europe Rice Industry, consider subscribing to industry newsletters, following relevant companies and organizations, or regularly checking reputable industry news sources and publications.
Methodology
Step 1 - Identification of Relevant Samples Size from Population Database


Step 2 - Approaches for Defining Global Market Size (Value, Volume* & Price*)

Note*: In applicable scenarios
Step 3 - Data Sources
Primary Research
- Web Analytics
- Survey Reports
- Research Institute
- Latest Research Reports
- Opinion Leaders
Secondary Research
- Annual Reports
- White Paper
- Latest Press Release
- Industry Association
- Paid Database
- Investor Presentations

Step 4 - Data Triangulation
Involves using different sources of information in order to increase the validity of a study
These sources are likely to be stakeholders in a program - participants, other researchers, program staff, other community members, and so on.
Then we put all data in single framework & apply various statistical tools to find out the dynamic on the market.
During the analysis stage, feedback from the stakeholder groups would be compared to determine areas of agreement as well as areas of divergence


