

Key Insights
The global eyeglass lenses market is a significant and expanding sector, projected to reach $21.25 billion by 2024, with a Compound Annual Growth Rate (CAGR) of 7.33%. This growth is propelled by the increasing incidence of refractive errors, a growing aging population, and continuous advancements in lens technology. Key drivers include rising urbanization, increased screen time, and the demand for advanced lens types such as high-index and progressive lenses. The market is segmented by lens type (single vision, progressive, bifocal), material (glass, plastic, polycarbonate), and distribution channel (optical stores, online retailers, hospitals). Major players like Essilor, ZEISS, and HOYA are prominent due to their technological prowess and distribution networks. While North America and Europe currently lead in consumption, emerging economies in Asia and Latin America present substantial future growth opportunities.
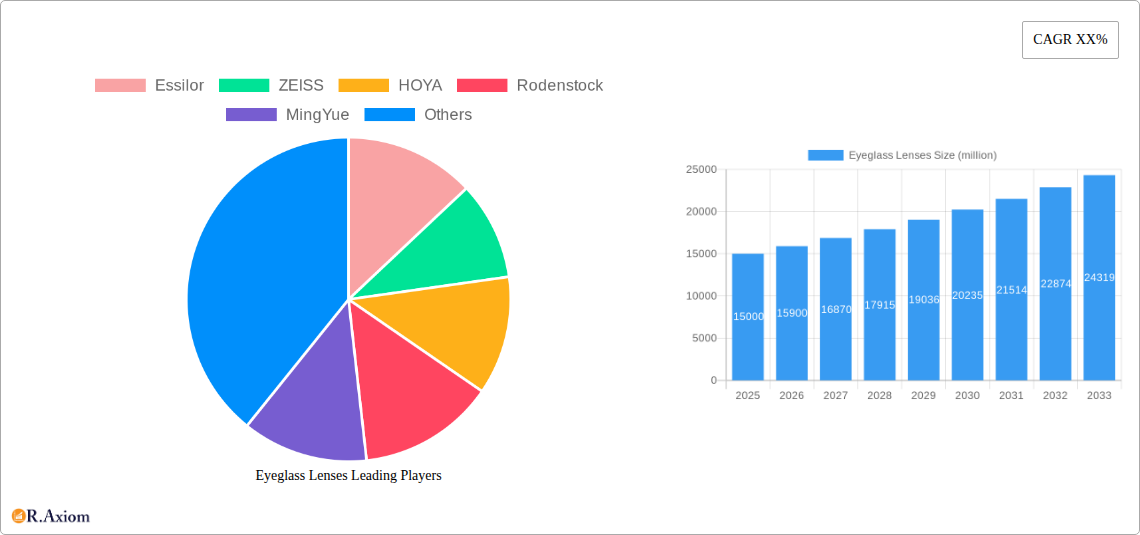
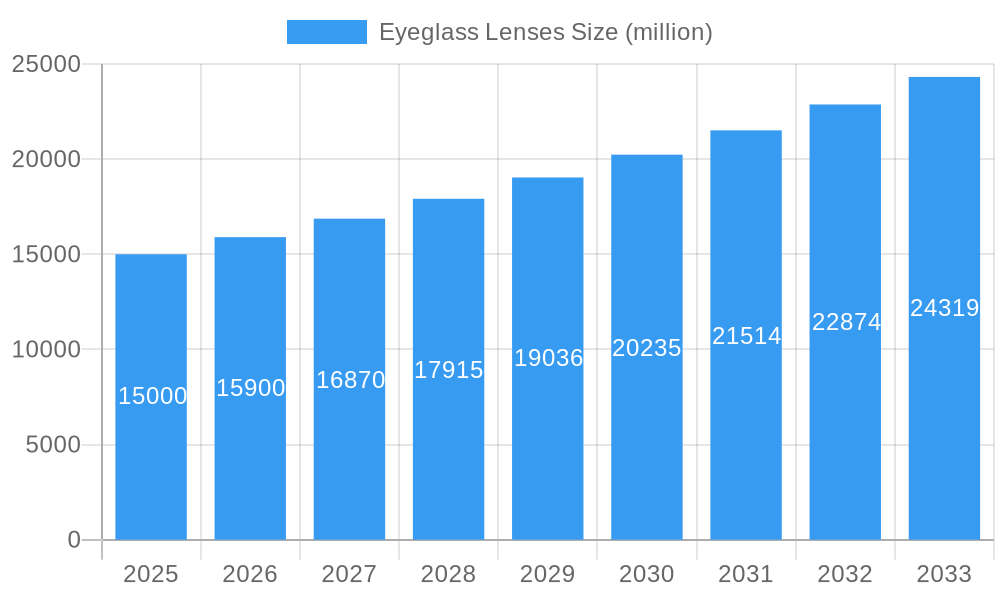
Eyeglass Lenses Market Size (In Billion)
Despite robust growth, the market faces challenges including price sensitivity, competition from generic brands, and stringent regulatory requirements. Opportunities for expansion lie in personalized lens design through advanced technologies like 3D mapping, further enhancing customer satisfaction and market penetration. Strategic market entry into untapped regions and targeted marketing campaigns promoting vision care awareness are crucial for future success. Continued growth is anticipated, fueled by improved global healthcare access and ongoing innovation in lens manufacturing and design, presenting a promising market for industry participants.
Eyeglass Lenses Company Market Share
Eyeglass Lenses Market Report: 2019-2033 - A Comprehensive Analysis
This comprehensive report provides an in-depth analysis of the global eyeglass lenses market from 2019 to 2033, offering invaluable insights for industry stakeholders, investors, and businesses seeking to capitalize on emerging opportunities. The report meticulously examines market concentration, innovation, trends, dominant segments, and leading players, incorporating detailed forecasts and actionable recommendations. With a study period spanning 2019-2033, a base year of 2025, and a forecast period of 2025-2033, this report is an essential resource for navigating the complexities of this dynamic market. The report leverages extensive data analysis and expert insights to provide a clear and concise overview of the market's trajectory. The total market value is estimated at xx million in 2025 and is projected to reach xx million by 2033.
Eyeglass Lenses Market Concentration & Innovation
The global eyeglass lenses market exhibits a moderately concentrated structure, with key players like Essilor, ZEISS, and HOYA commanding significant market share. The combined market share of the top five players is estimated at xx%. Innovation plays a crucial role, driven by advancements in materials science (e.g., high-index lenses, photochromic lenses), lens design (e.g., progressive lenses, freeform lenses), and anti-reflective coatings. Regulatory frameworks, particularly those related to safety and quality standards, significantly influence market dynamics. Product substitutes, such as contact lenses and refractive surgery, pose competitive challenges. End-user trends, including increasing demand for specialized lenses (e.g., blue light filtering lenses) and personalized eye care solutions, shape market growth. M&A activities within the industry have been relatively frequent in recent years, with deal values exceeding xx million in the period 2019-2024. This consolidation is expected to continue, further shaping the competitive landscape.
- Market Share (2025): Essilor (xx%), ZEISS (xx%), HOYA (xx%), Rodenstock (xx%), Others (xx%)
- M&A Deal Value (2019-2024): xx million
- Key Innovation Drivers: Material science advancements, lens design improvements, coating technologies
Eyeglass Lenses Industry Trends & Insights
The eyeglass lenses market is experiencing robust growth, driven by factors such as rising prevalence of refractive errors, increasing geriatric population, and growing awareness of eye health. The Compound Annual Growth Rate (CAGR) during the forecast period (2025-2033) is projected at xx%. Technological advancements, such as the introduction of digitally customized lenses and personalized lens designs, are revolutionizing the industry. Consumer preferences are shifting towards high-quality, technologically advanced lenses with enhanced features like blue light protection and UV filtering. Competitive dynamics are characterized by intense rivalry among established players and the emergence of new entrants focusing on niche segments. Market penetration of progressive lenses and other advanced lens types continues to increase, indicating a growing preference for sophisticated vision correction solutions. The market is experiencing a significant shift towards online sales channels and direct-to-consumer models, impacting traditional retail distribution patterns.
Dominant Markets & Segments in Eyeglass Lenses
The North American region currently holds the largest market share, driven by high per capita income, advanced healthcare infrastructure, and strong demand for technologically advanced lenses. Within North America, the United States constitutes the largest market, followed by Canada. Key growth drivers in this region include robust consumer spending, increasing adoption of eye care insurance, and a high prevalence of refractive errors.
- Key Drivers in North America:
- High per capita income
- Advanced healthcare infrastructure
- Strong demand for technologically advanced lenses
- Increasing adoption of eye care insurance
- High prevalence of refractive errors
The dominance of North America is primarily attributed to several factors, including high disposable income enabling consumers to invest in premium eyeglass lenses, a well-established optical retail network, and strong regulatory frameworks promoting eye care standards. Furthermore, the significant presence of major lens manufacturers and research institutions within the region drives innovation and expansion of product offerings. The region also benefits from increased awareness about eye health and the growing availability of specialized lenses tailored to specific needs.
Eyeglass Lenses Product Developments
Recent innovations in eyeglass lenses include advanced materials offering improved clarity, durability, and lighter weight, along with specialized coatings providing enhanced blue light filtering, anti-reflective properties, and UV protection. The integration of digital technology in lens design and manufacturing processes enables personalized lens designs tailored to individual needs. These innovations cater to the growing consumer demand for advanced vision correction and eye protection solutions.
Report Scope & Segmentation Analysis
This report segments the eyeglass lenses market by lens type (single vision, progressive, bifocal), material (plastic, glass, polycarbonate), coating type (anti-reflective, UV protection, blue light filter), application (corrective, protective), and distribution channel (optical stores, online retailers, others). Growth projections and market size estimations are provided for each segment, along with analysis of competitive dynamics within each category. Each segment demonstrates unique growth trends, influenced by factors like technological advancements, consumer preferences, and pricing strategies.
Key Drivers of Eyeglass Lenses Growth
The eyeglass lenses market is fueled by several key factors. The rising prevalence of refractive errors globally is a significant driver, alongside the expanding geriatric population, as age-related vision problems increase. Technological advancements in lens materials and design, along with the rising adoption of personalized eye care solutions, also contribute to market expansion. Favorable economic conditions in several regions are fueling disposable income growth, resulting in increased spending on premium eyeglass lenses.
Challenges in the Eyeglass Lenses Sector
The eyeglass lenses industry faces challenges including intense competition from established players, price pressure, and the emergence of substitute products like contact lenses and refractive surgeries. Supply chain disruptions, particularly regarding raw materials and manufacturing processes, can impact production and profitability. Regulatory hurdles and evolving safety standards necessitate continuous adaptation and compliance.
Emerging Opportunities in Eyeglass Lenses
Emerging opportunities lie in the increasing demand for specialized lenses such as blue light filtering lenses and personalized lens designs. Expansion into emerging markets with growing middle classes presents significant growth potential. Advancements in augmented reality (AR) and virtual reality (VR) technologies are creating new opportunities for specialized lenses.
Leading Players in the Eyeglass Lenses Market
- EssilorLuxottica
- ZEISS
- HOYA
- Rodenstock
- MingYue
- WanXin
- Chemilens
- Nikon
- Conant
- HongChen
Key Developments in Eyeglass Lenses Industry
- 2022 Q4: EssilorLuxottica launches a new line of progressive lenses with enhanced clarity and comfort.
- 2023 Q1: ZEISS introduces a new anti-reflective coating designed to reduce glare and improve visual acuity.
- 2023 Q2: HOYA announces a strategic partnership to expand its distribution network in Asia.
- (Further developments will be detailed in the full report)
Strategic Outlook for Eyeglass Lenses Market
The eyeglass lenses market is poised for continued growth, driven by several factors including the increasing prevalence of refractive errors and the growing adoption of advanced lens technologies. The rising disposable incomes in emerging markets and the increasing demand for premium lenses represent significant growth opportunities for key players. Innovation in materials science, lens design, and manufacturing processes will continue to shape the market landscape. The strategic focus on personalized eye care solutions and advanced lens features will drive market expansion and create new opportunities for industry participants.
Eyeglass Lenses Segmentation
-
1. Application
- 1.1. Vision Correction
- 1.2. Beautiful
- 1.3. Others
-
2. Types
- 2.1. Glass
- 2.2. Resin
- 2.3. Others
Eyeglass Lenses Segmentation By Geography
-
1. North America
- 1.1. United States
- 1.2. Canada
- 1.3. Mexico
-
2. South America
- 2.1. Brazil
- 2.2. Argentina
- 2.3. Rest of South America
-
3. Europe
- 3.1. United Kingdom
- 3.2. Germany
- 3.3. France
- 3.4. Italy
- 3.5. Spain
- 3.6. Russia
- 3.7. Benelux
- 3.8. Nordics
- 3.9. Rest of Europe
-
4. Middle East & Africa
- 4.1. Turkey
- 4.2. Israel
- 4.3. GCC
- 4.4. North Africa
- 4.5. South Africa
- 4.6. Rest of Middle East & Africa
-
5. Asia Pacific
- 5.1. China
- 5.2. India
- 5.3. Japan
- 5.4. South Korea
- 5.5. ASEAN
- 5.6. Oceania
- 5.7. Rest of Asia Pacific
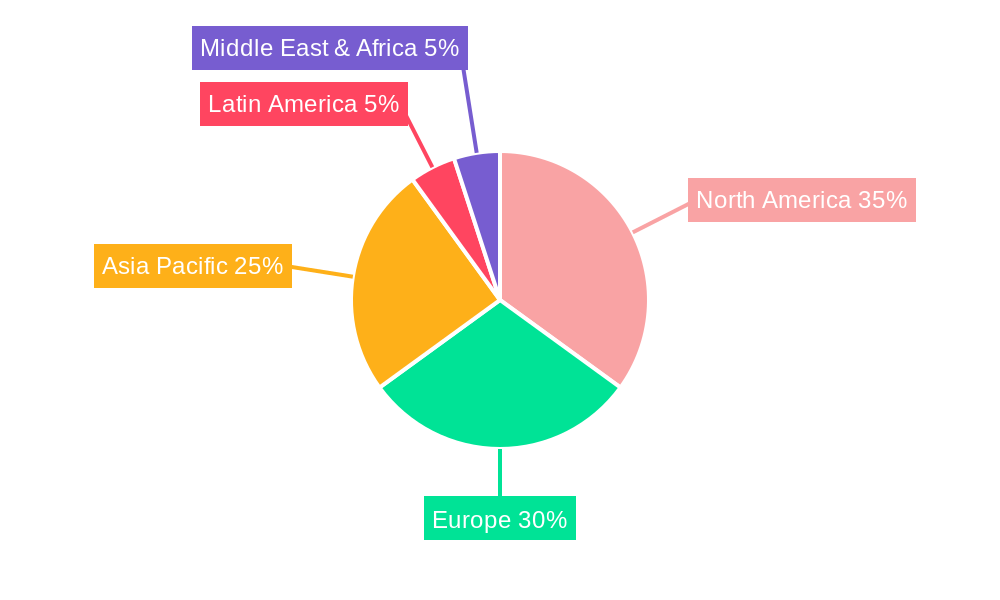
Eyeglass Lenses Regional Market Share
Geographic Coverage of Eyeglass Lenses
Eyeglass Lenses REPORT HIGHLIGHTS
| Aspects | Details |
|---|---|
| Study Period | 2020-2034 |
| Base Year | 2025 |
| Estimated Year | 2026 |
| Forecast Period | 2026-2034 |
| Historical Period | 2020-2025 |
| Growth Rate | CAGR of 7.33% from 2020-2034 |
| Segmentation |
|
Table of Contents
- 1. Introduction
- 1.1. Research Scope
- 1.2. Market Segmentation
- 1.3. Research Objective
- 1.4. Definitions and Assumptions
- 2. Executive Summary
- 2.1. Market Snapshot
- 3. Market Dynamics
- 3.1. Market Drivers
- 3.2. Market Restrains
- 3.3. Market Trends
- 3.4. Market Opportunities
- 4. Market Factor Analysis
- 4.1. Porters Five Forces
- 4.1.1. Bargaining Power of Suppliers
- 4.1.2. Bargaining Power of Buyers
- 4.1.3. Threat of New Entrants
- 4.1.4. Threat of Substitutes
- 4.1.5. Competitive Rivalry
- 4.2. PESTEL analysis
- 4.3. BCG Analysis
- 4.3.1. Stars (High Growth, High Market Share)
- 4.3.2. Cash Cows (Low Growth, High Market Share)
- 4.3.3. Question Mark (High Growth, Low Market Share)
- 4.3.4. Dogs (Low Growth, Low Market Share)
- 4.4. Ansoff Matrix Analysis
- 4.5. Supply Chain Analysis
- 4.6. Regulatory Landscape
- 4.7. Current Market Potential and Opportunity Assessment (TAM–SAM–SOM Framework)
- 4.8. RAX Analyst Note
- 4.1. Porters Five Forces
- 5. Market Analysis, Insights and Forecast 2021-2033
- 5.1. Market Analysis, Insights and Forecast - by Application
- 5.1.1. Vision Correction
- 5.1.2. Beautiful
- 5.1.3. Others
- 5.2. Market Analysis, Insights and Forecast - by Types
- 5.2.1. Glass
- 5.2.2. Resin
- 5.2.3. Others
- 5.3. Market Analysis, Insights and Forecast - by Region
- 5.3.1. North America
- 5.3.2. South America
- 5.3.3. Europe
- 5.3.4. Middle East & Africa
- 5.3.5. Asia Pacific
- 5.1. Market Analysis, Insights and Forecast - by Application
- 6. Global Eyeglass Lenses Analysis, Insights and Forecast, 2021-2033
- 6.1. Market Analysis, Insights and Forecast - by Application
- 6.1.1. Vision Correction
- 6.1.2. Beautiful
- 6.1.3. Others
- 6.2. Market Analysis, Insights and Forecast - by Types
- 6.2.1. Glass
- 6.2.2. Resin
- 6.2.3. Others
- 6.1. Market Analysis, Insights and Forecast - by Application
- 7. North America Eyeglass Lenses Analysis, Insights and Forecast, 2020-2032
- 7.1. Market Analysis, Insights and Forecast - by Application
- 7.1.1. Vision Correction
- 7.1.2. Beautiful
- 7.1.3. Others
- 7.2. Market Analysis, Insights and Forecast - by Types
- 7.2.1. Glass
- 7.2.2. Resin
- 7.2.3. Others
- 7.1. Market Analysis, Insights and Forecast - by Application
- 8. South America Eyeglass Lenses Analysis, Insights and Forecast, 2020-2032
- 8.1. Market Analysis, Insights and Forecast - by Application
- 8.1.1. Vision Correction
- 8.1.2. Beautiful
- 8.1.3. Others
- 8.2. Market Analysis, Insights and Forecast - by Types
- 8.2.1. Glass
- 8.2.2. Resin
- 8.2.3. Others
- 8.1. Market Analysis, Insights and Forecast - by Application
- 9. Europe Eyeglass Lenses Analysis, Insights and Forecast, 2020-2032
- 9.1. Market Analysis, Insights and Forecast - by Application
- 9.1.1. Vision Correction
- 9.1.2. Beautiful
- 9.1.3. Others
- 9.2. Market Analysis, Insights and Forecast - by Types
- 9.2.1. Glass
- 9.2.2. Resin
- 9.2.3. Others
- 9.1. Market Analysis, Insights and Forecast - by Application
- 10. Middle East & Africa Eyeglass Lenses Analysis, Insights and Forecast, 2020-2032
- 10.1. Market Analysis, Insights and Forecast - by Application
- 10.1.1. Vision Correction
- 10.1.2. Beautiful
- 10.1.3. Others
- 10.2. Market Analysis, Insights and Forecast - by Types
- 10.2.1. Glass
- 10.2.2. Resin
- 10.2.3. Others
- 10.1. Market Analysis, Insights and Forecast - by Application
- 11. Asia Pacific Eyeglass Lenses Analysis, Insights and Forecast, 2020-2032
- 11.1. Market Analysis, Insights and Forecast - by Application
- 11.1.1. Vision Correction
- 11.1.2. Beautiful
- 11.1.3. Others
- 11.2. Market Analysis, Insights and Forecast - by Types
- 11.2.1. Glass
- 11.2.2. Resin
- 11.2.3. Others
- 11.1. Market Analysis, Insights and Forecast - by Application
- 12. Competitive Analysis
- 12.1. Company Profiles
- 12.1.1 Essilor
- 12.1.1.1. Company Overview
- 12.1.1.2. Products
- 12.1.1.3. Company Financials
- 12.1.1.4. SWOT Analysis
- 12.1.2 ZEISS
- 12.1.2.1. Company Overview
- 12.1.2.2. Products
- 12.1.2.3. Company Financials
- 12.1.2.4. SWOT Analysis
- 12.1.3 HOYA
- 12.1.3.1. Company Overview
- 12.1.3.2. Products
- 12.1.3.3. Company Financials
- 12.1.3.4. SWOT Analysis
- 12.1.4 Rodenstock
- 12.1.4.1. Company Overview
- 12.1.4.2. Products
- 12.1.4.3. Company Financials
- 12.1.4.4. SWOT Analysis
- 12.1.5 MingYue
- 12.1.5.1. Company Overview
- 12.1.5.2. Products
- 12.1.5.3. Company Financials
- 12.1.5.4. SWOT Analysis
- 12.1.6 WanXin
- 12.1.6.1. Company Overview
- 12.1.6.2. Products
- 12.1.6.3. Company Financials
- 12.1.6.4. SWOT Analysis
- 12.1.7 Chemilens
- 12.1.7.1. Company Overview
- 12.1.7.2. Products
- 12.1.7.3. Company Financials
- 12.1.7.4. SWOT Analysis
- 12.1.8 Nikon
- 12.1.8.1. Company Overview
- 12.1.8.2. Products
- 12.1.8.3. Company Financials
- 12.1.8.4. SWOT Analysis
- 12.1.9 Conant
- 12.1.9.1. Company Overview
- 12.1.9.2. Products
- 12.1.9.3. Company Financials
- 12.1.9.4. SWOT Analysis
- 12.1.10 HongChen
- 12.1.10.1. Company Overview
- 12.1.10.2. Products
- 12.1.10.3. Company Financials
- 12.1.10.4. SWOT Analysis
- 12.1.1 Essilor
- 12.2. Market Entropy
- 12.2.1 Company's Key Areas Served
- 12.2.2 Recent Developments
- 12.3. Company Market Share Analysis 2025
- 12.3.1 Top 5 Companies Market Share Analysis
- 12.3.2 Top 3 Companies Market Share Analysis
- 12.4. List of Potential Customers
- 13. Research Methodology
List of Figures
- Figure 1: Global Eyeglass Lenses Revenue Breakdown (billion, %) by Region 2025 & 2033
- Figure 2: Global Eyeglass Lenses Volume Breakdown (K, %) by Region 2025 & 2033
- Figure 3: North America Eyeglass Lenses Revenue (billion), by Application 2025 & 2033
- Figure 4: North America Eyeglass Lenses Volume (K), by Application 2025 & 2033
- Figure 5: North America Eyeglass Lenses Revenue Share (%), by Application 2025 & 2033
- Figure 6: North America Eyeglass Lenses Volume Share (%), by Application 2025 & 2033
- Figure 7: North America Eyeglass Lenses Revenue (billion), by Types 2025 & 2033
- Figure 8: North America Eyeglass Lenses Volume (K), by Types 2025 & 2033
- Figure 9: North America Eyeglass Lenses Revenue Share (%), by Types 2025 & 2033
- Figure 10: North America Eyeglass Lenses Volume Share (%), by Types 2025 & 2033
- Figure 11: North America Eyeglass Lenses Revenue (billion), by Country 2025 & 2033
- Figure 12: North America Eyeglass Lenses Volume (K), by Country 2025 & 2033
- Figure 13: North America Eyeglass Lenses Revenue Share (%), by Country 2025 & 2033
- Figure 14: North America Eyeglass Lenses Volume Share (%), by Country 2025 & 2033
- Figure 15: South America Eyeglass Lenses Revenue (billion), by Application 2025 & 2033
- Figure 16: South America Eyeglass Lenses Volume (K), by Application 2025 & 2033
- Figure 17: South America Eyeglass Lenses Revenue Share (%), by Application 2025 & 2033
- Figure 18: South America Eyeglass Lenses Volume Share (%), by Application 2025 & 2033
- Figure 19: South America Eyeglass Lenses Revenue (billion), by Types 2025 & 2033
- Figure 20: South America Eyeglass Lenses Volume (K), by Types 2025 & 2033
- Figure 21: South America Eyeglass Lenses Revenue Share (%), by Types 2025 & 2033
- Figure 22: South America Eyeglass Lenses Volume Share (%), by Types 2025 & 2033
- Figure 23: South America Eyeglass Lenses Revenue (billion), by Country 2025 & 2033
- Figure 24: South America Eyeglass Lenses Volume (K), by Country 2025 & 2033
- Figure 25: South America Eyeglass Lenses Revenue Share (%), by Country 2025 & 2033
- Figure 26: South America Eyeglass Lenses Volume Share (%), by Country 2025 & 2033
- Figure 27: Europe Eyeglass Lenses Revenue (billion), by Application 2025 & 2033
- Figure 28: Europe Eyeglass Lenses Volume (K), by Application 2025 & 2033
- Figure 29: Europe Eyeglass Lenses Revenue Share (%), by Application 2025 & 2033
- Figure 30: Europe Eyeglass Lenses Volume Share (%), by Application 2025 & 2033
- Figure 31: Europe Eyeglass Lenses Revenue (billion), by Types 2025 & 2033
- Figure 32: Europe Eyeglass Lenses Volume (K), by Types 2025 & 2033
- Figure 33: Europe Eyeglass Lenses Revenue Share (%), by Types 2025 & 2033
- Figure 34: Europe Eyeglass Lenses Volume Share (%), by Types 2025 & 2033
- Figure 35: Europe Eyeglass Lenses Revenue (billion), by Country 2025 & 2033
- Figure 36: Europe Eyeglass Lenses Volume (K), by Country 2025 & 2033
- Figure 37: Europe Eyeglass Lenses Revenue Share (%), by Country 2025 & 2033
- Figure 38: Europe Eyeglass Lenses Volume Share (%), by Country 2025 & 2033
- Figure 39: Middle East & Africa Eyeglass Lenses Revenue (billion), by Application 2025 & 2033
- Figure 40: Middle East & Africa Eyeglass Lenses Volume (K), by Application 2025 & 2033
- Figure 41: Middle East & Africa Eyeglass Lenses Revenue Share (%), by Application 2025 & 2033
- Figure 42: Middle East & Africa Eyeglass Lenses Volume Share (%), by Application 2025 & 2033
- Figure 43: Middle East & Africa Eyeglass Lenses Revenue (billion), by Types 2025 & 2033
- Figure 44: Middle East & Africa Eyeglass Lenses Volume (K), by Types 2025 & 2033
- Figure 45: Middle East & Africa Eyeglass Lenses Revenue Share (%), by Types 2025 & 2033
- Figure 46: Middle East & Africa Eyeglass Lenses Volume Share (%), by Types 2025 & 2033
- Figure 47: Middle East & Africa Eyeglass Lenses Revenue (billion), by Country 2025 & 2033
- Figure 48: Middle East & Africa Eyeglass Lenses Volume (K), by Country 2025 & 2033
- Figure 49: Middle East & Africa Eyeglass Lenses Revenue Share (%), by Country 2025 & 2033
- Figure 50: Middle East & Africa Eyeglass Lenses Volume Share (%), by Country 2025 & 2033
- Figure 51: Asia Pacific Eyeglass Lenses Revenue (billion), by Application 2025 & 2033
- Figure 52: Asia Pacific Eyeglass Lenses Volume (K), by Application 2025 & 2033
- Figure 53: Asia Pacific Eyeglass Lenses Revenue Share (%), by Application 2025 & 2033
- Figure 54: Asia Pacific Eyeglass Lenses Volume Share (%), by Application 2025 & 2033
- Figure 55: Asia Pacific Eyeglass Lenses Revenue (billion), by Types 2025 & 2033
- Figure 56: Asia Pacific Eyeglass Lenses Volume (K), by Types 2025 & 2033
- Figure 57: Asia Pacific Eyeglass Lenses Revenue Share (%), by Types 2025 & 2033
- Figure 58: Asia Pacific Eyeglass Lenses Volume Share (%), by Types 2025 & 2033
- Figure 59: Asia Pacific Eyeglass Lenses Revenue (billion), by Country 2025 & 2033
- Figure 60: Asia Pacific Eyeglass Lenses Volume (K), by Country 2025 & 2033
- Figure 61: Asia Pacific Eyeglass Lenses Revenue Share (%), by Country 2025 & 2033
- Figure 62: Asia Pacific Eyeglass Lenses Volume Share (%), by Country 2025 & 2033
List of Tables
- Table 1: Global Eyeglass Lenses Revenue billion Forecast, by Application 2020 & 2033
- Table 2: Global Eyeglass Lenses Volume K Forecast, by Application 2020 & 2033
- Table 3: Global Eyeglass Lenses Revenue billion Forecast, by Types 2020 & 2033
- Table 4: Global Eyeglass Lenses Volume K Forecast, by Types 2020 & 2033
- Table 5: Global Eyeglass Lenses Revenue billion Forecast, by Region 2020 & 2033
- Table 6: Global Eyeglass Lenses Volume K Forecast, by Region 2020 & 2033
- Table 7: Global Eyeglass Lenses Revenue billion Forecast, by Application 2020 & 2033
- Table 8: Global Eyeglass Lenses Volume K Forecast, by Application 2020 & 2033
- Table 9: Global Eyeglass Lenses Revenue billion Forecast, by Types 2020 & 2033
- Table 10: Global Eyeglass Lenses Volume K Forecast, by Types 2020 & 2033
- Table 11: Global Eyeglass Lenses Revenue billion Forecast, by Country 2020 & 2033
- Table 12: Global Eyeglass Lenses Volume K Forecast, by Country 2020 & 2033
- Table 13: United States Eyeglass Lenses Revenue (billion) Forecast, by Application 2020 & 2033
- Table 14: United States Eyeglass Lenses Volume (K) Forecast, by Application 2020 & 2033
- Table 15: Canada Eyeglass Lenses Revenue (billion) Forecast, by Application 2020 & 2033
- Table 16: Canada Eyeglass Lenses Volume (K) Forecast, by Application 2020 & 2033
- Table 17: Mexico Eyeglass Lenses Revenue (billion) Forecast, by Application 2020 & 2033
- Table 18: Mexico Eyeglass Lenses Volume (K) Forecast, by Application 2020 & 2033
- Table 19: Global Eyeglass Lenses Revenue billion Forecast, by Application 2020 & 2033
- Table 20: Global Eyeglass Lenses Volume K Forecast, by Application 2020 & 2033
- Table 21: Global Eyeglass Lenses Revenue billion Forecast, by Types 2020 & 2033
- Table 22: Global Eyeglass Lenses Volume K Forecast, by Types 2020 & 2033
- Table 23: Global Eyeglass Lenses Revenue billion Forecast, by Country 2020 & 2033
- Table 24: Global Eyeglass Lenses Volume K Forecast, by Country 2020 & 2033
- Table 25: Brazil Eyeglass Lenses Revenue (billion) Forecast, by Application 2020 & 2033
- Table 26: Brazil Eyeglass Lenses Volume (K) Forecast, by Application 2020 & 2033
- Table 27: Argentina Eyeglass Lenses Revenue (billion) Forecast, by Application 2020 & 2033
- Table 28: Argentina Eyeglass Lenses Volume (K) Forecast, by Application 2020 & 2033
- Table 29: Rest of South America Eyeglass Lenses Revenue (billion) Forecast, by Application 2020 & 2033
- Table 30: Rest of South America Eyeglass Lenses Volume (K) Forecast, by Application 2020 & 2033
- Table 31: Global Eyeglass Lenses Revenue billion Forecast, by Application 2020 & 2033
- Table 32: Global Eyeglass Lenses Volume K Forecast, by Application 2020 & 2033
- Table 33: Global Eyeglass Lenses Revenue billion Forecast, by Types 2020 & 2033
- Table 34: Global Eyeglass Lenses Volume K Forecast, by Types 2020 & 2033
- Table 35: Global Eyeglass Lenses Revenue billion Forecast, by Country 2020 & 2033
- Table 36: Global Eyeglass Lenses Volume K Forecast, by Country 2020 & 2033
- Table 37: United Kingdom Eyeglass Lenses Revenue (billion) Forecast, by Application 2020 & 2033
- Table 38: United Kingdom Eyeglass Lenses Volume (K) Forecast, by Application 2020 & 2033
- Table 39: Germany Eyeglass Lenses Revenue (billion) Forecast, by Application 2020 & 2033
- Table 40: Germany Eyeglass Lenses Volume (K) Forecast, by Application 2020 & 2033
- Table 41: France Eyeglass Lenses Revenue (billion) Forecast, by Application 2020 & 2033
- Table 42: France Eyeglass Lenses Volume (K) Forecast, by Application 2020 & 2033
- Table 43: Italy Eyeglass Lenses Revenue (billion) Forecast, by Application 2020 & 2033
- Table 44: Italy Eyeglass Lenses Volume (K) Forecast, by Application 2020 & 2033
- Table 45: Spain Eyeglass Lenses Revenue (billion) Forecast, by Application 2020 & 2033
- Table 46: Spain Eyeglass Lenses Volume (K) Forecast, by Application 2020 & 2033
- Table 47: Russia Eyeglass Lenses Revenue (billion) Forecast, by Application 2020 & 2033
- Table 48: Russia Eyeglass Lenses Volume (K) Forecast, by Application 2020 & 2033
- Table 49: Benelux Eyeglass Lenses Revenue (billion) Forecast, by Application 2020 & 2033
- Table 50: Benelux Eyeglass Lenses Volume (K) Forecast, by Application 2020 & 2033
- Table 51: Nordics Eyeglass Lenses Revenue (billion) Forecast, by Application 2020 & 2033
- Table 52: Nordics Eyeglass Lenses Volume (K) Forecast, by Application 2020 & 2033
- Table 53: Rest of Europe Eyeglass Lenses Revenue (billion) Forecast, by Application 2020 & 2033
- Table 54: Rest of Europe Eyeglass Lenses Volume (K) Forecast, by Application 2020 & 2033
- Table 55: Global Eyeglass Lenses Revenue billion Forecast, by Application 2020 & 2033
- Table 56: Global Eyeglass Lenses Volume K Forecast, by Application 2020 & 2033
- Table 57: Global Eyeglass Lenses Revenue billion Forecast, by Types 2020 & 2033
- Table 58: Global Eyeglass Lenses Volume K Forecast, by Types 2020 & 2033
- Table 59: Global Eyeglass Lenses Revenue billion Forecast, by Country 2020 & 2033
- Table 60: Global Eyeglass Lenses Volume K Forecast, by Country 2020 & 2033
- Table 61: Turkey Eyeglass Lenses Revenue (billion) Forecast, by Application 2020 & 2033
- Table 62: Turkey Eyeglass Lenses Volume (K) Forecast, by Application 2020 & 2033
- Table 63: Israel Eyeglass Lenses Revenue (billion) Forecast, by Application 2020 & 2033
- Table 64: Israel Eyeglass Lenses Volume (K) Forecast, by Application 2020 & 2033
- Table 65: GCC Eyeglass Lenses Revenue (billion) Forecast, by Application 2020 & 2033
- Table 66: GCC Eyeglass Lenses Volume (K) Forecast, by Application 2020 & 2033
- Table 67: North Africa Eyeglass Lenses Revenue (billion) Forecast, by Application 2020 & 2033
- Table 68: North Africa Eyeglass Lenses Volume (K) Forecast, by Application 2020 & 2033
- Table 69: South Africa Eyeglass Lenses Revenue (billion) Forecast, by Application 2020 & 2033
- Table 70: South Africa Eyeglass Lenses Volume (K) Forecast, by Application 2020 & 2033
- Table 71: Rest of Middle East & Africa Eyeglass Lenses Revenue (billion) Forecast, by Application 2020 & 2033
- Table 72: Rest of Middle East & Africa Eyeglass Lenses Volume (K) Forecast, by Application 2020 & 2033
- Table 73: Global Eyeglass Lenses Revenue billion Forecast, by Application 2020 & 2033
- Table 74: Global Eyeglass Lenses Volume K Forecast, by Application 2020 & 2033
- Table 75: Global Eyeglass Lenses Revenue billion Forecast, by Types 2020 & 2033
- Table 76: Global Eyeglass Lenses Volume K Forecast, by Types 2020 & 2033
- Table 77: Global Eyeglass Lenses Revenue billion Forecast, by Country 2020 & 2033
- Table 78: Global Eyeglass Lenses Volume K Forecast, by Country 2020 & 2033
- Table 79: China Eyeglass Lenses Revenue (billion) Forecast, by Application 2020 & 2033
- Table 80: China Eyeglass Lenses Volume (K) Forecast, by Application 2020 & 2033
- Table 81: India Eyeglass Lenses Revenue (billion) Forecast, by Application 2020 & 2033
- Table 82: India Eyeglass Lenses Volume (K) Forecast, by Application 2020 & 2033
- Table 83: Japan Eyeglass Lenses Revenue (billion) Forecast, by Application 2020 & 2033
- Table 84: Japan Eyeglass Lenses Volume (K) Forecast, by Application 2020 & 2033
- Table 85: South Korea Eyeglass Lenses Revenue (billion) Forecast, by Application 2020 & 2033
- Table 86: South Korea Eyeglass Lenses Volume (K) Forecast, by Application 2020 & 2033
- Table 87: ASEAN Eyeglass Lenses Revenue (billion) Forecast, by Application 2020 & 2033
- Table 88: ASEAN Eyeglass Lenses Volume (K) Forecast, by Application 2020 & 2033
- Table 89: Oceania Eyeglass Lenses Revenue (billion) Forecast, by Application 2020 & 2033
- Table 90: Oceania Eyeglass Lenses Volume (K) Forecast, by Application 2020 & 2033
- Table 91: Rest of Asia Pacific Eyeglass Lenses Revenue (billion) Forecast, by Application 2020 & 2033
- Table 92: Rest of Asia Pacific Eyeglass Lenses Volume (K) Forecast, by Application 2020 & 2033
Frequently Asked Questions
1. What is the projected Compound Annual Growth Rate (CAGR) of the Eyeglass Lenses?
The projected CAGR is approximately 7.33%.
2. Which companies are prominent players in the Eyeglass Lenses?
Key companies in the market include Essilor, ZEISS, HOYA, Rodenstock, MingYue, WanXin, Chemilens, Nikon, Conant, HongChen.
3. What are the main segments of the Eyeglass Lenses?
The market segments include Application, Types.
4. Can you provide details about the market size?
The market size is estimated to be USD 21.25 billion as of 2022.
5. What are some drivers contributing to market growth?
N/A
6. What are the notable trends driving market growth?
N/A
7. Are there any restraints impacting market growth?
N/A
8. Can you provide examples of recent developments in the market?
N/A
9. What pricing options are available for accessing the report?
Pricing options include single-user, multi-user, and enterprise licenses priced at USD 3350.00, USD 5025.00, and USD 6700.00 respectively.
10. Is the market size provided in terms of value or volume?
The market size is provided in terms of value, measured in billion and volume, measured in K.
11. Are there any specific market keywords associated with the report?
Yes, the market keyword associated with the report is "Eyeglass Lenses," which aids in identifying and referencing the specific market segment covered.
12. How do I determine which pricing option suits my needs best?
The pricing options vary based on user requirements and access needs. Individual users may opt for single-user licenses, while businesses requiring broader access may choose multi-user or enterprise licenses for cost-effective access to the report.
13. Are there any additional resources or data provided in the Eyeglass Lenses report?
While the report offers comprehensive insights, it's advisable to review the specific contents or supplementary materials provided to ascertain if additional resources or data are available.
14. How can I stay updated on further developments or reports in the Eyeglass Lenses?
To stay informed about further developments, trends, and reports in the Eyeglass Lenses, consider subscribing to industry newsletters, following relevant companies and organizations, or regularly checking reputable industry news sources and publications.
Methodology
Step 1 - Identification of Relevant Samples Size from Population Database


Step 2 - Approaches for Defining Global Market Size (Value, Volume* & Price*)

Note*: In applicable scenarios
Step 3 - Data Sources
Primary Research
- Web Analytics
- Survey Reports
- Research Institute
- Latest Research Reports
- Opinion Leaders
Secondary Research
- Annual Reports
- White Paper
- Latest Press Release
- Industry Association
- Paid Database
- Investor Presentations

Step 4 - Data Triangulation
Involves using different sources of information in order to increase the validity of a study
These sources are likely to be stakeholders in a program - participants, other researchers, program staff, other community members, and so on.
Then we put all data in single framework & apply various statistical tools to find out the dynamic on the market.
During the analysis stage, feedback from the stakeholder groups would be compared to determine areas of agreement as well as areas of divergence