

Key Insights
The global facial beauty device market is poised for significant expansion, propelled by heightened consumer demand for advanced skincare solutions and continuous technological innovation. The market, valued at $22.35 billion in 2025, is projected to achieve a substantial Compound Annual Growth Rate (CAGR) of 16.3% from 2025 to 2033. This robust growth trajectory is underpinned by several key factors, including the increasing prevalence of dermatological concerns such as acne, wrinkles, and hyperpigmentation, the widespread adoption of at-home beauty regimens, and a growing preference for non-invasive aesthetic treatments. Emerging trends highlight the development of sophisticated, personalized treatment devices, the integration of smart technologies for an optimized user experience, and the introduction of devices catering to a diverse spectrum of skin types and concerns. Leading global brands and numerous agile startups are actively contributing to a dynamic and competitive landscape characterized by relentless innovation.
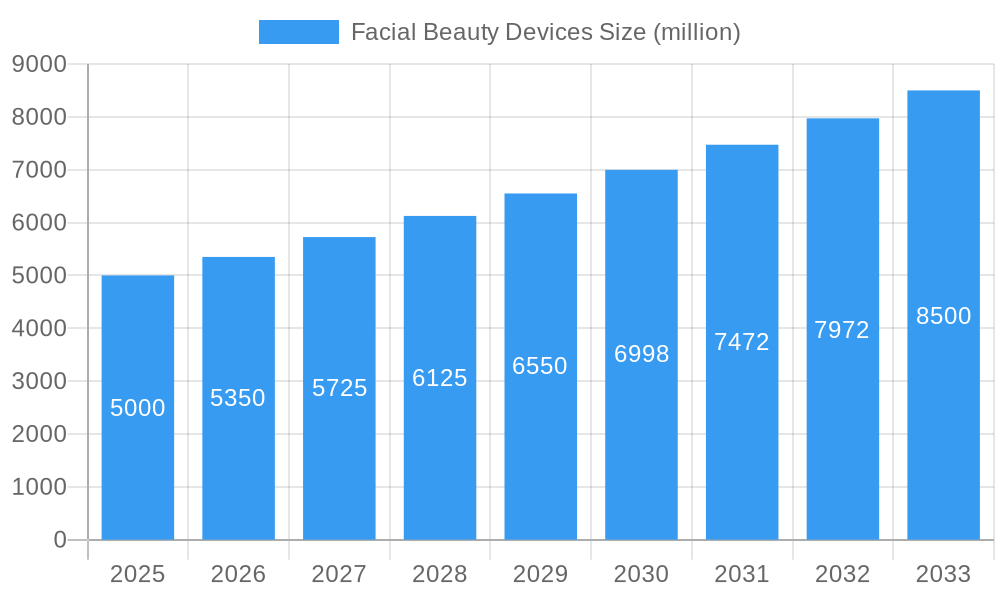
Facial Beauty Devices Market Size (In Billion)
While the market presents a favorable outlook, certain growth impediments exist. These include the premium pricing of advanced devices, potential concerns regarding side effects or improper usage, and the persistent influence of conventional skincare products and professional cosmetic services. Additionally, evolving regulatory frameworks and varied consumer adoption rates across different geographic territories contribute to nuanced market expansion. The market is segmented by device type (e.g., microcurrent, LED, ultrasound), application (e.g., wrinkle reduction, acne treatment, skin tightening), and price point, with premium-tier devices currently holding a dominant market share. Regional variations in consumer preferences and purchasing power will continue to shape market dynamics throughout the forecast period. Strategic marketing initiatives emphasizing both efficacy and safety are crucial for market participants to overcome challenges and leverage the sector's considerable growth potential.
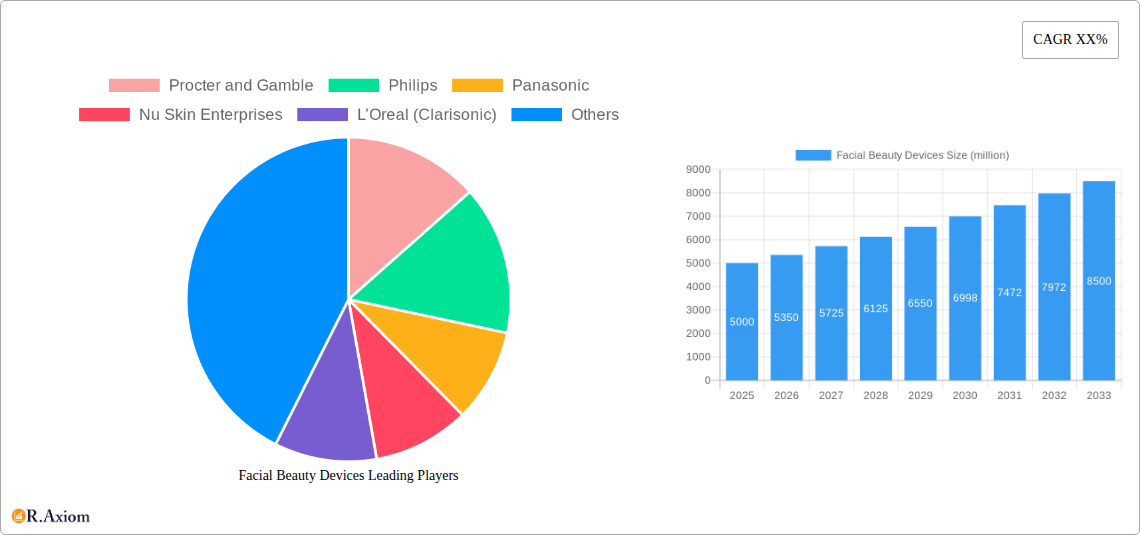
Facial Beauty Devices Company Market Share
Facial Beauty Devices Market Report: 2019-2033
This comprehensive report provides a detailed analysis of the global facial beauty devices market, covering the period 2019-2033. With a base year of 2025 and an estimated year of 2025, this report offers invaluable insights into market trends, leading players, and future growth potential. The market is segmented by device type, technology, distribution channel, and geography. This in-depth study projects a market value exceeding $XX million by 2033, offering actionable intelligence for industry stakeholders, investors, and market entrants.
Facial Beauty Devices Market Concentration & Innovation
The global facial beauty devices market is characterized by a moderately concentrated landscape, with several major players holding significant market share. Procter & Gamble, Philips, Panasonic, and L’Oréal (Clarisonic) are among the established leaders, each commanding a substantial portion (XX million USD) of the market, estimated at a combined XX% market share in 2025. However, smaller, specialized companies like FOREO and NuFACE are also making significant contributions, driving innovation in niche segments.
- Market Concentration: The top 5 players account for approximately XX% of the market revenue in 2025.
- Innovation Drivers: Technological advancements such as microcurrent technology, LED light therapy, and radiofrequency are driving innovation. Increased consumer demand for at-home beauty solutions fuels this innovation.
- Regulatory Frameworks: Varying regulatory frameworks across different regions influence product development and market access. Compliance costs can be a considerable factor for smaller players.
- Product Substitutes: Traditional beauty treatments and professional salon services remain viable substitutes, although the convenience and affordability of at-home devices continue to boost market growth.
- End-User Trends: Growing awareness of skincare benefits, the rising popularity of self-care practices, and the increasing disposable income of consumers are significant drivers of growth.
- M&A Activities: The market has witnessed several mergers and acquisitions (M&A) in recent years, with deal values exceeding $XX million in some instances, indicating a trend toward market consolidation and expansion into new technologies. Examples include (XX specific M&A examples if data is available. Otherwise, state "Specific examples unavailable due to data limitations.").
Facial Beauty Devices Industry Trends & Insights
The global facial beauty devices market is experiencing robust growth, driven by several key factors. The market is projected to register a Compound Annual Growth Rate (CAGR) of XX% during the forecast period (2025-2033). This growth is fueled by technological advancements that deliver increasingly effective and user-friendly devices. Consumer preferences are shifting towards non-invasive, at-home solutions for skincare, bolstering market penetration. The competitive landscape is dynamic, with established players and emerging companies vying for market share through innovation, strategic partnerships, and targeted marketing campaigns. The increasing availability of affordable devices is also expanding the market's accessibility. Market penetration is projected to reach XX% by 2033. Specific disruptive technologies include microcurrent devices promising muscle toning and LED masks for skin rejuvenation, gaining significant consumer traction. Consumer preference shifts toward personalized and targeted skincare solutions further fuels the growth of this sector. The market witnesses fierce competition among global and regional brands, each striving for innovation and customer acquisition.
Dominant Markets & Segments in Facial Beauty Devices
The North American market currently dominates the global facial beauty devices market, accounting for approximately XX% of the total revenue in 2025. This dominance stems from several factors:
- High Disposable Incomes: Higher disposable incomes in North America allow consumers to invest in premium beauty devices.
- Advanced Infrastructure: Well-established retail networks and e-commerce infrastructure facilitate easy access to facial beauty devices.
- Strong Regulatory Frameworks: A relatively stable and predictable regulatory environment fosters market growth.
- High Awareness and Adoption: Consumers in North America demonstrate a strong awareness of and adoption rate for facial beauty devices.
Further, the segment of microcurrent devices holds a significant market share, driven by its purported efficacy in muscle toning and wrinkle reduction. The high demand for at-home facial treatments contributes to its considerable market share and high growth potential. Asia-Pacific is emerging as a strong growth region, driven by rising disposable incomes and increased consumer awareness of beauty products.
Facial Beauty Devices Product Developments
Recent product innovations focus on incorporating advanced technologies like AI-powered personalization, advanced sensor technology for optimized treatments, and smaller, more portable device designs. These developments cater to the growing consumer demand for convenient and effective at-home skincare solutions, enhancing market competitiveness through improved user experience and efficacy. The integration of smart features and connectivity with mobile apps is also a significant trend, providing personalized feedback and treatment guidance.
Report Scope & Segmentation Analysis
This report segments the facial beauty devices market based on device type (e.g., microcurrent devices, LED masks, ultrasonic devices), technology (e.g., radiofrequency, microdermabrasion), distribution channel (e.g., online retailers, specialty stores, beauty salons), and geography (North America, Europe, Asia-Pacific, etc.). Each segment's growth projections, market sizes, and competitive dynamics are thoroughly analyzed. Growth forecasts are presented for each segment, indicating varying growth rates due to consumer preferences and technological advancements. The competitive landscape within each segment is also addressed, highlighting key players and their strategies.
Key Drivers of Facial Beauty Devices Growth
Technological advancements, rising consumer disposable incomes, and a growing focus on personal wellness and self-care are the primary growth drivers. The increasing adoption of online retail channels and the expansion of e-commerce platforms also facilitate market expansion. Specific examples include the development of advanced LED technology in facial masks or the introduction of portable, user-friendly microcurrent devices. Government regulations promoting beauty product safety also positively influence market growth.
Challenges in the Facial Beauty Devices Sector
The market faces challenges such as stringent regulatory requirements in some regions, potentially increasing costs for manufacturers. Supply chain disruptions and fluctuating raw material prices can affect production costs and profitability. Intense competition from both established and emerging players also necessitates continuous innovation and strategic marketing efforts. The challenge of effectively demonstrating efficacy and managing consumer expectations is also crucial.
Emerging Opportunities in Facial Beauty Devices
The integration of Artificial Intelligence (AI) and personalized skincare regimens presents a significant growth opportunity. Expanding into new markets with growing middle classes and increased consumer spending on beauty products offers substantial potential. Furthermore, the development of sustainable and eco-friendly devices will appeal to an increasingly environmentally conscious consumer base.
Leading Players in the Facial Beauty Devices Market
- Procter and Gamble
- Philips
- Panasonic
- Nu Skin Enterprises
- L’Oreal (Clarisonic)
- Conair
- MTG (Refa)
- Remington
- YA-MAN
- FOREO
- Silk’n
- Carol Cole (NuFace)
- KAKUSAN
- Quasar MD
- Kingdom
- Tria
- SmoothSkin
- Tripollar
- Hitachi
- Newa
Key Developments in Facial Beauty Devices Industry
- 2022 Q4: FOREO launched a new line of smart facial cleansing devices incorporating advanced sensor technology.
- 2023 Q1: L’Oréal acquired a stake in a company specializing in AI-powered personalized skincare solutions. (Specific details unavailable).
- 2023 Q2: Several key players announced new partnerships to expand distribution channels into emerging markets (Specific details unavailable).
- (Add further bullet points with specific dates and details as available)
Strategic Outlook for Facial Beauty Devices Market
The facial beauty devices market is poised for continued expansion, driven by ongoing technological advancements, increasing consumer demand for effective at-home skincare solutions, and the growing popularity of personalized beauty routines. Emerging technologies such as AI and machine learning will further enhance the personalization and efficacy of these devices, opening new avenues for market growth and innovation. The market’s focus on sustainable and eco-friendly products is also set to drive future opportunities.
Facial Beauty Devices Segmentation
-
1. Application
- 1.1. Beauty Salon
- 1.2. Household
- 1.3. Other
-
2. Types
- 2.1. Cleansing Devices
- 2.2. Oxygen and Steamer
- 2.3. Dermal Rollers
- 2.4. Acne Removal Devices
- 2.5. Hair Removal Devices
- 2.6. Other
Facial Beauty Devices Segmentation By Geography
-
1. North America
- 1.1. United States
- 1.2. Canada
- 1.3. Mexico
-
2. South America
- 2.1. Brazil
- 2.2. Argentina
- 2.3. Rest of South America
-
3. Europe
- 3.1. United Kingdom
- 3.2. Germany
- 3.3. France
- 3.4. Italy
- 3.5. Spain
- 3.6. Russia
- 3.7. Benelux
- 3.8. Nordics
- 3.9. Rest of Europe
-
4. Middle East & Africa
- 4.1. Turkey
- 4.2. Israel
- 4.3. GCC
- 4.4. North Africa
- 4.5. South Africa
- 4.6. Rest of Middle East & Africa
-
5. Asia Pacific
- 5.1. China
- 5.2. India
- 5.3. Japan
- 5.4. South Korea
- 5.5. ASEAN
- 5.6. Oceania
- 5.7. Rest of Asia Pacific
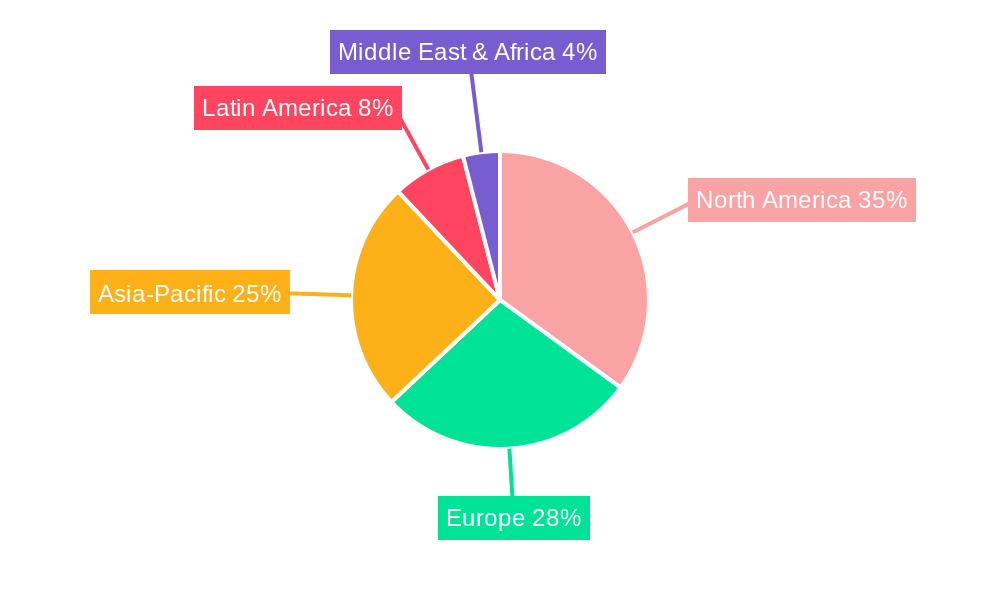
Facial Beauty Devices Regional Market Share
Geographic Coverage of Facial Beauty Devices
Facial Beauty Devices REPORT HIGHLIGHTS
| Aspects | Details |
|---|---|
| Study Period | 2020-2034 |
| Base Year | 2025 |
| Estimated Year | 2026 |
| Forecast Period | 2026-2034 |
| Historical Period | 2020-2025 |
| Growth Rate | CAGR of 16.3% from 2020-2034 |
| Segmentation |
|
Table of Contents
- 1. Introduction
- 1.1. Research Scope
- 1.2. Market Segmentation
- 1.3. Research Methodology
- 1.4. Definitions and Assumptions
- 2. Executive Summary
- 2.1. Introduction
- 3. Market Dynamics
- 3.1. Introduction
- 3.2. Market Drivers
- 3.3. Market Restrains
- 3.4. Market Trends
- 4. Market Factor Analysis
- 4.1. Porters Five Forces
- 4.2. Supply/Value Chain
- 4.3. PESTEL analysis
- 4.4. Market Entropy
- 4.5. Patent/Trademark Analysis
- 5. Global Facial Beauty Devices Analysis, Insights and Forecast, 2020-2032
- 5.1. Market Analysis, Insights and Forecast - by Application
- 5.1.1. Beauty Salon
- 5.1.2. Household
- 5.1.3. Other
- 5.2. Market Analysis, Insights and Forecast - by Types
- 5.2.1. Cleansing Devices
- 5.2.2. Oxygen and Steamer
- 5.2.3. Dermal Rollers
- 5.2.4. Acne Removal Devices
- 5.2.5. Hair Removal Devices
- 5.2.6. Other
- 5.3. Market Analysis, Insights and Forecast - by Region
- 5.3.1. North America
- 5.3.2. South America
- 5.3.3. Europe
- 5.3.4. Middle East & Africa
- 5.3.5. Asia Pacific
- 5.1. Market Analysis, Insights and Forecast - by Application
- 6. North America Facial Beauty Devices Analysis, Insights and Forecast, 2020-2032
- 6.1. Market Analysis, Insights and Forecast - by Application
- 6.1.1. Beauty Salon
- 6.1.2. Household
- 6.1.3. Other
- 6.2. Market Analysis, Insights and Forecast - by Types
- 6.2.1. Cleansing Devices
- 6.2.2. Oxygen and Steamer
- 6.2.3. Dermal Rollers
- 6.2.4. Acne Removal Devices
- 6.2.5. Hair Removal Devices
- 6.2.6. Other
- 6.1. Market Analysis, Insights and Forecast - by Application
- 7. South America Facial Beauty Devices Analysis, Insights and Forecast, 2020-2032
- 7.1. Market Analysis, Insights and Forecast - by Application
- 7.1.1. Beauty Salon
- 7.1.2. Household
- 7.1.3. Other
- 7.2. Market Analysis, Insights and Forecast - by Types
- 7.2.1. Cleansing Devices
- 7.2.2. Oxygen and Steamer
- 7.2.3. Dermal Rollers
- 7.2.4. Acne Removal Devices
- 7.2.5. Hair Removal Devices
- 7.2.6. Other
- 7.1. Market Analysis, Insights and Forecast - by Application
- 8. Europe Facial Beauty Devices Analysis, Insights and Forecast, 2020-2032
- 8.1. Market Analysis, Insights and Forecast - by Application
- 8.1.1. Beauty Salon
- 8.1.2. Household
- 8.1.3. Other
- 8.2. Market Analysis, Insights and Forecast - by Types
- 8.2.1. Cleansing Devices
- 8.2.2. Oxygen and Steamer
- 8.2.3. Dermal Rollers
- 8.2.4. Acne Removal Devices
- 8.2.5. Hair Removal Devices
- 8.2.6. Other
- 8.1. Market Analysis, Insights and Forecast - by Application
- 9. Middle East & Africa Facial Beauty Devices Analysis, Insights and Forecast, 2020-2032
- 9.1. Market Analysis, Insights and Forecast - by Application
- 9.1.1. Beauty Salon
- 9.1.2. Household
- 9.1.3. Other
- 9.2. Market Analysis, Insights and Forecast - by Types
- 9.2.1. Cleansing Devices
- 9.2.2. Oxygen and Steamer
- 9.2.3. Dermal Rollers
- 9.2.4. Acne Removal Devices
- 9.2.5. Hair Removal Devices
- 9.2.6. Other
- 9.1. Market Analysis, Insights and Forecast - by Application
- 10. Asia Pacific Facial Beauty Devices Analysis, Insights and Forecast, 2020-2032
- 10.1. Market Analysis, Insights and Forecast - by Application
- 10.1.1. Beauty Salon
- 10.1.2. Household
- 10.1.3. Other
- 10.2. Market Analysis, Insights and Forecast - by Types
- 10.2.1. Cleansing Devices
- 10.2.2. Oxygen and Steamer
- 10.2.3. Dermal Rollers
- 10.2.4. Acne Removal Devices
- 10.2.5. Hair Removal Devices
- 10.2.6. Other
- 10.1. Market Analysis, Insights and Forecast - by Application
- 11. Competitive Analysis
- 11.1. Global Market Share Analysis 2025
- 11.2. Company Profiles
- 11.2.1 Procter and Gamble
- 11.2.1.1. Overview
- 11.2.1.2. Products
- 11.2.1.3. SWOT Analysis
- 11.2.1.4. Recent Developments
- 11.2.1.5. Financials (Based on Availability)
- 11.2.2 Philips
- 11.2.2.1. Overview
- 11.2.2.2. Products
- 11.2.2.3. SWOT Analysis
- 11.2.2.4. Recent Developments
- 11.2.2.5. Financials (Based on Availability)
- 11.2.3 Panasonic
- 11.2.3.1. Overview
- 11.2.3.2. Products
- 11.2.3.3. SWOT Analysis
- 11.2.3.4. Recent Developments
- 11.2.3.5. Financials (Based on Availability)
- 11.2.4 Nu Skin Enterprises
- 11.2.4.1. Overview
- 11.2.4.2. Products
- 11.2.4.3. SWOT Analysis
- 11.2.4.4. Recent Developments
- 11.2.4.5. Financials (Based on Availability)
- 11.2.5 L’Oreal (Clarisonic)
- 11.2.5.1. Overview
- 11.2.5.2. Products
- 11.2.5.3. SWOT Analysis
- 11.2.5.4. Recent Developments
- 11.2.5.5. Financials (Based on Availability)
- 11.2.6 Conair
- 11.2.6.1. Overview
- 11.2.6.2. Products
- 11.2.6.3. SWOT Analysis
- 11.2.6.4. Recent Developments
- 11.2.6.5. Financials (Based on Availability)
- 11.2.7 MTG (Refa)
- 11.2.7.1. Overview
- 11.2.7.2. Products
- 11.2.7.3. SWOT Analysis
- 11.2.7.4. Recent Developments
- 11.2.7.5. Financials (Based on Availability)
- 11.2.8 Remington
- 11.2.8.1. Overview
- 11.2.8.2. Products
- 11.2.8.3. SWOT Analysis
- 11.2.8.4. Recent Developments
- 11.2.8.5. Financials (Based on Availability)
- 11.2.9 YA-MAN
- 11.2.9.1. Overview
- 11.2.9.2. Products
- 11.2.9.3. SWOT Analysis
- 11.2.9.4. Recent Developments
- 11.2.9.5. Financials (Based on Availability)
- 11.2.10 FOREO
- 11.2.10.1. Overview
- 11.2.10.2. Products
- 11.2.10.3. SWOT Analysis
- 11.2.10.4. Recent Developments
- 11.2.10.5. Financials (Based on Availability)
- 11.2.11 Silk’n
- 11.2.11.1. Overview
- 11.2.11.2. Products
- 11.2.11.3. SWOT Analysis
- 11.2.11.4. Recent Developments
- 11.2.11.5. Financials (Based on Availability)
- 11.2.12 Carol Cole (NuFace)
- 11.2.12.1. Overview
- 11.2.12.2. Products
- 11.2.12.3. SWOT Analysis
- 11.2.12.4. Recent Developments
- 11.2.12.5. Financials (Based on Availability)
- 11.2.13 KAKUSAN
- 11.2.13.1. Overview
- 11.2.13.2. Products
- 11.2.13.3. SWOT Analysis
- 11.2.13.4. Recent Developments
- 11.2.13.5. Financials (Based on Availability)
- 11.2.14 Quasar MD
- 11.2.14.1. Overview
- 11.2.14.2. Products
- 11.2.14.3. SWOT Analysis
- 11.2.14.4. Recent Developments
- 11.2.14.5. Financials (Based on Availability)
- 11.2.15 Kingdom
- 11.2.15.1. Overview
- 11.2.15.2. Products
- 11.2.15.3. SWOT Analysis
- 11.2.15.4. Recent Developments
- 11.2.15.5. Financials (Based on Availability)
- 11.2.16 Tria
- 11.2.16.1. Overview
- 11.2.16.2. Products
- 11.2.16.3. SWOT Analysis
- 11.2.16.4. Recent Developments
- 11.2.16.5. Financials (Based on Availability)
- 11.2.17 SmoothSkin
- 11.2.17.1. Overview
- 11.2.17.2. Products
- 11.2.17.3. SWOT Analysis
- 11.2.17.4. Recent Developments
- 11.2.17.5. Financials (Based on Availability)
- 11.2.18 Tripollar
- 11.2.18.1. Overview
- 11.2.18.2. Products
- 11.2.18.3. SWOT Analysis
- 11.2.18.4. Recent Developments
- 11.2.18.5. Financials (Based on Availability)
- 11.2.19 Hitachi
- 11.2.19.1. Overview
- 11.2.19.2. Products
- 11.2.19.3. SWOT Analysis
- 11.2.19.4. Recent Developments
- 11.2.19.5. Financials (Based on Availability)
- 11.2.20 Newa
- 11.2.20.1. Overview
- 11.2.20.2. Products
- 11.2.20.3. SWOT Analysis
- 11.2.20.4. Recent Developments
- 11.2.20.5. Financials (Based on Availability)
- 11.2.1 Procter and Gamble
List of Figures
- Figure 1: Global Facial Beauty Devices Revenue Breakdown (billion, %) by Region 2025 & 2033
- Figure 2: Global Facial Beauty Devices Volume Breakdown (K, %) by Region 2025 & 2033
- Figure 3: North America Facial Beauty Devices Revenue (billion), by Application 2025 & 2033
- Figure 4: North America Facial Beauty Devices Volume (K), by Application 2025 & 2033
- Figure 5: North America Facial Beauty Devices Revenue Share (%), by Application 2025 & 2033
- Figure 6: North America Facial Beauty Devices Volume Share (%), by Application 2025 & 2033
- Figure 7: North America Facial Beauty Devices Revenue (billion), by Types 2025 & 2033
- Figure 8: North America Facial Beauty Devices Volume (K), by Types 2025 & 2033
- Figure 9: North America Facial Beauty Devices Revenue Share (%), by Types 2025 & 2033
- Figure 10: North America Facial Beauty Devices Volume Share (%), by Types 2025 & 2033
- Figure 11: North America Facial Beauty Devices Revenue (billion), by Country 2025 & 2033
- Figure 12: North America Facial Beauty Devices Volume (K), by Country 2025 & 2033
- Figure 13: North America Facial Beauty Devices Revenue Share (%), by Country 2025 & 2033
- Figure 14: North America Facial Beauty Devices Volume Share (%), by Country 2025 & 2033
- Figure 15: South America Facial Beauty Devices Revenue (billion), by Application 2025 & 2033
- Figure 16: South America Facial Beauty Devices Volume (K), by Application 2025 & 2033
- Figure 17: South America Facial Beauty Devices Revenue Share (%), by Application 2025 & 2033
- Figure 18: South America Facial Beauty Devices Volume Share (%), by Application 2025 & 2033
- Figure 19: South America Facial Beauty Devices Revenue (billion), by Types 2025 & 2033
- Figure 20: South America Facial Beauty Devices Volume (K), by Types 2025 & 2033
- Figure 21: South America Facial Beauty Devices Revenue Share (%), by Types 2025 & 2033
- Figure 22: South America Facial Beauty Devices Volume Share (%), by Types 2025 & 2033
- Figure 23: South America Facial Beauty Devices Revenue (billion), by Country 2025 & 2033
- Figure 24: South America Facial Beauty Devices Volume (K), by Country 2025 & 2033
- Figure 25: South America Facial Beauty Devices Revenue Share (%), by Country 2025 & 2033
- Figure 26: South America Facial Beauty Devices Volume Share (%), by Country 2025 & 2033
- Figure 27: Europe Facial Beauty Devices Revenue (billion), by Application 2025 & 2033
- Figure 28: Europe Facial Beauty Devices Volume (K), by Application 2025 & 2033
- Figure 29: Europe Facial Beauty Devices Revenue Share (%), by Application 2025 & 2033
- Figure 30: Europe Facial Beauty Devices Volume Share (%), by Application 2025 & 2033
- Figure 31: Europe Facial Beauty Devices Revenue (billion), by Types 2025 & 2033
- Figure 32: Europe Facial Beauty Devices Volume (K), by Types 2025 & 2033
- Figure 33: Europe Facial Beauty Devices Revenue Share (%), by Types 2025 & 2033
- Figure 34: Europe Facial Beauty Devices Volume Share (%), by Types 2025 & 2033
- Figure 35: Europe Facial Beauty Devices Revenue (billion), by Country 2025 & 2033
- Figure 36: Europe Facial Beauty Devices Volume (K), by Country 2025 & 2033
- Figure 37: Europe Facial Beauty Devices Revenue Share (%), by Country 2025 & 2033
- Figure 38: Europe Facial Beauty Devices Volume Share (%), by Country 2025 & 2033
- Figure 39: Middle East & Africa Facial Beauty Devices Revenue (billion), by Application 2025 & 2033
- Figure 40: Middle East & Africa Facial Beauty Devices Volume (K), by Application 2025 & 2033
- Figure 41: Middle East & Africa Facial Beauty Devices Revenue Share (%), by Application 2025 & 2033
- Figure 42: Middle East & Africa Facial Beauty Devices Volume Share (%), by Application 2025 & 2033
- Figure 43: Middle East & Africa Facial Beauty Devices Revenue (billion), by Types 2025 & 2033
- Figure 44: Middle East & Africa Facial Beauty Devices Volume (K), by Types 2025 & 2033
- Figure 45: Middle East & Africa Facial Beauty Devices Revenue Share (%), by Types 2025 & 2033
- Figure 46: Middle East & Africa Facial Beauty Devices Volume Share (%), by Types 2025 & 2033
- Figure 47: Middle East & Africa Facial Beauty Devices Revenue (billion), by Country 2025 & 2033
- Figure 48: Middle East & Africa Facial Beauty Devices Volume (K), by Country 2025 & 2033
- Figure 49: Middle East & Africa Facial Beauty Devices Revenue Share (%), by Country 2025 & 2033
- Figure 50: Middle East & Africa Facial Beauty Devices Volume Share (%), by Country 2025 & 2033
- Figure 51: Asia Pacific Facial Beauty Devices Revenue (billion), by Application 2025 & 2033
- Figure 52: Asia Pacific Facial Beauty Devices Volume (K), by Application 2025 & 2033
- Figure 53: Asia Pacific Facial Beauty Devices Revenue Share (%), by Application 2025 & 2033
- Figure 54: Asia Pacific Facial Beauty Devices Volume Share (%), by Application 2025 & 2033
- Figure 55: Asia Pacific Facial Beauty Devices Revenue (billion), by Types 2025 & 2033
- Figure 56: Asia Pacific Facial Beauty Devices Volume (K), by Types 2025 & 2033
- Figure 57: Asia Pacific Facial Beauty Devices Revenue Share (%), by Types 2025 & 2033
- Figure 58: Asia Pacific Facial Beauty Devices Volume Share (%), by Types 2025 & 2033
- Figure 59: Asia Pacific Facial Beauty Devices Revenue (billion), by Country 2025 & 2033
- Figure 60: Asia Pacific Facial Beauty Devices Volume (K), by Country 2025 & 2033
- Figure 61: Asia Pacific Facial Beauty Devices Revenue Share (%), by Country 2025 & 2033
- Figure 62: Asia Pacific Facial Beauty Devices Volume Share (%), by Country 2025 & 2033
List of Tables
- Table 1: Global Facial Beauty Devices Revenue billion Forecast, by Application 2020 & 2033
- Table 2: Global Facial Beauty Devices Volume K Forecast, by Application 2020 & 2033
- Table 3: Global Facial Beauty Devices Revenue billion Forecast, by Types 2020 & 2033
- Table 4: Global Facial Beauty Devices Volume K Forecast, by Types 2020 & 2033
- Table 5: Global Facial Beauty Devices Revenue billion Forecast, by Region 2020 & 2033
- Table 6: Global Facial Beauty Devices Volume K Forecast, by Region 2020 & 2033
- Table 7: Global Facial Beauty Devices Revenue billion Forecast, by Application 2020 & 2033
- Table 8: Global Facial Beauty Devices Volume K Forecast, by Application 2020 & 2033
- Table 9: Global Facial Beauty Devices Revenue billion Forecast, by Types 2020 & 2033
- Table 10: Global Facial Beauty Devices Volume K Forecast, by Types 2020 & 2033
- Table 11: Global Facial Beauty Devices Revenue billion Forecast, by Country 2020 & 2033
- Table 12: Global Facial Beauty Devices Volume K Forecast, by Country 2020 & 2033
- Table 13: United States Facial Beauty Devices Revenue (billion) Forecast, by Application 2020 & 2033
- Table 14: United States Facial Beauty Devices Volume (K) Forecast, by Application 2020 & 2033
- Table 15: Canada Facial Beauty Devices Revenue (billion) Forecast, by Application 2020 & 2033
- Table 16: Canada Facial Beauty Devices Volume (K) Forecast, by Application 2020 & 2033
- Table 17: Mexico Facial Beauty Devices Revenue (billion) Forecast, by Application 2020 & 2033
- Table 18: Mexico Facial Beauty Devices Volume (K) Forecast, by Application 2020 & 2033
- Table 19: Global Facial Beauty Devices Revenue billion Forecast, by Application 2020 & 2033
- Table 20: Global Facial Beauty Devices Volume K Forecast, by Application 2020 & 2033
- Table 21: Global Facial Beauty Devices Revenue billion Forecast, by Types 2020 & 2033
- Table 22: Global Facial Beauty Devices Volume K Forecast, by Types 2020 & 2033
- Table 23: Global Facial Beauty Devices Revenue billion Forecast, by Country 2020 & 2033
- Table 24: Global Facial Beauty Devices Volume K Forecast, by Country 2020 & 2033
- Table 25: Brazil Facial Beauty Devices Revenue (billion) Forecast, by Application 2020 & 2033
- Table 26: Brazil Facial Beauty Devices Volume (K) Forecast, by Application 2020 & 2033
- Table 27: Argentina Facial Beauty Devices Revenue (billion) Forecast, by Application 2020 & 2033
- Table 28: Argentina Facial Beauty Devices Volume (K) Forecast, by Application 2020 & 2033
- Table 29: Rest of South America Facial Beauty Devices Revenue (billion) Forecast, by Application 2020 & 2033
- Table 30: Rest of South America Facial Beauty Devices Volume (K) Forecast, by Application 2020 & 2033
- Table 31: Global Facial Beauty Devices Revenue billion Forecast, by Application 2020 & 2033
- Table 32: Global Facial Beauty Devices Volume K Forecast, by Application 2020 & 2033
- Table 33: Global Facial Beauty Devices Revenue billion Forecast, by Types 2020 & 2033
- Table 34: Global Facial Beauty Devices Volume K Forecast, by Types 2020 & 2033
- Table 35: Global Facial Beauty Devices Revenue billion Forecast, by Country 2020 & 2033
- Table 36: Global Facial Beauty Devices Volume K Forecast, by Country 2020 & 2033
- Table 37: United Kingdom Facial Beauty Devices Revenue (billion) Forecast, by Application 2020 & 2033
- Table 38: United Kingdom Facial Beauty Devices Volume (K) Forecast, by Application 2020 & 2033
- Table 39: Germany Facial Beauty Devices Revenue (billion) Forecast, by Application 2020 & 2033
- Table 40: Germany Facial Beauty Devices Volume (K) Forecast, by Application 2020 & 2033
- Table 41: France Facial Beauty Devices Revenue (billion) Forecast, by Application 2020 & 2033
- Table 42: France Facial Beauty Devices Volume (K) Forecast, by Application 2020 & 2033
- Table 43: Italy Facial Beauty Devices Revenue (billion) Forecast, by Application 2020 & 2033
- Table 44: Italy Facial Beauty Devices Volume (K) Forecast, by Application 2020 & 2033
- Table 45: Spain Facial Beauty Devices Revenue (billion) Forecast, by Application 2020 & 2033
- Table 46: Spain Facial Beauty Devices Volume (K) Forecast, by Application 2020 & 2033
- Table 47: Russia Facial Beauty Devices Revenue (billion) Forecast, by Application 2020 & 2033
- Table 48: Russia Facial Beauty Devices Volume (K) Forecast, by Application 2020 & 2033
- Table 49: Benelux Facial Beauty Devices Revenue (billion) Forecast, by Application 2020 & 2033
- Table 50: Benelux Facial Beauty Devices Volume (K) Forecast, by Application 2020 & 2033
- Table 51: Nordics Facial Beauty Devices Revenue (billion) Forecast, by Application 2020 & 2033
- Table 52: Nordics Facial Beauty Devices Volume (K) Forecast, by Application 2020 & 2033
- Table 53: Rest of Europe Facial Beauty Devices Revenue (billion) Forecast, by Application 2020 & 2033
- Table 54: Rest of Europe Facial Beauty Devices Volume (K) Forecast, by Application 2020 & 2033
- Table 55: Global Facial Beauty Devices Revenue billion Forecast, by Application 2020 & 2033
- Table 56: Global Facial Beauty Devices Volume K Forecast, by Application 2020 & 2033
- Table 57: Global Facial Beauty Devices Revenue billion Forecast, by Types 2020 & 2033
- Table 58: Global Facial Beauty Devices Volume K Forecast, by Types 2020 & 2033
- Table 59: Global Facial Beauty Devices Revenue billion Forecast, by Country 2020 & 2033
- Table 60: Global Facial Beauty Devices Volume K Forecast, by Country 2020 & 2033
- Table 61: Turkey Facial Beauty Devices Revenue (billion) Forecast, by Application 2020 & 2033
- Table 62: Turkey Facial Beauty Devices Volume (K) Forecast, by Application 2020 & 2033
- Table 63: Israel Facial Beauty Devices Revenue (billion) Forecast, by Application 2020 & 2033
- Table 64: Israel Facial Beauty Devices Volume (K) Forecast, by Application 2020 & 2033
- Table 65: GCC Facial Beauty Devices Revenue (billion) Forecast, by Application 2020 & 2033
- Table 66: GCC Facial Beauty Devices Volume (K) Forecast, by Application 2020 & 2033
- Table 67: North Africa Facial Beauty Devices Revenue (billion) Forecast, by Application 2020 & 2033
- Table 68: North Africa Facial Beauty Devices Volume (K) Forecast, by Application 2020 & 2033
- Table 69: South Africa Facial Beauty Devices Revenue (billion) Forecast, by Application 2020 & 2033
- Table 70: South Africa Facial Beauty Devices Volume (K) Forecast, by Application 2020 & 2033
- Table 71: Rest of Middle East & Africa Facial Beauty Devices Revenue (billion) Forecast, by Application 2020 & 2033
- Table 72: Rest of Middle East & Africa Facial Beauty Devices Volume (K) Forecast, by Application 2020 & 2033
- Table 73: Global Facial Beauty Devices Revenue billion Forecast, by Application 2020 & 2033
- Table 74: Global Facial Beauty Devices Volume K Forecast, by Application 2020 & 2033
- Table 75: Global Facial Beauty Devices Revenue billion Forecast, by Types 2020 & 2033
- Table 76: Global Facial Beauty Devices Volume K Forecast, by Types 2020 & 2033
- Table 77: Global Facial Beauty Devices Revenue billion Forecast, by Country 2020 & 2033
- Table 78: Global Facial Beauty Devices Volume K Forecast, by Country 2020 & 2033
- Table 79: China Facial Beauty Devices Revenue (billion) Forecast, by Application 2020 & 2033
- Table 80: China Facial Beauty Devices Volume (K) Forecast, by Application 2020 & 2033
- Table 81: India Facial Beauty Devices Revenue (billion) Forecast, by Application 2020 & 2033
- Table 82: India Facial Beauty Devices Volume (K) Forecast, by Application 2020 & 2033
- Table 83: Japan Facial Beauty Devices Revenue (billion) Forecast, by Application 2020 & 2033
- Table 84: Japan Facial Beauty Devices Volume (K) Forecast, by Application 2020 & 2033
- Table 85: South Korea Facial Beauty Devices Revenue (billion) Forecast, by Application 2020 & 2033
- Table 86: South Korea Facial Beauty Devices Volume (K) Forecast, by Application 2020 & 2033
- Table 87: ASEAN Facial Beauty Devices Revenue (billion) Forecast, by Application 2020 & 2033
- Table 88: ASEAN Facial Beauty Devices Volume (K) Forecast, by Application 2020 & 2033
- Table 89: Oceania Facial Beauty Devices Revenue (billion) Forecast, by Application 2020 & 2033
- Table 90: Oceania Facial Beauty Devices Volume (K) Forecast, by Application 2020 & 2033
- Table 91: Rest of Asia Pacific Facial Beauty Devices Revenue (billion) Forecast, by Application 2020 & 2033
- Table 92: Rest of Asia Pacific Facial Beauty Devices Volume (K) Forecast, by Application 2020 & 2033
Frequently Asked Questions
1. What is the projected Compound Annual Growth Rate (CAGR) of the Facial Beauty Devices?
The projected CAGR is approximately 16.3%.
2. Which companies are prominent players in the Facial Beauty Devices?
Key companies in the market include Procter and Gamble, Philips, Panasonic, Nu Skin Enterprises, L’Oreal (Clarisonic), Conair, MTG (Refa), Remington, YA-MAN, FOREO, Silk’n, Carol Cole (NuFace), KAKUSAN, Quasar MD, Kingdom, Tria, SmoothSkin, Tripollar, Hitachi, Newa.
3. What are the main segments of the Facial Beauty Devices?
The market segments include Application, Types.
4. Can you provide details about the market size?
The market size is estimated to be USD 22.35 billion as of 2022.
5. What are some drivers contributing to market growth?
N/A
6. What are the notable trends driving market growth?
N/A
7. Are there any restraints impacting market growth?
N/A
8. Can you provide examples of recent developments in the market?
N/A
9. What pricing options are available for accessing the report?
Pricing options include single-user, multi-user, and enterprise licenses priced at USD 3350.00, USD 5025.00, and USD 6700.00 respectively.
10. Is the market size provided in terms of value or volume?
The market size is provided in terms of value, measured in billion and volume, measured in K.
11. Are there any specific market keywords associated with the report?
Yes, the market keyword associated with the report is "Facial Beauty Devices," which aids in identifying and referencing the specific market segment covered.
12. How do I determine which pricing option suits my needs best?
The pricing options vary based on user requirements and access needs. Individual users may opt for single-user licenses, while businesses requiring broader access may choose multi-user or enterprise licenses for cost-effective access to the report.
13. Are there any additional resources or data provided in the Facial Beauty Devices report?
While the report offers comprehensive insights, it's advisable to review the specific contents or supplementary materials provided to ascertain if additional resources or data are available.
14. How can I stay updated on further developments or reports in the Facial Beauty Devices?
To stay informed about further developments, trends, and reports in the Facial Beauty Devices, consider subscribing to industry newsletters, following relevant companies and organizations, or regularly checking reputable industry news sources and publications.
Methodology
Step 1 - Identification of Relevant Samples Size from Population Database


Step 2 - Approaches for Defining Global Market Size (Value, Volume* & Price*)

Note*: In applicable scenarios
Step 3 - Data Sources
Primary Research
- Web Analytics
- Survey Reports
- Research Institute
- Latest Research Reports
- Opinion Leaders
Secondary Research
- Annual Reports
- White Paper
- Latest Press Release
- Industry Association
- Paid Database
- Investor Presentations

Step 4 - Data Triangulation
Involves using different sources of information in order to increase the validity of a study
These sources are likely to be stakeholders in a program - participants, other researchers, program staff, other community members, and so on.
Then we put all data in single framework & apply various statistical tools to find out the dynamic on the market.
During the analysis stage, feedback from the stakeholder groups would be compared to determine areas of agreement as well as areas of divergence