

Key Insights
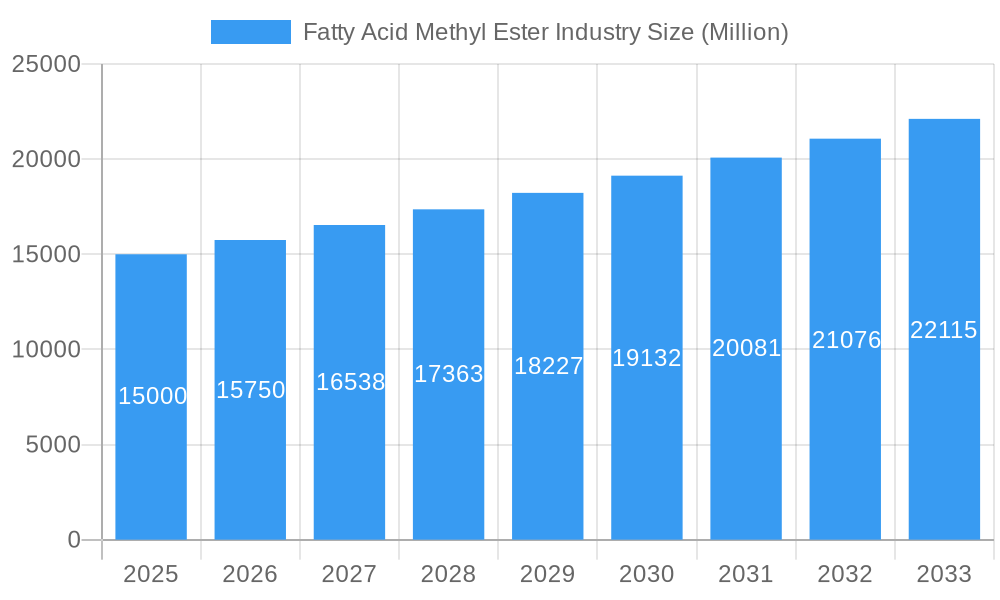
The global Fatty Acid Methyl Ester (FAME) market, with an estimated size of $23.2 billion in the base year 2024, is projected to witness substantial expansion, achieving a Compound Annual Growth Rate (CAGR) of 5.6%. This robust growth trajectory is primarily propelled by the escalating demand for sustainable biofuels, a consequence of increasingly stringent environmental regulations and the imperative to transition away from petroleum-based fuels. Growing global consciousness regarding the environmental impact of fossil fuels is a significant catalyst, prompting governments and industries worldwide to embrace renewable energy solutions. Beyond its critical role in biofuels, FAMEs demonstrate remarkable versatility, finding extensive applications in lubricants, coatings, food and agriculture, and personal care products. Fuel applications currently represent the dominant market segment, followed by lubricants and coatings. Rapeseed methyl ester and soy methyl ester are leading types, benefiting from abundant feedstock availability and established production infrastructure. Nevertheless, ongoing research and development efforts are fostering the emergence of novel FAME types, driven by the exploration of alternative feedstocks and the pursuit of enhanced performance characteristics. Geographically, North America and Europe currently lead the market, with the Asia-Pacific region anticipated to experience significant growth due to increasing industrialization and supportive government policies promoting biofuel adoption.
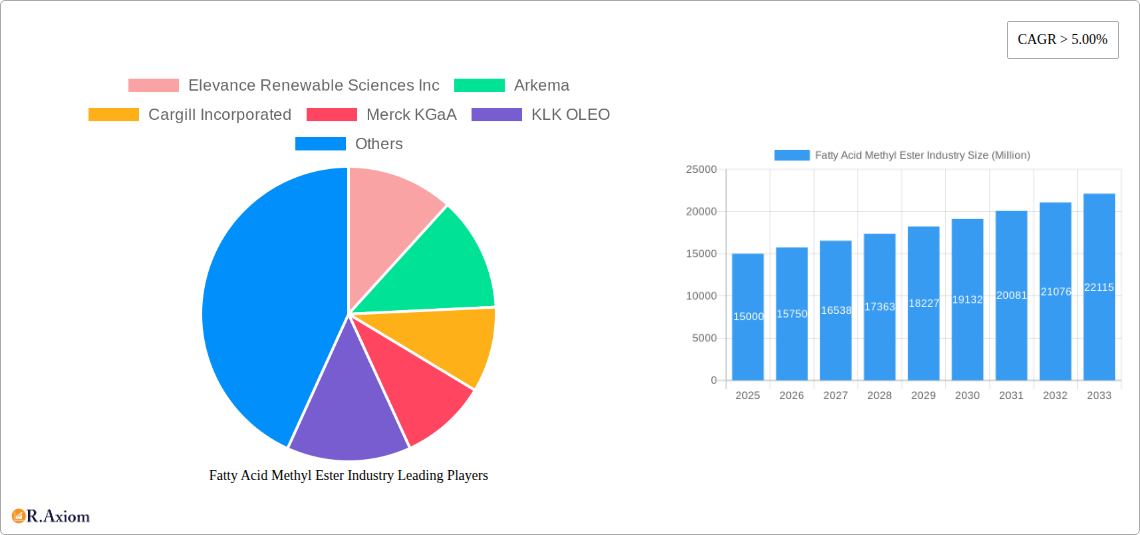
Fatty Acid Methyl Ester Industry Market Size (In Billion)
The competitive environment is characterized by dynamic evolution, with continuous investments in research and development fueling innovations in feedstock utilization and production processes. Market participants are prioritizing the enhancement of FAME production efficiency and sustainability, investigating new feedstocks, and developing advanced technologies to elevate FAME quality and performance. While challenges such as fluctuating raw material prices and potential competition from alternative biofuels exist, the long-term growth outlook remains highly positive, underpinned by the global drive towards renewable energy and the rising demand for eco-friendly products across diverse industries. Strategic collaborations, mergers, and acquisitions are anticipated to further shape the market's future landscape.
Fatty Acid Methyl Ester Industry Company Market Share
Fatty Acid Methyl Ester (FAME) Industry: A Comprehensive Market Report (2019-2033)
This detailed report provides a comprehensive analysis of the global Fatty Acid Methyl Ester (FAME) industry, offering valuable insights for stakeholders seeking to understand market dynamics, growth opportunities, and competitive landscapes. The report covers the period 2019-2033, with a focus on the forecast period 2025-2033 and a base year of 2025. The analysis incorporates key market segments, leading players, and emerging trends to provide a holistic view of this dynamic sector.
Fatty Acid Methyl Ester Industry Market Concentration & Innovation
The FAME industry exhibits a moderately concentrated market structure, with key players like Cargill Incorporated, BASF SE, and Wilmar International Ltd holding significant market share. The combined market share of the top five players is estimated at xx% in 2025. Innovation in the FAME industry is driven by the need for sustainable and cost-effective feedstocks, advancements in production technologies (e.g., improved catalysts and reaction processes), and increasing demand for specialized FAME applications. Stringent environmental regulations and the push for biofuel adoption are further catalysts for innovation.
Mergers and acquisitions (M&A) activity has been moderate, with deal values totaling approximately xx Million in the past five years. These transactions primarily focused on expanding production capacity, securing feedstock supplies, and entering new geographic markets. Product substitution is a key competitive factor, with other biofuels and petroleum-based products vying for market share. End-user trends towards sustainability and bio-based materials are driving demand for FAME in various applications, particularly in the fuel and lubricant segments.
Fatty Acid Methyl Ester Industry Industry Trends & Insights
The global FAME market is experiencing robust growth, with a projected Compound Annual Growth Rate (CAGR) of xx% during the forecast period (2025-2033). This growth is primarily driven by increasing demand for renewable fuels, stringent government regulations promoting biofuel adoption (e.g., mandates for blending biofuels with conventional fuels), and the expanding applications of FAME in various industries. Technological disruptions, such as advancements in transesterification processes and catalyst development, are enhancing the efficiency and cost-effectiveness of FAME production. Consumer preferences for sustainable and environmentally friendly products are also contributing to the market's growth. Competitive dynamics are characterized by price competition, product differentiation, and strategic alliances among key players. Market penetration of FAME in certain applications, such as lubricants and coatings, is still relatively low but is expected to increase significantly over the forecast period, reaching xx% by 2033.
Dominant Markets & Segments in Fatty Acid Methyl Ester Industry
The Asia-Pacific region is currently the dominant market for FAME, driven by strong economic growth, increasing demand for biofuels in countries like India and China, and substantial feedstock availability. Europe also holds a significant market share, fueled by stringent emission regulations and supportive government policies.
Key Drivers for Dominant Regions:
- Asia-Pacific: Rapid economic growth, increasing energy demand, government mandates for biofuel blending, and abundant feedstock resources (palm oil, soybean oil).
- Europe: Stringent environmental regulations, supportive policies promoting renewable energy, and a well-established biofuel infrastructure.
Dominant Segments:
- Application: Fuel currently dominates the market, followed by lubricants. The food and agriculture segment is witnessing increasing demand for FAME as a sustainable feed additive and emulsifier.
- Type: Soy Methyl Ester and Palm Oil Methyl Ester are currently the most widely used types of FAME, benefiting from large-scale production and relatively low costs.
Fatty Acid Methyl Ester Industry Product Developments
Recent product innovations focus on improving the quality and performance of FAME, including the development of FAME blends with enhanced cold flow properties and improved oxidative stability. These developments are broadening the applications of FAME and increasing its competitiveness against conventional petroleum-based products. Technological trends include the use of advanced catalysts, optimization of reaction processes, and the development of bio-based additives to enhance FAME properties. These advancements contribute to improved market fit by addressing specific end-user requirements across various applications.
Report Scope & Segmentation Analysis
This report segments the FAME market by application (Fuel, Lubricants, Coatings, Food and Agriculture, Metalworking Fluids, Personal Care Products, Other Applications) and by type (Rapeseed Methyl Ester, Soy Methyl Ester, Palm Oil Methyl Ester, Other Types). Each segment's growth projections, market sizes, and competitive dynamics are analyzed in detail. The Fuel segment exhibits the highest growth potential, driven by increasing government mandates for biofuel blending. Soy Methyl Ester and Palm Oil Methyl Ester represent the largest segments by type, due to their wide availability and relatively low cost. The competitive dynamics within each segment are influenced by factors like production capacity, feedstock costs, and technological advancements.
Key Drivers of Fatty Acid Methyl Ester Industry Growth
The growth of the FAME industry is primarily driven by:
- Increasing demand for renewable fuels: Governments worldwide are promoting the use of biofuels to reduce greenhouse gas emissions and enhance energy security.
- Stringent environmental regulations: Regulations aimed at reducing air pollution and carbon emissions are driving the adoption of FAME as a cleaner alternative to fossil fuels.
- Technological advancements: Improvements in production technologies are making FAME production more efficient and cost-effective.
- Expanding applications: FAME is finding increasing applications in various industries beyond fuel, including lubricants, coatings, and food & agriculture.
Challenges in the Fatty Acid Methyl Ester Industry Sector
The FAME industry faces several challenges, including:
- Fluctuating feedstock prices: The cost of raw materials (vegetable oils) significantly impacts FAME production costs and profitability.
- Competition from other biofuels: FAME competes with other biofuels, such as biodiesel and ethanol, for market share.
- Technical limitations: Certain applications require FAME with specific properties, necessitating further technological advancements.
- Supply chain constraints: Efficient and reliable supply chains are essential for the consistent supply of raw materials and distribution of FAME products.
Emerging Opportunities in Fatty Acid Methyl Ester Industry
Emerging opportunities for the FAME industry include:
- Development of advanced FAME blends: Formulating FAME blends with enhanced properties to meet specific application needs.
- Expansion into new markets: Exploring emerging markets with high growth potential for biofuels and other FAME applications.
- Integration with circular economy models: Utilizing waste oils and fats as feedstock for FAME production.
- Technological innovations: Developing new technologies to improve the efficiency and sustainability of FAME production.
Leading Players in the Fatty Acid Methyl Ester Industry Market
- Elevance Renewable Sciences Inc
- Arkema
- Cargill Incorporated
- Merck KGaA
- KLK OLEO
- Wilmar International Ltd
- TCI Chemicals (India) Pvt Ltd
- BASF SE
- Krishi Oils Limited
- Larodan AB (ABITEC)
- Univar Solutions Inc
- Cayman Chemical
Key Developments in Fatty Acid Methyl Ester Industry Industry
- 2022 Q4: Cargill Incorporated announced a significant expansion of its FAME production capacity in [Location].
- 2023 Q1: BASF SE launched a new FAME blend with improved cold flow properties.
- 2023 Q3: A merger between two smaller FAME producers resulted in a xx Million deal. (Further details are provided in the complete report)
Strategic Outlook for Fatty Acid Methyl Ester Industry Market
The FAME industry is poised for continued growth, driven by increasing demand for sustainable fuels, supportive government policies, and technological advancements. Future market potential is substantial, especially in emerging economies with growing energy demands. Opportunities lie in the development of specialized FAME products, expansion into new application areas, and integration with circular economy models. The industry will need to focus on optimizing production efficiency, securing reliable feedstock supplies, and addressing environmental concerns to sustain long-term growth. The market is expected to surpass xx Million by 2033, presenting significant opportunities for investors and industry players.
Fatty Acid Methyl Ester Industry Segmentation
-
1. Type
- 1.1. Rapeseed Methyl Ester
- 1.2. Soy Methyl Ester
- 1.3. Palm Oil Methyl Ester
- 1.4. Other Types
-
2. Application
- 2.1. Fuel
- 2.2. Lubricants
- 2.3. Coatings
- 2.4. Food and Agriculture
- 2.5. Metalworking Fluids
- 2.6. Personal Care Products
- 2.7. Other Applications
Fatty Acid Methyl Ester Industry Segmentation By Geography
-
1. Asia Pacific
- 1.1. China
- 1.2. India
- 1.3. Japan
- 1.4. South Korea
- 1.5. Rest of Asia Pacific
-
2. North America
- 2.1. United States
- 2.2. Canada
- 2.3. Mexico
-
3. Europe
- 3.1. Germany
- 3.2. United Kingdom
- 3.3. France
- 3.4. Italy
- 3.5. Rest of Europe
-
4. South America
- 4.1. Brazil
- 4.2. Argentina
- 4.3. Rest of South America
-
5. Middle East and Africa
- 5.1. Saudi Arabia
- 5.2. South Africa
- 5.3. Rest of Middle East and Africa
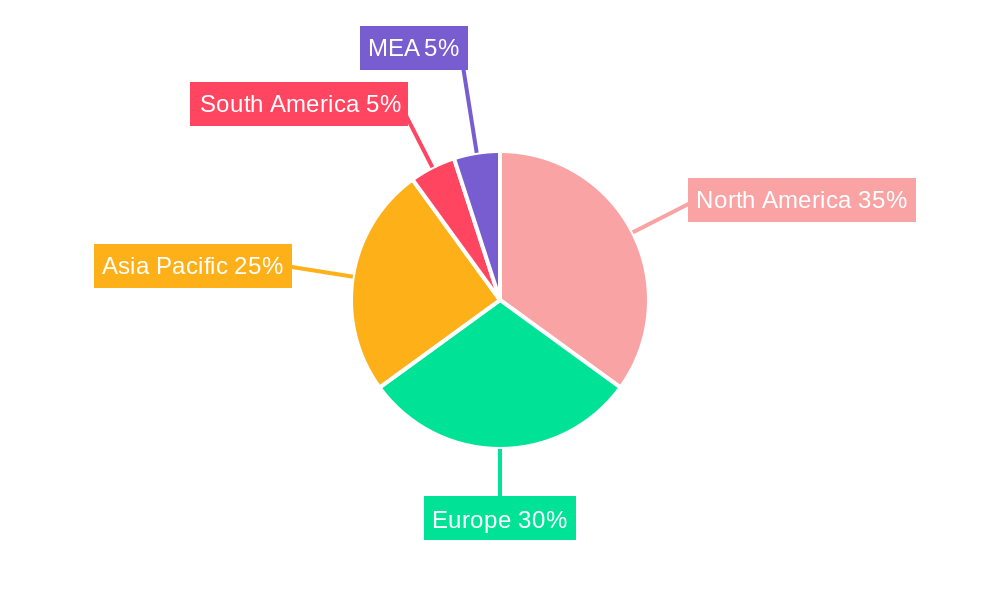
Fatty Acid Methyl Ester Industry Regional Market Share
Geographic Coverage of Fatty Acid Methyl Ester Industry
Fatty Acid Methyl Ester Industry REPORT HIGHLIGHTS
| Aspects | Details |
|---|---|
| Study Period | 2020-2034 |
| Base Year | 2025 |
| Estimated Year | 2026 |
| Forecast Period | 2026-2034 |
| Historical Period | 2020-2025 |
| Growth Rate | CAGR of 5.6% from 2020-2034 |
| Segmentation |
|
Table of Contents
- 1. Introduction
- 1.1. Research Scope
- 1.2. Market Segmentation
- 1.3. Research Objective
- 1.4. Definitions and Assumptions
- 2. Executive Summary
- 2.1. Market Snapshot
- 3. Market Dynamics
- 3.1. Market Drivers
- 3.2. Market Restrains
- 3.3. Market Trends
- 3.4. Market Opportunities
- 4. Market Factor Analysis
- 4.1. Porters Five Forces
- 4.1.1. Bargaining Power of Suppliers
- 4.1.2. Bargaining Power of Buyers
- 4.1.3. Threat of New Entrants
- 4.1.4. Threat of Substitutes
- 4.1.5. Competitive Rivalry
- 4.2. PESTEL analysis
- 4.3. BCG Analysis
- 4.3.1. Stars (High Growth, High Market Share)
- 4.3.2. Cash Cows (Low Growth, High Market Share)
- 4.3.3. Question Mark (High Growth, Low Market Share)
- 4.3.4. Dogs (Low Growth, Low Market Share)
- 4.4. Ansoff Matrix Analysis
- 4.5. Supply Chain Analysis
- 4.6. Regulatory Landscape
- 4.7. Current Market Potential and Opportunity Assessment (TAM–SAM–SOM Framework)
- 4.8. RAX Analyst Note
- 4.1. Porters Five Forces
- 5. Market Analysis, Insights and Forecast 2021-2033
- 5.1. Market Analysis, Insights and Forecast - by Type
- 5.1.1. Rapeseed Methyl Ester
- 5.1.2. Soy Methyl Ester
- 5.1.3. Palm Oil Methyl Ester
- 5.1.4. Other Types
- 5.2. Market Analysis, Insights and Forecast - by Application
- 5.2.1. Fuel
- 5.2.2. Lubricants
- 5.2.3. Coatings
- 5.2.4. Food and Agriculture
- 5.2.5. Metalworking Fluids
- 5.2.6. Personal Care Products
- 5.2.7. Other Applications
- 5.3. Market Analysis, Insights and Forecast - by Region
- 5.3.1. Asia Pacific
- 5.3.2. North America
- 5.3.3. Europe
- 5.3.4. South America
- 5.3.5. Middle East and Africa
- 5.1. Market Analysis, Insights and Forecast - by Type
- 6. Global Fatty Acid Methyl Ester Industry Analysis, Insights and Forecast, 2021-2033
- 6.1. Market Analysis, Insights and Forecast - by Type
- 6.1.1. Rapeseed Methyl Ester
- 6.1.2. Soy Methyl Ester
- 6.1.3. Palm Oil Methyl Ester
- 6.1.4. Other Types
- 6.2. Market Analysis, Insights and Forecast - by Application
- 6.2.1. Fuel
- 6.2.2. Lubricants
- 6.2.3. Coatings
- 6.2.4. Food and Agriculture
- 6.2.5. Metalworking Fluids
- 6.2.6. Personal Care Products
- 6.2.7. Other Applications
- 6.1. Market Analysis, Insights and Forecast - by Type
- 7. Asia Pacific Fatty Acid Methyl Ester Industry Analysis, Insights and Forecast, 2020-2032
- 7.1. Market Analysis, Insights and Forecast - by Type
- 7.1.1. Rapeseed Methyl Ester
- 7.1.2. Soy Methyl Ester
- 7.1.3. Palm Oil Methyl Ester
- 7.1.4. Other Types
- 7.2. Market Analysis, Insights and Forecast - by Application
- 7.2.1. Fuel
- 7.2.2. Lubricants
- 7.2.3. Coatings
- 7.2.4. Food and Agriculture
- 7.2.5. Metalworking Fluids
- 7.2.6. Personal Care Products
- 7.2.7. Other Applications
- 7.1. Market Analysis, Insights and Forecast - by Type
- 8. North America Fatty Acid Methyl Ester Industry Analysis, Insights and Forecast, 2020-2032
- 8.1. Market Analysis, Insights and Forecast - by Type
- 8.1.1. Rapeseed Methyl Ester
- 8.1.2. Soy Methyl Ester
- 8.1.3. Palm Oil Methyl Ester
- 8.1.4. Other Types
- 8.2. Market Analysis, Insights and Forecast - by Application
- 8.2.1. Fuel
- 8.2.2. Lubricants
- 8.2.3. Coatings
- 8.2.4. Food and Agriculture
- 8.2.5. Metalworking Fluids
- 8.2.6. Personal Care Products
- 8.2.7. Other Applications
- 8.1. Market Analysis, Insights and Forecast - by Type
- 9. Europe Fatty Acid Methyl Ester Industry Analysis, Insights and Forecast, 2020-2032
- 9.1. Market Analysis, Insights and Forecast - by Type
- 9.1.1. Rapeseed Methyl Ester
- 9.1.2. Soy Methyl Ester
- 9.1.3. Palm Oil Methyl Ester
- 9.1.4. Other Types
- 9.2. Market Analysis, Insights and Forecast - by Application
- 9.2.1. Fuel
- 9.2.2. Lubricants
- 9.2.3. Coatings
- 9.2.4. Food and Agriculture
- 9.2.5. Metalworking Fluids
- 9.2.6. Personal Care Products
- 9.2.7. Other Applications
- 9.1. Market Analysis, Insights and Forecast - by Type
- 10. South America Fatty Acid Methyl Ester Industry Analysis, Insights and Forecast, 2020-2032
- 10.1. Market Analysis, Insights and Forecast - by Type
- 10.1.1. Rapeseed Methyl Ester
- 10.1.2. Soy Methyl Ester
- 10.1.3. Palm Oil Methyl Ester
- 10.1.4. Other Types
- 10.2. Market Analysis, Insights and Forecast - by Application
- 10.2.1. Fuel
- 10.2.2. Lubricants
- 10.2.3. Coatings
- 10.2.4. Food and Agriculture
- 10.2.5. Metalworking Fluids
- 10.2.6. Personal Care Products
- 10.2.7. Other Applications
- 10.1. Market Analysis, Insights and Forecast - by Type
- 11. Middle East and Africa Fatty Acid Methyl Ester Industry Analysis, Insights and Forecast, 2020-2032
- 11.1. Market Analysis, Insights and Forecast - by Type
- 11.1.1. Rapeseed Methyl Ester
- 11.1.2. Soy Methyl Ester
- 11.1.3. Palm Oil Methyl Ester
- 11.1.4. Other Types
- 11.2. Market Analysis, Insights and Forecast - by Application
- 11.2.1. Fuel
- 11.2.2. Lubricants
- 11.2.3. Coatings
- 11.2.4. Food and Agriculture
- 11.2.5. Metalworking Fluids
- 11.2.6. Personal Care Products
- 11.2.7. Other Applications
- 11.1. Market Analysis, Insights and Forecast - by Type
- 12. Competitive Analysis
- 12.1. Company Profiles
- 12.1.1 Elevance Renewable Sciences Inc
- 12.1.1.1. Company Overview
- 12.1.1.2. Products
- 12.1.1.3. Company Financials
- 12.1.1.4. SWOT Analysis
- 12.1.2 Arkema
- 12.1.2.1. Company Overview
- 12.1.2.2. Products
- 12.1.2.3. Company Financials
- 12.1.2.4. SWOT Analysis
- 12.1.3 Cargill Incorporated
- 12.1.3.1. Company Overview
- 12.1.3.2. Products
- 12.1.3.3. Company Financials
- 12.1.3.4. SWOT Analysis
- 12.1.4 Merck KGaA
- 12.1.4.1. Company Overview
- 12.1.4.2. Products
- 12.1.4.3. Company Financials
- 12.1.4.4. SWOT Analysis
- 12.1.5 KLK OLEO
- 12.1.5.1. Company Overview
- 12.1.5.2. Products
- 12.1.5.3. Company Financials
- 12.1.5.4. SWOT Analysis
- 12.1.6 Wilmar International Ltd
- 12.1.6.1. Company Overview
- 12.1.6.2. Products
- 12.1.6.3. Company Financials
- 12.1.6.4. SWOT Analysis
- 12.1.7 TCI Chemicals (India) Pvt Ltd
- 12.1.7.1. Company Overview
- 12.1.7.2. Products
- 12.1.7.3. Company Financials
- 12.1.7.4. SWOT Analysis
- 12.1.8 BASF SE
- 12.1.8.1. Company Overview
- 12.1.8.2. Products
- 12.1.8.3. Company Financials
- 12.1.8.4. SWOT Analysis
- 12.1.9 Krishi Oils Limited
- 12.1.9.1. Company Overview
- 12.1.9.2. Products
- 12.1.9.3. Company Financials
- 12.1.9.4. SWOT Analysis
- 12.1.10 Larodan AB (ABITEC)
- 12.1.10.1. Company Overview
- 12.1.10.2. Products
- 12.1.10.3. Company Financials
- 12.1.10.4. SWOT Analysis
- 12.1.11 Univar Solutions Inc
- 12.1.11.1. Company Overview
- 12.1.11.2. Products
- 12.1.11.3. Company Financials
- 12.1.11.4. SWOT Analysis
- 12.1.12 Cayman Chemical
- 12.1.12.1. Company Overview
- 12.1.12.2. Products
- 12.1.12.3. Company Financials
- 12.1.12.4. SWOT Analysis
- 12.1.1 Elevance Renewable Sciences Inc
- 12.2. Market Entropy
- 12.2.1 Company's Key Areas Served
- 12.2.2 Recent Developments
- 12.3. Company Market Share Analysis 2025
- 12.3.1 Top 5 Companies Market Share Analysis
- 12.3.2 Top 3 Companies Market Share Analysis
- 12.4. List of Potential Customers
- 13. Research Methodology
List of Figures
- Figure 1: Global Fatty Acid Methyl Ester Industry Revenue Breakdown (billion, %) by Region 2025 & 2033
- Figure 2: Global Fatty Acid Methyl Ester Industry Volume Breakdown (K Tons, %) by Region 2025 & 2033
- Figure 3: Asia Pacific Fatty Acid Methyl Ester Industry Revenue (billion), by Type 2025 & 2033
- Figure 4: Asia Pacific Fatty Acid Methyl Ester Industry Volume (K Tons), by Type 2025 & 2033
- Figure 5: Asia Pacific Fatty Acid Methyl Ester Industry Revenue Share (%), by Type 2025 & 2033
- Figure 6: Asia Pacific Fatty Acid Methyl Ester Industry Volume Share (%), by Type 2025 & 2033
- Figure 7: Asia Pacific Fatty Acid Methyl Ester Industry Revenue (billion), by Application 2025 & 2033
- Figure 8: Asia Pacific Fatty Acid Methyl Ester Industry Volume (K Tons), by Application 2025 & 2033
- Figure 9: Asia Pacific Fatty Acid Methyl Ester Industry Revenue Share (%), by Application 2025 & 2033
- Figure 10: Asia Pacific Fatty Acid Methyl Ester Industry Volume Share (%), by Application 2025 & 2033
- Figure 11: Asia Pacific Fatty Acid Methyl Ester Industry Revenue (billion), by Country 2025 & 2033
- Figure 12: Asia Pacific Fatty Acid Methyl Ester Industry Volume (K Tons), by Country 2025 & 2033
- Figure 13: Asia Pacific Fatty Acid Methyl Ester Industry Revenue Share (%), by Country 2025 & 2033
- Figure 14: Asia Pacific Fatty Acid Methyl Ester Industry Volume Share (%), by Country 2025 & 2033
- Figure 15: North America Fatty Acid Methyl Ester Industry Revenue (billion), by Type 2025 & 2033
- Figure 16: North America Fatty Acid Methyl Ester Industry Volume (K Tons), by Type 2025 & 2033
- Figure 17: North America Fatty Acid Methyl Ester Industry Revenue Share (%), by Type 2025 & 2033
- Figure 18: North America Fatty Acid Methyl Ester Industry Volume Share (%), by Type 2025 & 2033
- Figure 19: North America Fatty Acid Methyl Ester Industry Revenue (billion), by Application 2025 & 2033
- Figure 20: North America Fatty Acid Methyl Ester Industry Volume (K Tons), by Application 2025 & 2033
- Figure 21: North America Fatty Acid Methyl Ester Industry Revenue Share (%), by Application 2025 & 2033
- Figure 22: North America Fatty Acid Methyl Ester Industry Volume Share (%), by Application 2025 & 2033
- Figure 23: North America Fatty Acid Methyl Ester Industry Revenue (billion), by Country 2025 & 2033
- Figure 24: North America Fatty Acid Methyl Ester Industry Volume (K Tons), by Country 2025 & 2033
- Figure 25: North America Fatty Acid Methyl Ester Industry Revenue Share (%), by Country 2025 & 2033
- Figure 26: North America Fatty Acid Methyl Ester Industry Volume Share (%), by Country 2025 & 2033
- Figure 27: Europe Fatty Acid Methyl Ester Industry Revenue (billion), by Type 2025 & 2033
- Figure 28: Europe Fatty Acid Methyl Ester Industry Volume (K Tons), by Type 2025 & 2033
- Figure 29: Europe Fatty Acid Methyl Ester Industry Revenue Share (%), by Type 2025 & 2033
- Figure 30: Europe Fatty Acid Methyl Ester Industry Volume Share (%), by Type 2025 & 2033
- Figure 31: Europe Fatty Acid Methyl Ester Industry Revenue (billion), by Application 2025 & 2033
- Figure 32: Europe Fatty Acid Methyl Ester Industry Volume (K Tons), by Application 2025 & 2033
- Figure 33: Europe Fatty Acid Methyl Ester Industry Revenue Share (%), by Application 2025 & 2033
- Figure 34: Europe Fatty Acid Methyl Ester Industry Volume Share (%), by Application 2025 & 2033
- Figure 35: Europe Fatty Acid Methyl Ester Industry Revenue (billion), by Country 2025 & 2033
- Figure 36: Europe Fatty Acid Methyl Ester Industry Volume (K Tons), by Country 2025 & 2033
- Figure 37: Europe Fatty Acid Methyl Ester Industry Revenue Share (%), by Country 2025 & 2033
- Figure 38: Europe Fatty Acid Methyl Ester Industry Volume Share (%), by Country 2025 & 2033
- Figure 39: South America Fatty Acid Methyl Ester Industry Revenue (billion), by Type 2025 & 2033
- Figure 40: South America Fatty Acid Methyl Ester Industry Volume (K Tons), by Type 2025 & 2033
- Figure 41: South America Fatty Acid Methyl Ester Industry Revenue Share (%), by Type 2025 & 2033
- Figure 42: South America Fatty Acid Methyl Ester Industry Volume Share (%), by Type 2025 & 2033
- Figure 43: South America Fatty Acid Methyl Ester Industry Revenue (billion), by Application 2025 & 2033
- Figure 44: South America Fatty Acid Methyl Ester Industry Volume (K Tons), by Application 2025 & 2033
- Figure 45: South America Fatty Acid Methyl Ester Industry Revenue Share (%), by Application 2025 & 2033
- Figure 46: South America Fatty Acid Methyl Ester Industry Volume Share (%), by Application 2025 & 2033
- Figure 47: South America Fatty Acid Methyl Ester Industry Revenue (billion), by Country 2025 & 2033
- Figure 48: South America Fatty Acid Methyl Ester Industry Volume (K Tons), by Country 2025 & 2033
- Figure 49: South America Fatty Acid Methyl Ester Industry Revenue Share (%), by Country 2025 & 2033
- Figure 50: South America Fatty Acid Methyl Ester Industry Volume Share (%), by Country 2025 & 2033
- Figure 51: Middle East and Africa Fatty Acid Methyl Ester Industry Revenue (billion), by Type 2025 & 2033
- Figure 52: Middle East and Africa Fatty Acid Methyl Ester Industry Volume (K Tons), by Type 2025 & 2033
- Figure 53: Middle East and Africa Fatty Acid Methyl Ester Industry Revenue Share (%), by Type 2025 & 2033
- Figure 54: Middle East and Africa Fatty Acid Methyl Ester Industry Volume Share (%), by Type 2025 & 2033
- Figure 55: Middle East and Africa Fatty Acid Methyl Ester Industry Revenue (billion), by Application 2025 & 2033
- Figure 56: Middle East and Africa Fatty Acid Methyl Ester Industry Volume (K Tons), by Application 2025 & 2033
- Figure 57: Middle East and Africa Fatty Acid Methyl Ester Industry Revenue Share (%), by Application 2025 & 2033
- Figure 58: Middle East and Africa Fatty Acid Methyl Ester Industry Volume Share (%), by Application 2025 & 2033
- Figure 59: Middle East and Africa Fatty Acid Methyl Ester Industry Revenue (billion), by Country 2025 & 2033
- Figure 60: Middle East and Africa Fatty Acid Methyl Ester Industry Volume (K Tons), by Country 2025 & 2033
- Figure 61: Middle East and Africa Fatty Acid Methyl Ester Industry Revenue Share (%), by Country 2025 & 2033
- Figure 62: Middle East and Africa Fatty Acid Methyl Ester Industry Volume Share (%), by Country 2025 & 2033
List of Tables
- Table 1: Global Fatty Acid Methyl Ester Industry Revenue billion Forecast, by Type 2020 & 2033
- Table 2: Global Fatty Acid Methyl Ester Industry Volume K Tons Forecast, by Type 2020 & 2033
- Table 3: Global Fatty Acid Methyl Ester Industry Revenue billion Forecast, by Application 2020 & 2033
- Table 4: Global Fatty Acid Methyl Ester Industry Volume K Tons Forecast, by Application 2020 & 2033
- Table 5: Global Fatty Acid Methyl Ester Industry Revenue billion Forecast, by Region 2020 & 2033
- Table 6: Global Fatty Acid Methyl Ester Industry Volume K Tons Forecast, by Region 2020 & 2033
- Table 7: Global Fatty Acid Methyl Ester Industry Revenue billion Forecast, by Type 2020 & 2033
- Table 8: Global Fatty Acid Methyl Ester Industry Volume K Tons Forecast, by Type 2020 & 2033
- Table 9: Global Fatty Acid Methyl Ester Industry Revenue billion Forecast, by Application 2020 & 2033
- Table 10: Global Fatty Acid Methyl Ester Industry Volume K Tons Forecast, by Application 2020 & 2033
- Table 11: Global Fatty Acid Methyl Ester Industry Revenue billion Forecast, by Country 2020 & 2033
- Table 12: Global Fatty Acid Methyl Ester Industry Volume K Tons Forecast, by Country 2020 & 2033
- Table 13: China Fatty Acid Methyl Ester Industry Revenue (billion) Forecast, by Application 2020 & 2033
- Table 14: China Fatty Acid Methyl Ester Industry Volume (K Tons) Forecast, by Application 2020 & 2033
- Table 15: India Fatty Acid Methyl Ester Industry Revenue (billion) Forecast, by Application 2020 & 2033
- Table 16: India Fatty Acid Methyl Ester Industry Volume (K Tons) Forecast, by Application 2020 & 2033
- Table 17: Japan Fatty Acid Methyl Ester Industry Revenue (billion) Forecast, by Application 2020 & 2033
- Table 18: Japan Fatty Acid Methyl Ester Industry Volume (K Tons) Forecast, by Application 2020 & 2033
- Table 19: South Korea Fatty Acid Methyl Ester Industry Revenue (billion) Forecast, by Application 2020 & 2033
- Table 20: South Korea Fatty Acid Methyl Ester Industry Volume (K Tons) Forecast, by Application 2020 & 2033
- Table 21: Rest of Asia Pacific Fatty Acid Methyl Ester Industry Revenue (billion) Forecast, by Application 2020 & 2033
- Table 22: Rest of Asia Pacific Fatty Acid Methyl Ester Industry Volume (K Tons) Forecast, by Application 2020 & 2033
- Table 23: Global Fatty Acid Methyl Ester Industry Revenue billion Forecast, by Type 2020 & 2033
- Table 24: Global Fatty Acid Methyl Ester Industry Volume K Tons Forecast, by Type 2020 & 2033
- Table 25: Global Fatty Acid Methyl Ester Industry Revenue billion Forecast, by Application 2020 & 2033
- Table 26: Global Fatty Acid Methyl Ester Industry Volume K Tons Forecast, by Application 2020 & 2033
- Table 27: Global Fatty Acid Methyl Ester Industry Revenue billion Forecast, by Country 2020 & 2033
- Table 28: Global Fatty Acid Methyl Ester Industry Volume K Tons Forecast, by Country 2020 & 2033
- Table 29: United States Fatty Acid Methyl Ester Industry Revenue (billion) Forecast, by Application 2020 & 2033
- Table 30: United States Fatty Acid Methyl Ester Industry Volume (K Tons) Forecast, by Application 2020 & 2033
- Table 31: Canada Fatty Acid Methyl Ester Industry Revenue (billion) Forecast, by Application 2020 & 2033
- Table 32: Canada Fatty Acid Methyl Ester Industry Volume (K Tons) Forecast, by Application 2020 & 2033
- Table 33: Mexico Fatty Acid Methyl Ester Industry Revenue (billion) Forecast, by Application 2020 & 2033
- Table 34: Mexico Fatty Acid Methyl Ester Industry Volume (K Tons) Forecast, by Application 2020 & 2033
- Table 35: Global Fatty Acid Methyl Ester Industry Revenue billion Forecast, by Type 2020 & 2033
- Table 36: Global Fatty Acid Methyl Ester Industry Volume K Tons Forecast, by Type 2020 & 2033
- Table 37: Global Fatty Acid Methyl Ester Industry Revenue billion Forecast, by Application 2020 & 2033
- Table 38: Global Fatty Acid Methyl Ester Industry Volume K Tons Forecast, by Application 2020 & 2033
- Table 39: Global Fatty Acid Methyl Ester Industry Revenue billion Forecast, by Country 2020 & 2033
- Table 40: Global Fatty Acid Methyl Ester Industry Volume K Tons Forecast, by Country 2020 & 2033
- Table 41: Germany Fatty Acid Methyl Ester Industry Revenue (billion) Forecast, by Application 2020 & 2033
- Table 42: Germany Fatty Acid Methyl Ester Industry Volume (K Tons) Forecast, by Application 2020 & 2033
- Table 43: United Kingdom Fatty Acid Methyl Ester Industry Revenue (billion) Forecast, by Application 2020 & 2033
- Table 44: United Kingdom Fatty Acid Methyl Ester Industry Volume (K Tons) Forecast, by Application 2020 & 2033
- Table 45: France Fatty Acid Methyl Ester Industry Revenue (billion) Forecast, by Application 2020 & 2033
- Table 46: France Fatty Acid Methyl Ester Industry Volume (K Tons) Forecast, by Application 2020 & 2033
- Table 47: Italy Fatty Acid Methyl Ester Industry Revenue (billion) Forecast, by Application 2020 & 2033
- Table 48: Italy Fatty Acid Methyl Ester Industry Volume (K Tons) Forecast, by Application 2020 & 2033
- Table 49: Rest of Europe Fatty Acid Methyl Ester Industry Revenue (billion) Forecast, by Application 2020 & 2033
- Table 50: Rest of Europe Fatty Acid Methyl Ester Industry Volume (K Tons) Forecast, by Application 2020 & 2033
- Table 51: Global Fatty Acid Methyl Ester Industry Revenue billion Forecast, by Type 2020 & 2033
- Table 52: Global Fatty Acid Methyl Ester Industry Volume K Tons Forecast, by Type 2020 & 2033
- Table 53: Global Fatty Acid Methyl Ester Industry Revenue billion Forecast, by Application 2020 & 2033
- Table 54: Global Fatty Acid Methyl Ester Industry Volume K Tons Forecast, by Application 2020 & 2033
- Table 55: Global Fatty Acid Methyl Ester Industry Revenue billion Forecast, by Country 2020 & 2033
- Table 56: Global Fatty Acid Methyl Ester Industry Volume K Tons Forecast, by Country 2020 & 2033
- Table 57: Brazil Fatty Acid Methyl Ester Industry Revenue (billion) Forecast, by Application 2020 & 2033
- Table 58: Brazil Fatty Acid Methyl Ester Industry Volume (K Tons) Forecast, by Application 2020 & 2033
- Table 59: Argentina Fatty Acid Methyl Ester Industry Revenue (billion) Forecast, by Application 2020 & 2033
- Table 60: Argentina Fatty Acid Methyl Ester Industry Volume (K Tons) Forecast, by Application 2020 & 2033
- Table 61: Rest of South America Fatty Acid Methyl Ester Industry Revenue (billion) Forecast, by Application 2020 & 2033
- Table 62: Rest of South America Fatty Acid Methyl Ester Industry Volume (K Tons) Forecast, by Application 2020 & 2033
- Table 63: Global Fatty Acid Methyl Ester Industry Revenue billion Forecast, by Type 2020 & 2033
- Table 64: Global Fatty Acid Methyl Ester Industry Volume K Tons Forecast, by Type 2020 & 2033
- Table 65: Global Fatty Acid Methyl Ester Industry Revenue billion Forecast, by Application 2020 & 2033
- Table 66: Global Fatty Acid Methyl Ester Industry Volume K Tons Forecast, by Application 2020 & 2033
- Table 67: Global Fatty Acid Methyl Ester Industry Revenue billion Forecast, by Country 2020 & 2033
- Table 68: Global Fatty Acid Methyl Ester Industry Volume K Tons Forecast, by Country 2020 & 2033
- Table 69: Saudi Arabia Fatty Acid Methyl Ester Industry Revenue (billion) Forecast, by Application 2020 & 2033
- Table 70: Saudi Arabia Fatty Acid Methyl Ester Industry Volume (K Tons) Forecast, by Application 2020 & 2033
- Table 71: South Africa Fatty Acid Methyl Ester Industry Revenue (billion) Forecast, by Application 2020 & 2033
- Table 72: South Africa Fatty Acid Methyl Ester Industry Volume (K Tons) Forecast, by Application 2020 & 2033
- Table 73: Rest of Middle East and Africa Fatty Acid Methyl Ester Industry Revenue (billion) Forecast, by Application 2020 & 2033
- Table 74: Rest of Middle East and Africa Fatty Acid Methyl Ester Industry Volume (K Tons) Forecast, by Application 2020 & 2033
Frequently Asked Questions
1. What is the projected Compound Annual Growth Rate (CAGR) of the Fatty Acid Methyl Ester Industry?
The projected CAGR is approximately 5.6%.
2. Which companies are prominent players in the Fatty Acid Methyl Ester Industry?
Key companies in the market include Elevance Renewable Sciences Inc, Arkema, Cargill Incorporated, Merck KGaA, KLK OLEO, Wilmar International Ltd, TCI Chemicals (India) Pvt Ltd, BASF SE, Krishi Oils Limited, Larodan AB (ABITEC), Univar Solutions Inc, Cayman Chemical.
3. What are the main segments of the Fatty Acid Methyl Ester Industry?
The market segments include Type, Application.
4. Can you provide details about the market size?
The market size is estimated to be USD 23.2 billion as of 2022.
5. What are some drivers contributing to market growth?
Growing Production of Biodiesel; Other Drivers.
6. What are the notable trends driving market growth?
The Fuel Sector is Expected to Dominate the Market.
7. Are there any restraints impacting market growth?
High Manufacturing Cost Due to Volatile Raw Material Price; Other Restraints.
8. Can you provide examples of recent developments in the market?
Recent developments will be provided in the complete report.
9. What pricing options are available for accessing the report?
Pricing options include single-user, multi-user, and enterprise licenses priced at USD 4750, USD 5250, and USD 8750 respectively.
10. Is the market size provided in terms of value or volume?
The market size is provided in terms of value, measured in billion and volume, measured in K Tons.
11. Are there any specific market keywords associated with the report?
Yes, the market keyword associated with the report is "Fatty Acid Methyl Ester Industry," which aids in identifying and referencing the specific market segment covered.
12. How do I determine which pricing option suits my needs best?
The pricing options vary based on user requirements and access needs. Individual users may opt for single-user licenses, while businesses requiring broader access may choose multi-user or enterprise licenses for cost-effective access to the report.
13. Are there any additional resources or data provided in the Fatty Acid Methyl Ester Industry report?
While the report offers comprehensive insights, it's advisable to review the specific contents or supplementary materials provided to ascertain if additional resources or data are available.
14. How can I stay updated on further developments or reports in the Fatty Acid Methyl Ester Industry?
To stay informed about further developments, trends, and reports in the Fatty Acid Methyl Ester Industry, consider subscribing to industry newsletters, following relevant companies and organizations, or regularly checking reputable industry news sources and publications.
Methodology
Step 1 - Identification of Relevant Samples Size from Population Database


Step 2 - Approaches for Defining Global Market Size (Value, Volume* & Price*)

Note*: In applicable scenarios
Step 3 - Data Sources
Primary Research
- Web Analytics
- Survey Reports
- Research Institute
- Latest Research Reports
- Opinion Leaders
Secondary Research
- Annual Reports
- White Paper
- Latest Press Release
- Industry Association
- Paid Database
- Investor Presentations

Step 4 - Data Triangulation
Involves using different sources of information in order to increase the validity of a study
These sources are likely to be stakeholders in a program - participants, other researchers, program staff, other community members, and so on.
Then we put all data in single framework & apply various statistical tools to find out the dynamic on the market.
During the analysis stage, feedback from the stakeholder groups would be compared to determine areas of agreement as well as areas of divergence