Key Insights
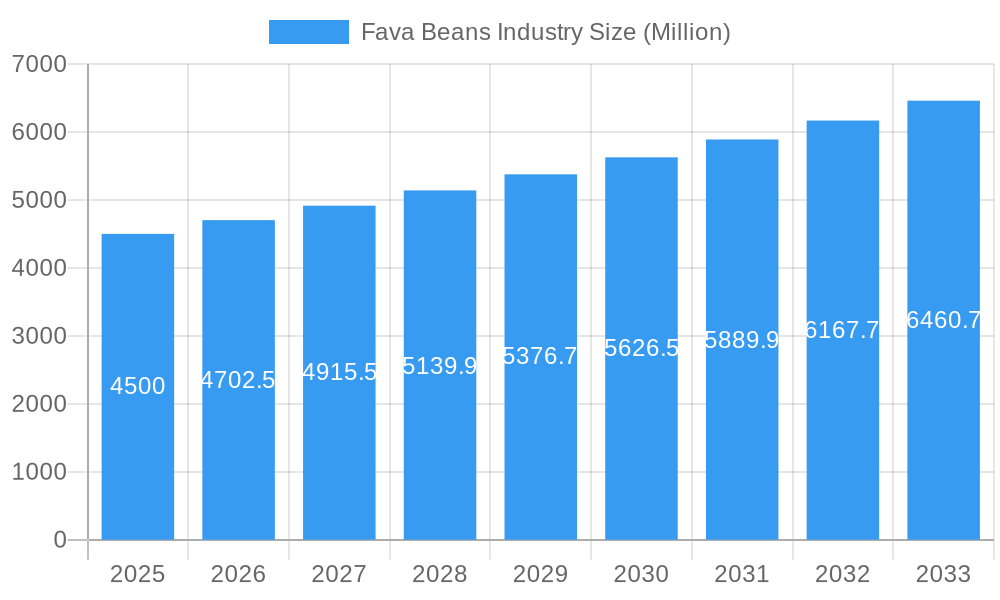
The global Fava Beans Industry is poised for robust growth, estimated to reach USD 4.5 billion in 2025. This expansion is fueled by a projected Compound Annual Growth Rate (CAGR) of 4.5% during the forecast period of 2025-2033. The increasing consumer awareness regarding the nutritional benefits of fava beans, coupled with their versatility in culinary applications, is a primary market driver. As a rich source of protein, fiber, and essential micronutrients, fava beans are gaining traction as a healthy food alternative, especially among health-conscious populations and those adopting plant-based diets. Furthermore, advancements in agricultural practices and the growing demand for sustainable food sources are also contributing to the positive market trajectory. The industry is witnessing a surge in product innovation, with fava bean-based ingredients being incorporated into a wider array of processed foods, snacks, and animal feed formulations. This diversification of applications is set to further stimulate market demand and drive revenue growth.
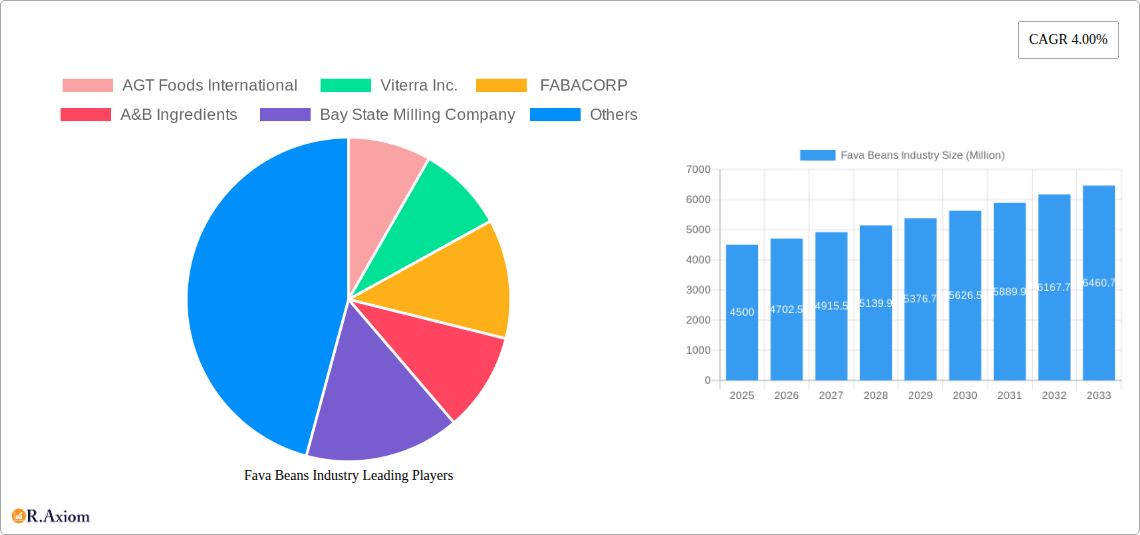
Fava Beans Industry Market Size (In Billion)
Several key trends are shaping the Fava Beans Industry. Production analysis indicates a steady increase in cultivation, driven by favorable government policies in some regions and the crop's resilience to various environmental conditions. Consumption analysis highlights a growing preference for fava beans in both developed and developing economies, attributed to their affordability and nutritional value. The import and export markets are also dynamic, with significant trade volumes observed across various regions, indicating a globally integrated supply chain. Price trend analysis suggests a stable to moderately increasing price point, reflecting the balance between supply and demand, along with production costs. While the market exhibits strong growth potential, certain restraints such as potential supply chain disruptions due to climatic variations and fluctuating raw material prices could pose challenges. However, the overall outlook remains optimistic, supported by the industry's inherent strengths and evolving market dynamics.
Fava Beans Industry Company Market Share
This comprehensive report delves into the dynamic global Fava Beans Industry, providing in-depth analysis and actionable insights for stakeholders. Spanning a study period from 2019–2033, with a base year of 2025 and a forecast period of 2025–2033, this report meticulously examines historical trends (2019–2024) and future projections. It covers crucial aspects including Production Analysis, Consumption Analysis, Import Market Analysis (Value & Volume), Export Market Analysis (Value & Volume), and Price Trend Analysis. Leveraging high-traffic keywords such as "fava bean market," "fava bean production," "fava bean consumption," "fava bean exports," "fava bean imports," "legume market analysis," "plant-based protein," "agricultural commodities," and "food ingredient trends," this report is designed to maximize search visibility and engage a broad spectrum of industry professionals, from growers and processors to investors and policymakers. The Fava Beans Industry is poised for significant growth driven by increasing demand for sustainable and nutritious food sources.
Fava Beans Industry Market Concentration & Innovation
The Fava Beans Industry is characterized by a moderate level of market concentration, with a few key players dominating specific segments, particularly in production and processing. Innovation within the industry is a significant driver, focusing on developing higher-yielding varieties, improved cultivation techniques, and novel applications for fava beans in food products. Regulatory frameworks, primarily centered around food safety standards and agricultural subsidies, play a crucial role in shaping market dynamics. While direct product substitutes are limited, alternative protein sources such as soy, pea, and other legumes present indirect competition. End-user trends are increasingly leaning towards plant-based diets, seeking sustainable and protein-rich ingredients, which directly benefits the fava bean market. Mergers and acquisitions (M&A) activities, though not as frequent as in more mature industries, are observed as companies seek to consolidate market share, expand their product portfolios, and gain access to new technologies or geographical markets. For instance, strategic partnerships, like the one involving Tesco PLC in January 2023, highlight a growing interest in incorporating fava beans into mainstream consumer products. The market share of leading fava bean processors is estimated to be in the tens of billions of dollars annually, with M&A deal values ranging from millions to billions, reflecting the strategic importance of this legume.
Fava Beans Industry Industry Trends & Insights
The global Fava Beans Industry is experiencing robust growth, projected to expand at a Compound Annual Growth Rate (CAGR) of approximately 6.5% over the forecast period. This expansion is fueled by several interconnected trends. The escalating global demand for plant-based proteins is a primary growth driver, as fava beans are an excellent source of protein, fiber, and essential nutrients, aligning perfectly with health-conscious consumer preferences and dietary shifts towards sustainable food sources. Technological advancements in agricultural practices, including precision farming and improved seed varieties, are enhancing yield and quality, making fava bean cultivation more efficient and profitable. For example, the development of new fava bean varieties like FBA Ayla (September 2021) and Doumei 1 (January 2021) demonstrates ongoing innovation in breeding for specific regional needs and functional properties. The increasing adoption of fava beans in various food applications, such as plant-based meat alternatives, dairy-free products, and snack ingredients, is further broadening its market penetration, which is projected to reach approximately 25% in the global legume market by 2033. Competitive dynamics are intensifying as established agribusinesses and emerging startups vie for market share, driven by the lucrative potential of this versatile legume. Market penetration is further boosted by government initiatives promoting pulse cultivation and the rising awareness of the environmental benefits associated with legumes in crop rotation. The industry is also witnessing an increase in investment from venture capital firms interested in innovative food technologies and sustainable agriculture. The overall market size is estimated to reach hundreds of billions of dollars by the end of the forecast period.
Dominant Markets & Segments in Fava Beans Industry
The Production Analysis of the Fava Beans Industry is dominated by regions with favorable climates and established agricultural infrastructure, notably the Mediterranean basin, the Middle East, and parts of North Africa and Australia. Key drivers for dominance in production include access to arable land, efficient irrigation systems, and government support for pulse cultivation. Countries like Egypt, China, and Australia are significant contributors to global fava bean output. The Consumption Analysis reveals a strong trend in Europe and North America, driven by rising consumer interest in plant-based diets and the incorporation of fava beans into various food products. The demand for fava beans as a healthy and sustainable ingredient is a primary driver of consumption growth.
In the Import Market Analysis (Value & Volume), major importing nations include those with significant food processing industries and a strong demand for alternative protein sources. The value of the global fava bean import market is projected to exceed hundreds of billions of dollars annually by 2033, with volumes reaching millions of metric tons. Key drivers include a growing population, increasing disposable incomes, and a preference for diverse food ingredients.
Conversely, the Export Market Analysis (Value & Volume) is led by countries with surplus production and competitive pricing. Australia, Canada, and certain European nations are prominent exporters, supplying raw fava beans and processed products to global markets. The value of fava bean exports is expected to reach tens of billions of dollars annually, supported by strong international demand.
The Price Trend Analysis for fava beans is influenced by factors such as harvest yields, global supply and demand dynamics, input costs (fertilizers, labor), and geopolitical events impacting agricultural trade. Prices are anticipated to experience a steady upward trend, reflecting the increasing demand and the inherent value of fava beans as a nutritious and sustainable crop. The market size for fava beans as a whole is projected to be in the hundreds of billions of dollars.
Fava Beans Industry Product Developments
Product developments in the Fava Beans Industry are primarily focused on enhancing nutritional profiles, improving taste and texture, and expanding applications. Innovations include the extraction of fava bean protein isolates for use in sports nutrition and infant formulas, the development of fava bean flours for gluten-free baking, and the incorporation of fava beans into plant-based meat analogs and dairy alternatives. These advancements provide competitive advantages by meeting consumer demand for healthier, more sustainable, and versatile food ingredients. The market is seeing a surge in novel fava bean-based snacks and ready-to-eat meals, leveraging the legume's inherent nutritional benefits and appealing to health-conscious consumers.
Report Scope & Segmentation Analysis
This report segments the Fava Beans Industry across key areas: Production Analysis, Consumption Analysis, Import Market Analysis (Value & Volume), Export Market Analysis (Value & Volume), and Price Trend Analysis. Production analysis forecasts steady growth in key agricultural regions, with projected volumes reaching millions of metric tons. Consumption analysis highlights the increasing demand in developed and emerging economies, driven by dietary shifts, with market sizes expected to reach tens of billions of dollars. Import and export analyses detail global trade flows, with projected values in the billions of dollars, influenced by supply-demand imbalances and trade policies. Price trend analysis anticipates a consistent upward trajectory, reflecting the growing commodity value of fava beans.
Key Drivers of Fava Beans Industry Growth
The growth of the Fava Beans Industry is propelled by several key drivers. Firstly, the escalating demand for plant-based proteins, fueled by increasing health consciousness and environmental concerns, positions fava beans as a vital ingredient. Secondly, technological advancements in agricultural science are leading to improved crop yields, disease resistance, and more efficient cultivation practices, enhancing profitability for farmers. Thirdly, favorable government policies and agricultural subsidies in many regions encourage the cultivation and adoption of pulses like fava beans. Finally, the versatility of fava beans in food applications, ranging from traditional cuisine to innovative plant-based products, broadens their market appeal and consumption.
Challenges in the Fava Beans Industry Sector
Despite its growth potential, the Fava Beans Industry faces several challenges. Supply chain disruptions, including logistics, storage, and transportation, can impact availability and pricing. Fluctuations in crop yields due to weather patterns and pest infestations pose a significant risk to market stability. Regulatory hurdles related to food safety standards and labeling requirements in different countries can create barriers to market entry and expansion. Furthermore, competition from other established protein sources and the need for consumer education on the benefits and usage of fava beans present ongoing challenges that require strategic market development and awareness campaigns. The estimated impact of these challenges on market growth is approximately 1-2% reduction in potential CAGR.
Emerging Opportunities in Fava Beans Industry
Emerging opportunities within the Fava Beans Industry are abundant. The increasing global trend towards sustainable and ethically sourced food products provides a significant avenue for fava bean market expansion. Innovations in food technology, such as advanced protein extraction and functional ingredient development, are opening new high-value application segments. Furthermore, the growing interest in novel food ingredients and unique culinary experiences presents opportunities for fava bean-based products in niche markets. Expansion into underdeveloped regions with a growing middle class and increasing demand for nutritious food also represents a substantial growth frontier, with market potential in the billions of dollars.
Leading Players in the Fava Beans Industry Market
AGT Foods International Viterra Inc. FABACORP A&B Ingredients Bay State Milling Company
Key Developments in Fava Beans Industry Industry
- January 2023: Tesco PLC, a British multinational grocery, partnered with the fava bean processor AB Mauri and its own-brand suppliers, including ready meal producer Samworth Brothers, to trial the fava bean across various product ranges and ingredients. This initiative is expected to significantly increase demand for fava beans in the United Kingdom.
- September 2021: The University of Sydney released a new fava bean variety called FBA Ayla, offering improved yields and adaptability for growers in Australia's northern New South Wales and southern Queensland region, bolstering regional production capabilities.
- January 2021: Chongqing Academy of Agricultural Sciences, Qinghai University, and Chongqing Agricultural Technology Extension Station successfully developed the Doumei 1 fava bean variety, which possesses both horticultural and enhanced food functional properties, catering to diverse agricultural and culinary needs.
Strategic Outlook for Fava Beans Industry Market
The strategic outlook for the Fava Beans Industry remains exceptionally positive, driven by the confluence of global dietary shifts, technological innovation, and increasing environmental consciousness. The sustained demand for plant-based protein sources, coupled with fava beans' excellent nutritional profile and sustainability credentials, positions it for continued market expansion. Future growth catalysts include further investment in research and development for novel applications, strategic partnerships across the value chain to enhance market reach, and the development of resilient supply chains. The industry is poised to capitalize on emerging markets and evolving consumer preferences, with a projected market value in the hundreds of billions of dollars.
Fava Beans Industry Segmentation
- 1. Production Analysis
- 2. Consumption Analysis
- 3. Import Market Analysis (Value & Volume)
- 4. Export Market Analysis (Value & Volume)
- 5. Price Trend Analysis
Fava Beans Industry Segmentation By Geography
-
1. North America
- 1.1. United States
- 1.2. Canada
- 1.3. Mexico
-
2. Europe
- 2.1. Germany
- 2.2. United Kingdom
- 2.3. France
- 2.4. Russia
- 2.5. Spain
- 2.6. Sweden
- 2.7. Italy
-
3. Asia Pacific
- 3.1. China
- 3.2. Japan
- 3.3. Australia
- 3.4. Iran
-
4. South America
- 4.1. Argentina
- 4.2. Peru
- 4.3. Brazil
-
5. Africa
- 5.1. Ethiopia
- 5.2. Egypt
- 5.3. Sudan
- 5.4. Morocco
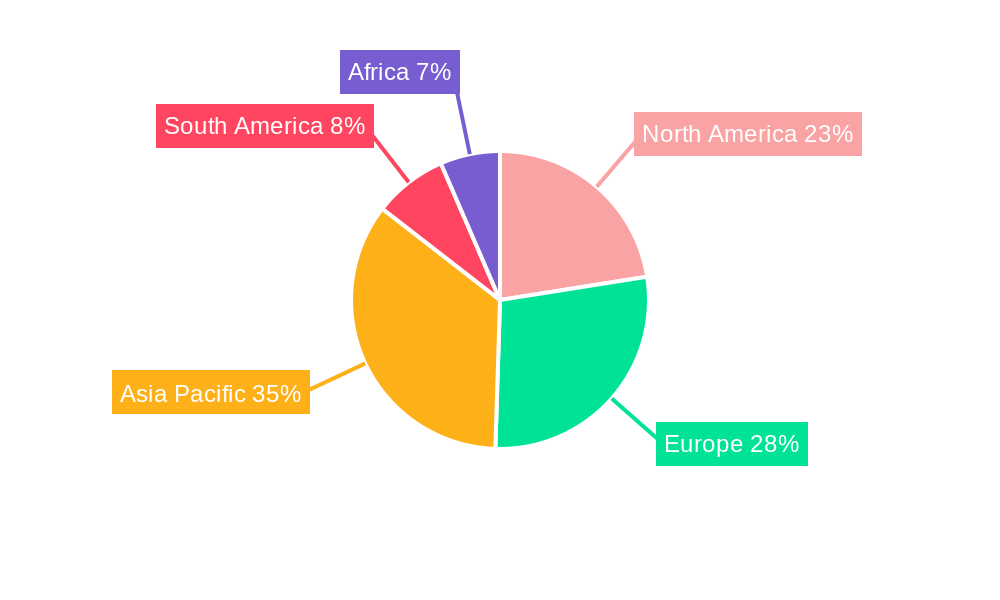
Fava Beans Industry Regional Market Share
Geographic Coverage of Fava Beans Industry
Fava Beans Industry REPORT HIGHLIGHTS
| Aspects | Details |
|---|---|
| Study Period | 2020-2034 |
| Base Year | 2025 |
| Estimated Year | 2026 |
| Forecast Period | 2026-2034 |
| Historical Period | 2020-2025 |
| Growth Rate | CAGR of 3.38% from 2020-2034 |
| Segmentation |
|
Table of Contents
- 1. Introduction
- 1.1. Research Scope
- 1.2. Market Segmentation
- 1.3. Research Objective
- 1.4. Definitions and Assumptions
- 2. Executive Summary
- 2.1. Market Snapshot
- 3. Market Dynamics
- 3.1. Market Drivers
- 3.2. Market Restrains
- 3.3. Market Trends
- 3.4. Market Opportunities
- 4. Market Factor Analysis
- 4.1. Porters Five Forces
- 4.1.1. Bargaining Power of Suppliers
- 4.1.2. Bargaining Power of Buyers
- 4.1.3. Threat of New Entrants
- 4.1.4. Threat of Substitutes
- 4.1.5. Competitive Rivalry
- 4.2. PESTEL analysis
- 4.3. BCG Analysis
- 4.3.1. Stars (High Growth, High Market Share)
- 4.3.2. Cash Cows (Low Growth, High Market Share)
- 4.3.3. Question Mark (High Growth, Low Market Share)
- 4.3.4. Dogs (Low Growth, Low Market Share)
- 4.4. Ansoff Matrix Analysis
- 4.5. Supply Chain Analysis
- 4.6. Regulatory Landscape
- 4.7. Current Market Potential and Opportunity Assessment (TAM–SAM–SOM Framework)
- 4.8. RAX Analyst Note
- 4.1. Porters Five Forces
- 5. Market Analysis, Insights and Forecast 2021-2033
- 5.1. Market Analysis, Insights and Forecast - by Production Analysis
- 5.2. Market Analysis, Insights and Forecast - by Consumption Analysis
- 5.3. Market Analysis, Insights and Forecast - by Import Market Analysis (Value & Volume)
- 5.4. Market Analysis, Insights and Forecast - by Export Market Analysis (Value & Volume)
- 5.5. Market Analysis, Insights and Forecast - by Price Trend Analysis
- 5.6. Market Analysis, Insights and Forecast - by Region
- 5.6.1. North America
- 5.6.2. Europe
- 5.6.3. Asia Pacific
- 5.6.4. South America
- 5.6.5. Africa
- 6. Global Fava Beans Industry Analysis, Insights and Forecast, 2021-2033
- 6.1. Market Analysis, Insights and Forecast - by Production Analysis
- 6.2. Market Analysis, Insights and Forecast - by Consumption Analysis
- 6.3. Market Analysis, Insights and Forecast - by Import Market Analysis (Value & Volume)
- 6.4. Market Analysis, Insights and Forecast - by Export Market Analysis (Value & Volume)
- 6.5. Market Analysis, Insights and Forecast - by Price Trend Analysis
- 7. North America Fava Beans Industry Analysis, Insights and Forecast, 2020-2032
- 7.1. Market Analysis, Insights and Forecast - by Production Analysis
- 7.2. Market Analysis, Insights and Forecast - by Consumption Analysis
- 7.3. Market Analysis, Insights and Forecast - by Import Market Analysis (Value & Volume)
- 7.4. Market Analysis, Insights and Forecast - by Export Market Analysis (Value & Volume)
- 7.5. Market Analysis, Insights and Forecast - by Price Trend Analysis
- 8. Europe Fava Beans Industry Analysis, Insights and Forecast, 2020-2032
- 8.1. Market Analysis, Insights and Forecast - by Production Analysis
- 8.2. Market Analysis, Insights and Forecast - by Consumption Analysis
- 8.3. Market Analysis, Insights and Forecast - by Import Market Analysis (Value & Volume)
- 8.4. Market Analysis, Insights and Forecast - by Export Market Analysis (Value & Volume)
- 8.5. Market Analysis, Insights and Forecast - by Price Trend Analysis
- 9. Asia Pacific Fava Beans Industry Analysis, Insights and Forecast, 2020-2032
- 9.1. Market Analysis, Insights and Forecast - by Production Analysis
- 9.2. Market Analysis, Insights and Forecast - by Consumption Analysis
- 9.3. Market Analysis, Insights and Forecast - by Import Market Analysis (Value & Volume)
- 9.4. Market Analysis, Insights and Forecast - by Export Market Analysis (Value & Volume)
- 9.5. Market Analysis, Insights and Forecast - by Price Trend Analysis
- 10. South America Fava Beans Industry Analysis, Insights and Forecast, 2020-2032
- 10.1. Market Analysis, Insights and Forecast - by Production Analysis
- 10.2. Market Analysis, Insights and Forecast - by Consumption Analysis
- 10.3. Market Analysis, Insights and Forecast - by Import Market Analysis (Value & Volume)
- 10.4. Market Analysis, Insights and Forecast - by Export Market Analysis (Value & Volume)
- 10.5. Market Analysis, Insights and Forecast - by Price Trend Analysis
- 11. Africa Fava Beans Industry Analysis, Insights and Forecast, 2020-2032
- 11.1. Market Analysis, Insights and Forecast - by Production Analysis
- 11.2. Market Analysis, Insights and Forecast - by Consumption Analysis
- 11.3. Market Analysis, Insights and Forecast - by Import Market Analysis (Value & Volume)
- 11.4. Market Analysis, Insights and Forecast - by Export Market Analysis (Value & Volume)
- 11.5. Market Analysis, Insights and Forecast - by Price Trend Analysis
- 12. Competitive Analysis
- 12.1. Company Profiles
- 12.1.1 AGT Foods International
- 12.1.1.1. Company Overview
- 12.1.1.2. Products
- 12.1.1.3. Company Financials
- 12.1.1.4. SWOT Analysis
- 12.1.2 Viterra Inc.
- 12.1.2.1. Company Overview
- 12.1.2.2. Products
- 12.1.2.3. Company Financials
- 12.1.2.4. SWOT Analysis
- 12.1.3 FABACORP
- 12.1.3.1. Company Overview
- 12.1.3.2. Products
- 12.1.3.3. Company Financials
- 12.1.3.4. SWOT Analysis
- 12.1.4 A&B Ingredients
- 12.1.4.1. Company Overview
- 12.1.4.2. Products
- 12.1.4.3. Company Financials
- 12.1.4.4. SWOT Analysis
- 12.1.5 Bay State Milling Company
- 12.1.5.1. Company Overview
- 12.1.5.2. Products
- 12.1.5.3. Company Financials
- 12.1.5.4. SWOT Analysis
- 12.1.1 AGT Foods International
- 12.2. Market Entropy
- 12.2.1 Company's Key Areas Served
- 12.2.2 Recent Developments
- 12.3. Company Market Share Analysis 2025
- 12.3.1 Top 5 Companies Market Share Analysis
- 12.3.2 Top 3 Companies Market Share Analysis
- 12.4. List of Potential Customers
- 13. Research Methodology
List of Figures
- Figure 1: Global Fava Beans Industry Revenue Breakdown (million, %) by Region 2025 & 2033
- Figure 2: North America Fava Beans Industry Revenue (million), by Production Analysis 2025 & 2033
- Figure 3: North America Fava Beans Industry Revenue Share (%), by Production Analysis 2025 & 2033
- Figure 4: North America Fava Beans Industry Revenue (million), by Consumption Analysis 2025 & 2033
- Figure 5: North America Fava Beans Industry Revenue Share (%), by Consumption Analysis 2025 & 2033
- Figure 6: North America Fava Beans Industry Revenue (million), by Import Market Analysis (Value & Volume) 2025 & 2033
- Figure 7: North America Fava Beans Industry Revenue Share (%), by Import Market Analysis (Value & Volume) 2025 & 2033
- Figure 8: North America Fava Beans Industry Revenue (million), by Export Market Analysis (Value & Volume) 2025 & 2033
- Figure 9: North America Fava Beans Industry Revenue Share (%), by Export Market Analysis (Value & Volume) 2025 & 2033
- Figure 10: North America Fava Beans Industry Revenue (million), by Price Trend Analysis 2025 & 2033
- Figure 11: North America Fava Beans Industry Revenue Share (%), by Price Trend Analysis 2025 & 2033
- Figure 12: North America Fava Beans Industry Revenue (million), by Country 2025 & 2033
- Figure 13: North America Fava Beans Industry Revenue Share (%), by Country 2025 & 2033
- Figure 14: Europe Fava Beans Industry Revenue (million), by Production Analysis 2025 & 2033
- Figure 15: Europe Fava Beans Industry Revenue Share (%), by Production Analysis 2025 & 2033
- Figure 16: Europe Fava Beans Industry Revenue (million), by Consumption Analysis 2025 & 2033
- Figure 17: Europe Fava Beans Industry Revenue Share (%), by Consumption Analysis 2025 & 2033
- Figure 18: Europe Fava Beans Industry Revenue (million), by Import Market Analysis (Value & Volume) 2025 & 2033
- Figure 19: Europe Fava Beans Industry Revenue Share (%), by Import Market Analysis (Value & Volume) 2025 & 2033
- Figure 20: Europe Fava Beans Industry Revenue (million), by Export Market Analysis (Value & Volume) 2025 & 2033
- Figure 21: Europe Fava Beans Industry Revenue Share (%), by Export Market Analysis (Value & Volume) 2025 & 2033
- Figure 22: Europe Fava Beans Industry Revenue (million), by Price Trend Analysis 2025 & 2033
- Figure 23: Europe Fava Beans Industry Revenue Share (%), by Price Trend Analysis 2025 & 2033
- Figure 24: Europe Fava Beans Industry Revenue (million), by Country 2025 & 2033
- Figure 25: Europe Fava Beans Industry Revenue Share (%), by Country 2025 & 2033
- Figure 26: Asia Pacific Fava Beans Industry Revenue (million), by Production Analysis 2025 & 2033
- Figure 27: Asia Pacific Fava Beans Industry Revenue Share (%), by Production Analysis 2025 & 2033
- Figure 28: Asia Pacific Fava Beans Industry Revenue (million), by Consumption Analysis 2025 & 2033
- Figure 29: Asia Pacific Fava Beans Industry Revenue Share (%), by Consumption Analysis 2025 & 2033
- Figure 30: Asia Pacific Fava Beans Industry Revenue (million), by Import Market Analysis (Value & Volume) 2025 & 2033
- Figure 31: Asia Pacific Fava Beans Industry Revenue Share (%), by Import Market Analysis (Value & Volume) 2025 & 2033
- Figure 32: Asia Pacific Fava Beans Industry Revenue (million), by Export Market Analysis (Value & Volume) 2025 & 2033
- Figure 33: Asia Pacific Fava Beans Industry Revenue Share (%), by Export Market Analysis (Value & Volume) 2025 & 2033
- Figure 34: Asia Pacific Fava Beans Industry Revenue (million), by Price Trend Analysis 2025 & 2033
- Figure 35: Asia Pacific Fava Beans Industry Revenue Share (%), by Price Trend Analysis 2025 & 2033
- Figure 36: Asia Pacific Fava Beans Industry Revenue (million), by Country 2025 & 2033
- Figure 37: Asia Pacific Fava Beans Industry Revenue Share (%), by Country 2025 & 2033
- Figure 38: South America Fava Beans Industry Revenue (million), by Production Analysis 2025 & 2033
- Figure 39: South America Fava Beans Industry Revenue Share (%), by Production Analysis 2025 & 2033
- Figure 40: South America Fava Beans Industry Revenue (million), by Consumption Analysis 2025 & 2033
- Figure 41: South America Fava Beans Industry Revenue Share (%), by Consumption Analysis 2025 & 2033
- Figure 42: South America Fava Beans Industry Revenue (million), by Import Market Analysis (Value & Volume) 2025 & 2033
- Figure 43: South America Fava Beans Industry Revenue Share (%), by Import Market Analysis (Value & Volume) 2025 & 2033
- Figure 44: South America Fava Beans Industry Revenue (million), by Export Market Analysis (Value & Volume) 2025 & 2033
- Figure 45: South America Fava Beans Industry Revenue Share (%), by Export Market Analysis (Value & Volume) 2025 & 2033
- Figure 46: South America Fava Beans Industry Revenue (million), by Price Trend Analysis 2025 & 2033
- Figure 47: South America Fava Beans Industry Revenue Share (%), by Price Trend Analysis 2025 & 2033
- Figure 48: South America Fava Beans Industry Revenue (million), by Country 2025 & 2033
- Figure 49: South America Fava Beans Industry Revenue Share (%), by Country 2025 & 2033
- Figure 50: Africa Fava Beans Industry Revenue (million), by Production Analysis 2025 & 2033
- Figure 51: Africa Fava Beans Industry Revenue Share (%), by Production Analysis 2025 & 2033
- Figure 52: Africa Fava Beans Industry Revenue (million), by Consumption Analysis 2025 & 2033
- Figure 53: Africa Fava Beans Industry Revenue Share (%), by Consumption Analysis 2025 & 2033
- Figure 54: Africa Fava Beans Industry Revenue (million), by Import Market Analysis (Value & Volume) 2025 & 2033
- Figure 55: Africa Fava Beans Industry Revenue Share (%), by Import Market Analysis (Value & Volume) 2025 & 2033
- Figure 56: Africa Fava Beans Industry Revenue (million), by Export Market Analysis (Value & Volume) 2025 & 2033
- Figure 57: Africa Fava Beans Industry Revenue Share (%), by Export Market Analysis (Value & Volume) 2025 & 2033
- Figure 58: Africa Fava Beans Industry Revenue (million), by Price Trend Analysis 2025 & 2033
- Figure 59: Africa Fava Beans Industry Revenue Share (%), by Price Trend Analysis 2025 & 2033
- Figure 60: Africa Fava Beans Industry Revenue (million), by Country 2025 & 2033
- Figure 61: Africa Fava Beans Industry Revenue Share (%), by Country 2025 & 2033
List of Tables
- Table 1: Global Fava Beans Industry Revenue million Forecast, by Production Analysis 2020 & 2033
- Table 2: Global Fava Beans Industry Revenue million Forecast, by Consumption Analysis 2020 & 2033
- Table 3: Global Fava Beans Industry Revenue million Forecast, by Import Market Analysis (Value & Volume) 2020 & 2033
- Table 4: Global Fava Beans Industry Revenue million Forecast, by Export Market Analysis (Value & Volume) 2020 & 2033
- Table 5: Global Fava Beans Industry Revenue million Forecast, by Price Trend Analysis 2020 & 2033
- Table 6: Global Fava Beans Industry Revenue million Forecast, by Region 2020 & 2033
- Table 7: Global Fava Beans Industry Revenue million Forecast, by Production Analysis 2020 & 2033
- Table 8: Global Fava Beans Industry Revenue million Forecast, by Consumption Analysis 2020 & 2033
- Table 9: Global Fava Beans Industry Revenue million Forecast, by Import Market Analysis (Value & Volume) 2020 & 2033
- Table 10: Global Fava Beans Industry Revenue million Forecast, by Export Market Analysis (Value & Volume) 2020 & 2033
- Table 11: Global Fava Beans Industry Revenue million Forecast, by Price Trend Analysis 2020 & 2033
- Table 12: Global Fava Beans Industry Revenue million Forecast, by Country 2020 & 2033
- Table 13: United States Fava Beans Industry Revenue (million) Forecast, by Application 2020 & 2033
- Table 14: Canada Fava Beans Industry Revenue (million) Forecast, by Application 2020 & 2033
- Table 15: Mexico Fava Beans Industry Revenue (million) Forecast, by Application 2020 & 2033
- Table 16: Global Fava Beans Industry Revenue million Forecast, by Production Analysis 2020 & 2033
- Table 17: Global Fava Beans Industry Revenue million Forecast, by Consumption Analysis 2020 & 2033
- Table 18: Global Fava Beans Industry Revenue million Forecast, by Import Market Analysis (Value & Volume) 2020 & 2033
- Table 19: Global Fava Beans Industry Revenue million Forecast, by Export Market Analysis (Value & Volume) 2020 & 2033
- Table 20: Global Fava Beans Industry Revenue million Forecast, by Price Trend Analysis 2020 & 2033
- Table 21: Global Fava Beans Industry Revenue million Forecast, by Country 2020 & 2033
- Table 22: Germany Fava Beans Industry Revenue (million) Forecast, by Application 2020 & 2033
- Table 23: United Kingdom Fava Beans Industry Revenue (million) Forecast, by Application 2020 & 2033
- Table 24: France Fava Beans Industry Revenue (million) Forecast, by Application 2020 & 2033
- Table 25: Russia Fava Beans Industry Revenue (million) Forecast, by Application 2020 & 2033
- Table 26: Spain Fava Beans Industry Revenue (million) Forecast, by Application 2020 & 2033
- Table 27: Sweden Fava Beans Industry Revenue (million) Forecast, by Application 2020 & 2033
- Table 28: Italy Fava Beans Industry Revenue (million) Forecast, by Application 2020 & 2033
- Table 29: Global Fava Beans Industry Revenue million Forecast, by Production Analysis 2020 & 2033
- Table 30: Global Fava Beans Industry Revenue million Forecast, by Consumption Analysis 2020 & 2033
- Table 31: Global Fava Beans Industry Revenue million Forecast, by Import Market Analysis (Value & Volume) 2020 & 2033
- Table 32: Global Fava Beans Industry Revenue million Forecast, by Export Market Analysis (Value & Volume) 2020 & 2033
- Table 33: Global Fava Beans Industry Revenue million Forecast, by Price Trend Analysis 2020 & 2033
- Table 34: Global Fava Beans Industry Revenue million Forecast, by Country 2020 & 2033
- Table 35: China Fava Beans Industry Revenue (million) Forecast, by Application 2020 & 2033
- Table 36: Japan Fava Beans Industry Revenue (million) Forecast, by Application 2020 & 2033
- Table 37: Australia Fava Beans Industry Revenue (million) Forecast, by Application 2020 & 2033
- Table 38: Iran Fava Beans Industry Revenue (million) Forecast, by Application 2020 & 2033
- Table 39: Global Fava Beans Industry Revenue million Forecast, by Production Analysis 2020 & 2033
- Table 40: Global Fava Beans Industry Revenue million Forecast, by Consumption Analysis 2020 & 2033
- Table 41: Global Fava Beans Industry Revenue million Forecast, by Import Market Analysis (Value & Volume) 2020 & 2033
- Table 42: Global Fava Beans Industry Revenue million Forecast, by Export Market Analysis (Value & Volume) 2020 & 2033
- Table 43: Global Fava Beans Industry Revenue million Forecast, by Price Trend Analysis 2020 & 2033
- Table 44: Global Fava Beans Industry Revenue million Forecast, by Country 2020 & 2033
- Table 45: Argentina Fava Beans Industry Revenue (million) Forecast, by Application 2020 & 2033
- Table 46: Peru Fava Beans Industry Revenue (million) Forecast, by Application 2020 & 2033
- Table 47: Brazil Fava Beans Industry Revenue (million) Forecast, by Application 2020 & 2033
- Table 48: Global Fava Beans Industry Revenue million Forecast, by Production Analysis 2020 & 2033
- Table 49: Global Fava Beans Industry Revenue million Forecast, by Consumption Analysis 2020 & 2033
- Table 50: Global Fava Beans Industry Revenue million Forecast, by Import Market Analysis (Value & Volume) 2020 & 2033
- Table 51: Global Fava Beans Industry Revenue million Forecast, by Export Market Analysis (Value & Volume) 2020 & 2033
- Table 52: Global Fava Beans Industry Revenue million Forecast, by Price Trend Analysis 2020 & 2033
- Table 53: Global Fava Beans Industry Revenue million Forecast, by Country 2020 & 2033
- Table 54: Ethiopia Fava Beans Industry Revenue (million) Forecast, by Application 2020 & 2033
- Table 55: Egypt Fava Beans Industry Revenue (million) Forecast, by Application 2020 & 2033
- Table 56: Sudan Fava Beans Industry Revenue (million) Forecast, by Application 2020 & 2033
- Table 57: Morocco Fava Beans Industry Revenue (million) Forecast, by Application 2020 & 2033
Frequently Asked Questions
1. What is the projected Compound Annual Growth Rate (CAGR) of the Fava Beans Industry?
The projected CAGR is approximately 3.38%.
2. Which companies are prominent players in the Fava Beans Industry?
Key companies in the market include AGT Foods International , Viterra Inc. , FABACORP , A&B Ingredients , Bay State Milling Company.
3. What are the main segments of the Fava Beans Industry?
The market segments include Production Analysis, Consumption Analysis, Import Market Analysis (Value & Volume), Export Market Analysis (Value & Volume), Price Trend Analysis.
4. Can you provide details about the market size?
The market size is estimated to be USD 9.6 million as of 2022.
5. What are some drivers contributing to market growth?
Increasing Demand for Garlic Due to Various Uses in Industries; Rising Demad of Organic Garlic; Increasing Government Initiatives.
6. What are the notable trends driving market growth?
Growing Demand for Nutritional Food.
7. Are there any restraints impacting market growth?
Lack of Technical Knowledge of Farmers; Price Fluctuations.
8. Can you provide examples of recent developments in the market?
January 2023: Tesco PLC, a British multinational grocery, partnered with the fava bean processor AB Mauri and its own-brand suppliers, including ready meal producer Samworth Brothers, to trial the fava bean across various product ranges and ingredients. This will cause an increase in demand in the United Kingdom.
9. What pricing options are available for accessing the report?
Pricing options include single-user, multi-user, and enterprise licenses priced at USD 4750, USD 5250, and USD 8750 respectively.
10. Is the market size provided in terms of value or volume?
The market size is provided in terms of value, measured in million.
11. Are there any specific market keywords associated with the report?
Yes, the market keyword associated with the report is "Fava Beans Industry," which aids in identifying and referencing the specific market segment covered.
12. How do I determine which pricing option suits my needs best?
The pricing options vary based on user requirements and access needs. Individual users may opt for single-user licenses, while businesses requiring broader access may choose multi-user or enterprise licenses for cost-effective access to the report.
13. Are there any additional resources or data provided in the Fava Beans Industry report?
While the report offers comprehensive insights, it's advisable to review the specific contents or supplementary materials provided to ascertain if additional resources or data are available.
14. How can I stay updated on further developments or reports in the Fava Beans Industry?
To stay informed about further developments, trends, and reports in the Fava Beans Industry, consider subscribing to industry newsletters, following relevant companies and organizations, or regularly checking reputable industry news sources and publications.
Methodology
Step 1 - Identification of Relevant Samples Size from Population Database


Step 2 - Approaches for Defining Global Market Size (Value, Volume* & Price*)

Note*: In applicable scenarios
Step 3 - Data Sources
Primary Research
- Web Analytics
- Survey Reports
- Research Institute
- Latest Research Reports
- Opinion Leaders
Secondary Research
- Annual Reports
- White Paper
- Latest Press Release
- Industry Association
- Paid Database
- Investor Presentations

Step 4 - Data Triangulation
Involves using different sources of information in order to increase the validity of a study
These sources are likely to be stakeholders in a program - participants, other researchers, program staff, other community members, and so on.
Then we put all data in single framework & apply various statistical tools to find out the dynamic on the market.
During the analysis stage, feedback from the stakeholder groups would be compared to determine areas of agreement as well as areas of divergence

