

Key Insights
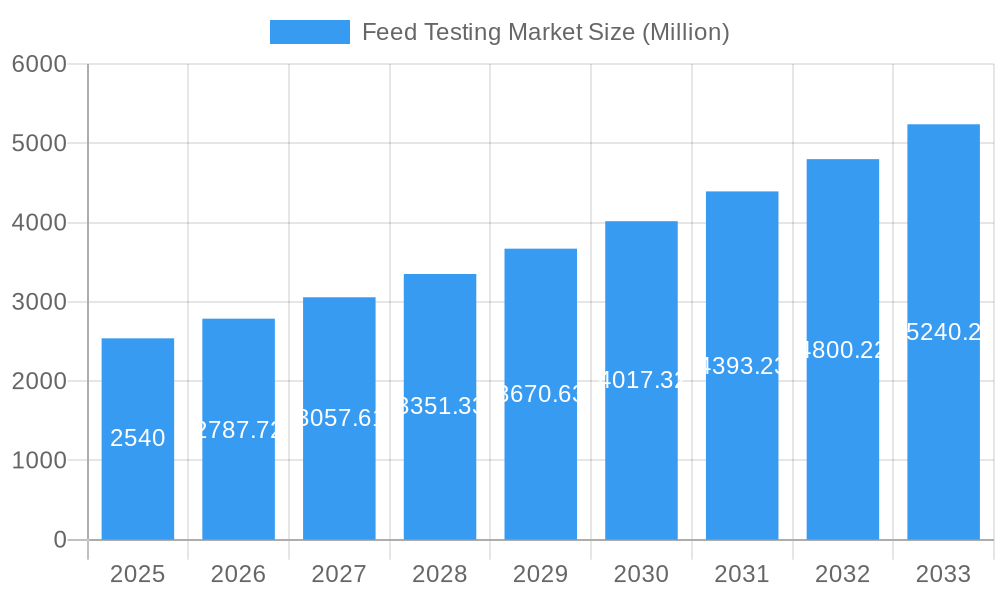
The global feed testing market, valued at $2.54 billion in 2025, is projected to experience robust growth, driven by increasing consumer demand for safe and high-quality animal products. This demand necessitates stringent quality control measures throughout the feed production and supply chain, fueling the adoption of advanced testing methodologies. Key drivers include rising concerns about food safety and traceability, stringent government regulations on feed contamination (e.g., mycotoxins, pesticides), and the growing awareness of the impact of feed quality on animal health and productivity. The market's segmentation reflects diverse testing needs across various feed types, including ruminant, poultry, swine, aquaculture, and pet food. Pathogen testing, pesticide residue analysis, and nutritional labeling analysis are major segments within the market, each contributing significantly to the overall growth. Technological advancements, such as rapid diagnostic tests and high-throughput screening methods, are further accelerating market expansion. The geographically diverse market shows strong growth across regions, with North America and Europe currently holding significant shares, while the Asia-Pacific region is poised for substantial expansion given its growing livestock and aquaculture sectors. This growth is also fueled by increasing disposable income and rising middle-class populations in developing economies, driving demand for animal protein.
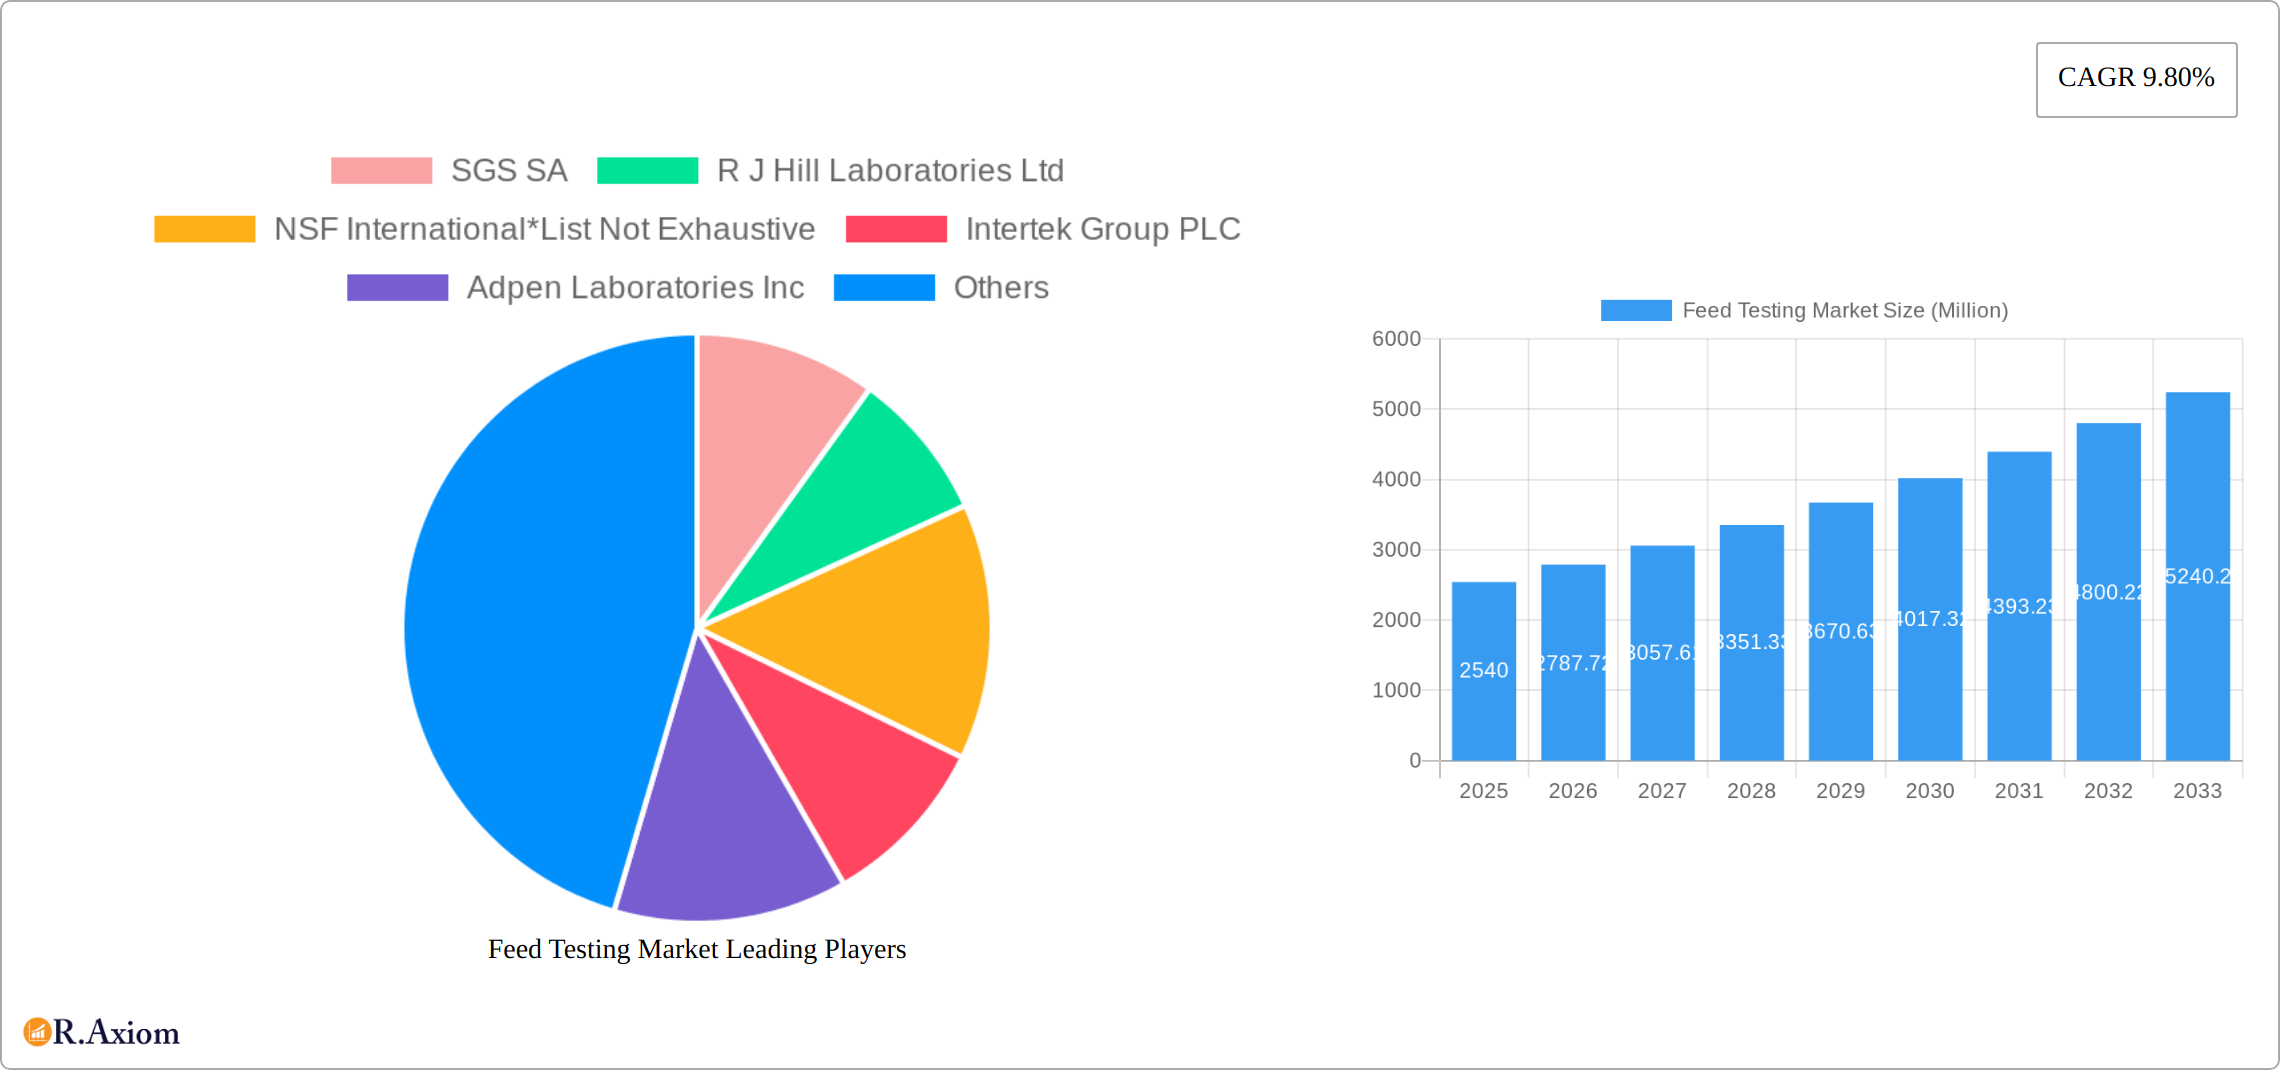
Feed Testing Market Market Size (In Billion)
The projected CAGR of 9.80% from 2025 to 2033 indicates substantial growth potential. However, the market faces certain challenges, including high testing costs, the need for skilled personnel to operate sophisticated equipment, and the potential for variability in testing results across different laboratories. To mitigate these challenges, the industry is focusing on standardization, automation, and the development of more cost-effective and user-friendly testing solutions. Leading companies are investing heavily in R&D and strategic acquisitions to strengthen their market position and expand their service offerings. The competitive landscape is characterized by a mix of large multinational corporations and smaller specialized laboratories, creating a dynamic and evolving market structure. The increasing adoption of advanced analytical techniques, such as PCR, ELISA, and chromatography, is driving efficiency and accuracy in feed testing, contributing to the overall market expansion.
Feed Testing Market Company Market Share
Feed Testing Market: A Comprehensive Report (2019-2033)
This in-depth report provides a comprehensive analysis of the global Feed Testing Market, offering invaluable insights for stakeholders across the value chain. The study period spans from 2019 to 2033, with 2025 serving as the base and estimated year. The report meticulously analyzes market dynamics, segment performance, competitive landscape, and future growth prospects, providing actionable intelligence for informed decision-making. The market is valued at xx Million in 2025 and is projected to reach xx Million by 2033, exhibiting a CAGR of xx% during the forecast period (2025-2033).
Feed Testing Market Concentration & Innovation
This section delves into the competitive intensity of the feed testing market, examining market concentration through metrics like the Herfindahl-Hirschman Index (HHI) and market share held by key players. The analysis considers the role of innovation in driving market growth, focusing on the development and adoption of advanced testing technologies like PCR, ELISA, and LC-MS/MS. Regulatory frameworks, such as those governing food safety and labeling, significantly impact market dynamics. The report further explores the presence and influence of substitute products, evolving end-user preferences (e.g., increasing demand for organic and sustainable feed), and the impact of mergers and acquisitions (M&A) activities. Several significant M&A deals in the recent past, with a total value of approximately xx Million, have reshaped the competitive landscape. Key players include:
- High Market Share Players: The market is characterized by a moderately consolidated structure, with the top 5 players holding an estimated xx% market share collectively in 2025.
- Innovation Drivers: Advancements in analytical techniques and automation are major growth drivers, along with increasing regulatory stringency and consumer demand for safe and high-quality feed.
- Regulatory Frameworks: Stringent food safety regulations worldwide drive the demand for feed testing services, acting as a key market growth driver.
- Product Substitutes: Limited direct substitutes exist; however, the market faces indirect competition from in-house testing capabilities of larger feed producers.
- M&A Activity: Consolidation within the industry is anticipated, driven by the need to expand testing capabilities and geographical reach.
Feed Testing Market Industry Trends & Insights
The Feed Testing market is experiencing robust growth, propelled by multiple factors. Stringent government regulations for food safety and quality are a primary driver, compelling feed producers to invest heavily in testing. The rising global population and increasing demand for animal protein are also contributing to market expansion. Technological advancements, such as the development of rapid and high-throughput testing methods, are significantly enhancing efficiency and reducing testing costs. The market is witnessing a shift towards advanced analytical techniques, enabling more comprehensive and accurate testing of various contaminants and nutritional components. Consumer preference for sustainably sourced and ethically produced animal products is driving demand for robust feed testing, ensuring compliance with labeling requirements. The competitive landscape is characterized by both established players and emerging companies, leading to ongoing innovation and competition. This competitive environment is driving down prices and improving the quality of services offered. The market penetration of advanced testing technologies like PCR and LC-MS/MS is increasing steadily, further contributing to market growth. The market's growth is expected to continue at a CAGR of xx% during the forecast period, driven by the factors mentioned above.
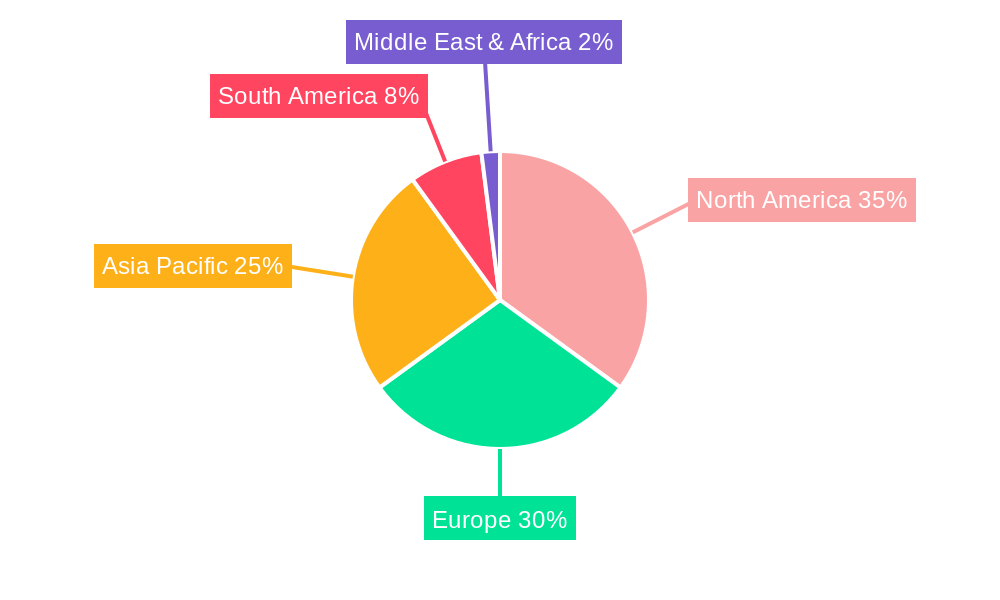
Dominant Markets & Segments in Feed Testing Market
The North American region dominates the global feed testing market, driven by stringent regulations, a robust animal feed industry, and high consumer awareness of food safety. Within the market, the pathogen testing segment is the largest, owing to the critical role of preventing disease outbreaks.
Dominant Segments by Type:
- Pathogen Testing: This segment holds the largest market share due to stringent regulations and the critical role of pathogen detection in ensuring food safety. Key drivers include increasing outbreaks of zoonotic diseases and regulatory compliance needs.
- Pesticide Residue Analysis: This segment is witnessing strong growth driven by increasing consumer concerns regarding pesticide residues in animal feed.
- Nutritional Labeling Analysis: This segment is driven by the demand for accurate and reliable nutritional information on feed labels, ensuring compliance with regulations.
- Fats and Oils Analysis: The demand for precise analysis of fats and oils in feed is growing due to the importance of these components in animal nutrition.
- Mycotoxin Testing: This segment is experiencing significant growth due to increasing awareness of the health risks associated with mycotoxins in animal feed.
Dominant Segments by Feed Type:
- Poultry Feed: This segment represents a significant portion of the market due to the large-scale production of poultry and strict regulations governing poultry feed safety. Key drivers include the high volume of poultry feed production and stringent quality control standards.
- Ruminant Feed: This segment is also substantial due to the large-scale production of ruminant livestock and the importance of feed quality in livestock health and productivity.
- Swine Feed: This segment exhibits healthy growth driven by increasing global pork consumption and the need for efficient swine feed production.
Key Drivers for Dominant Regions/Segments (Bullet Points):
- Stringent Regulations: Stricter food safety regulations drive demand for feed testing across all segments and regions.
- Rising Demand for Animal Protein: Growing global population fuels the demand for animal products, leading to increased feed production and testing.
- Technological Advancements: Development of rapid and accurate testing methods is accelerating market growth.
- Economic Growth: Economic development in emerging markets is increasing investment in animal agriculture and, consequently, feed testing.
Feed Testing Market Product Developments
Recent product innovations include rapid diagnostic tests, automated testing systems, and advanced analytical techniques like LC-MS/MS and PCR. These advancements offer improved accuracy, speed, and cost-effectiveness, catering to the evolving needs of the market. The focus is on developing portable and user-friendly testing devices for on-site analysis, along with comprehensive software solutions for data management and reporting. This improved technology enhances the efficiency and speed of testing procedures, contributing to the growth of the market.
Report Scope & Segmentation Analysis
This comprehensive report provides a detailed segmentation analysis of the feed testing market, categorized by both testing type and feed type. Testing types include pathogen testing, pesticide residue analysis, nutritional labeling analysis, fats and oils analysis, mycotoxin testing, and other types. Feed types encompassed in the analysis are ruminant feed, poultry feed, swine feed, aquaculture feed, and pet food. Each segment undergoes a thorough examination, considering market size, growth trajectory, key driving forces, and the competitive landscape. The report projects substantial growth across all segments throughout the forecast period (2025-2033), with pathogen testing and poultry feed anticipated to maintain leading market shares. Detailed growth projections, including historical market size estimations (2019-2024) and future forecasts, are provided for each segment. A competitive analysis for each segment is also included, evaluating the presence and influence of both established industry players and emerging competitors.
Key Drivers of Feed Testing Market Growth
The global feed testing market's robust expansion is fueled by a confluence of technological advancements, economic factors, and stringent regulatory frameworks. Significant technological progress, particularly in automated systems and rapid diagnostic tests, is enhancing both the efficiency and accuracy of testing procedures. The rising consumer awareness regarding food safety and the escalating demand for premium-quality animal products are key drivers of market expansion. Furthermore, stringent government regulations enforcing food safety and quality standards necessitate regular feed testing, providing a significant impetus for market growth. The economic growth observed in emerging markets, stimulating agricultural production and investment in animal feed, contributes substantially to the market's overall expansion.
Challenges in the Feed Testing Market Sector
Despite its growth potential, the feed testing market faces several challenges. High testing costs represent a significant hurdle, coupled with the complexity of varying regional regulatory landscapes. The need for skilled personnel to operate sophisticated testing equipment adds another layer of complexity. Supply chain disruptions and the availability of skilled labor, particularly in developing economies, pose additional limitations. The competitive landscape, characterized by a mix of large, established companies and smaller, specialized firms, can lead to price pressure and reduced profit margins for some market participants. These factors collectively influence the overall growth potential of the market.
Emerging Opportunities in Feed Testing Market
Numerous emerging opportunities exist within the feed testing market. The development and adoption of point-of-care testing devices offer enhanced convenience and speed. The integration of blockchain technology presents opportunities for improved traceability and transparency throughout the supply chain. The expanding demand for testing services in developing economies creates significant growth potential. Expanding into new market segments, such as aquaculture, and offering integrated testing and consulting services represent further avenues for growth. The increasing emphasis on sustainable and environmentally conscious feed production opens doors for innovative testing solutions that address these crucial considerations.
Leading Players in the Feed Testing Market Market
- SGS SA
- R J Hill Laboratories Ltd
- NSF International
- Intertek Group PLC
- Adpen Laboratories Inc
- Bruker Biosciences Corporation
- Genetic ID NA Inc
- Genon Laboratories Ltd
- Eurofins Scientific
- Invisible Sentinel Inc
Key Developments in Feed Testing Market Industry
- 2023 (Q3): Eurofins Scientific strategically expanded its geographical reach and service portfolio through the acquisition of a specialized feed testing laboratory.
- 2022 (Q4): SGS SA introduced a novel rapid testing method for mycotoxins, dramatically improving both turnaround time and overall efficiency.
- 2021 (Q1): A significant merger between two mid-sized feed testing companies resulted in a consolidation of market share and an expansion of service offerings. (Further details on this and other mergers and acquisitions are available in the complete report).
Strategic Outlook for Feed Testing Market Market
The feed testing market is poised for sustained growth, driven by the factors mentioned throughout this report. The increasing demand for food safety, technological advancements in testing methodologies, and ongoing regulatory scrutiny will collectively contribute to the market's expansion. Opportunities exist for companies that can offer innovative, cost-effective, and reliable testing services, particularly in emerging markets. The industry is expected to continue its consolidation trend, leading to a more streamlined yet competitive market landscape.
Feed Testing Market Segmentation
- 1. Production Analysis
- 2. Consumption Analysis
- 3. Import Market Analysis (Value & Volume)
- 4. Export Market Analysis (Value & Volume)
- 5. Price Trend Analysis
Feed Testing Market Segmentation By Geography
-
1. North America
- 1.1. United States
- 1.2. Canada
- 1.3. Mexico
-
2. South America
- 2.1. Brazil
- 2.2. Argentina
- 2.3. Rest of South America
-
3. Europe
- 3.1. United Kingdom
- 3.2. Germany
- 3.3. France
- 3.4. Italy
- 3.5. Spain
- 3.6. Russia
- 3.7. Benelux
- 3.8. Nordics
- 3.9. Rest of Europe
-
4. Middle East & Africa
- 4.1. Turkey
- 4.2. Israel
- 4.3. GCC
- 4.4. North Africa
- 4.5. South Africa
- 4.6. Rest of Middle East & Africa
-
5. Asia Pacific
- 5.1. China
- 5.2. India
- 5.3. Japan
- 5.4. South Korea
- 5.5. ASEAN
- 5.6. Oceania
- 5.7. Rest of Asia Pacific
Feed Testing Market Regional Market Share
Geographic Coverage of Feed Testing Market
Feed Testing Market REPORT HIGHLIGHTS
| Aspects | Details |
|---|---|
| Study Period | 2020-2034 |
| Base Year | 2025 |
| Estimated Year | 2026 |
| Forecast Period | 2026-2034 |
| Historical Period | 2020-2025 |
| Growth Rate | CAGR of 9.80% from 2020-2034 |
| Segmentation |
|
Table of Contents
- 1. Introduction
- 1.1. Research Scope
- 1.2. Market Segmentation
- 1.3. Research Objective
- 1.4. Definitions and Assumptions
- 2. Executive Summary
- 2.1. Market Snapshot
- 3. Market Dynamics
- 3.1. Market Drivers
- 3.2. Market Restrains
- 3.3. Market Trends
- 3.4. Market Opportunities
- 4. Market Factor Analysis
- 4.1. Porters Five Forces
- 4.1.1. Bargaining Power of Suppliers
- 4.1.2. Bargaining Power of Buyers
- 4.1.3. Threat of New Entrants
- 4.1.4. Threat of Substitutes
- 4.1.5. Competitive Rivalry
- 4.2. PESTEL analysis
- 4.3. BCG Analysis
- 4.3.1. Stars (High Growth, High Market Share)
- 4.3.2. Cash Cows (Low Growth, High Market Share)
- 4.3.3. Question Mark (High Growth, Low Market Share)
- 4.3.4. Dogs (Low Growth, Low Market Share)
- 4.4. Ansoff Matrix Analysis
- 4.5. Supply Chain Analysis
- 4.6. Regulatory Landscape
- 4.7. Current Market Potential and Opportunity Assessment (TAM–SAM–SOM Framework)
- 4.8. RAX Analyst Note
- 4.1. Porters Five Forces
- 5. Market Analysis, Insights and Forecast 2021-2033
- 5.1. Market Analysis, Insights and Forecast - by Production Analysis
- 5.2. Market Analysis, Insights and Forecast - by Consumption Analysis
- 5.3. Market Analysis, Insights and Forecast - by Import Market Analysis (Value & Volume)
- 5.4. Market Analysis, Insights and Forecast - by Export Market Analysis (Value & Volume)
- 5.5. Market Analysis, Insights and Forecast - by Price Trend Analysis
- 5.6. Market Analysis, Insights and Forecast - by Region
- 5.6.1. North America
- 5.6.2. South America
- 5.6.3. Europe
- 5.6.4. Middle East & Africa
- 5.6.5. Asia Pacific
- 6. Global Feed Testing Market Analysis, Insights and Forecast, 2021-2033
- 6.1. Market Analysis, Insights and Forecast - by Production Analysis
- 6.2. Market Analysis, Insights and Forecast - by Consumption Analysis
- 6.3. Market Analysis, Insights and Forecast - by Import Market Analysis (Value & Volume)
- 6.4. Market Analysis, Insights and Forecast - by Export Market Analysis (Value & Volume)
- 6.5. Market Analysis, Insights and Forecast - by Price Trend Analysis
- 7. North America Feed Testing Market Analysis, Insights and Forecast, 2020-2032
- 7.1. Market Analysis, Insights and Forecast - by Production Analysis
- 7.2. Market Analysis, Insights and Forecast - by Consumption Analysis
- 7.3. Market Analysis, Insights and Forecast - by Import Market Analysis (Value & Volume)
- 7.4. Market Analysis, Insights and Forecast - by Export Market Analysis (Value & Volume)
- 7.5. Market Analysis, Insights and Forecast - by Price Trend Analysis
- 8. South America Feed Testing Market Analysis, Insights and Forecast, 2020-2032
- 8.1. Market Analysis, Insights and Forecast - by Production Analysis
- 8.2. Market Analysis, Insights and Forecast - by Consumption Analysis
- 8.3. Market Analysis, Insights and Forecast - by Import Market Analysis (Value & Volume)
- 8.4. Market Analysis, Insights and Forecast - by Export Market Analysis (Value & Volume)
- 8.5. Market Analysis, Insights and Forecast - by Price Trend Analysis
- 9. Europe Feed Testing Market Analysis, Insights and Forecast, 2020-2032
- 9.1. Market Analysis, Insights and Forecast - by Production Analysis
- 9.2. Market Analysis, Insights and Forecast - by Consumption Analysis
- 9.3. Market Analysis, Insights and Forecast - by Import Market Analysis (Value & Volume)
- 9.4. Market Analysis, Insights and Forecast - by Export Market Analysis (Value & Volume)
- 9.5. Market Analysis, Insights and Forecast - by Price Trend Analysis
- 10. Middle East & Africa Feed Testing Market Analysis, Insights and Forecast, 2020-2032
- 10.1. Market Analysis, Insights and Forecast - by Production Analysis
- 10.2. Market Analysis, Insights and Forecast - by Consumption Analysis
- 10.3. Market Analysis, Insights and Forecast - by Import Market Analysis (Value & Volume)
- 10.4. Market Analysis, Insights and Forecast - by Export Market Analysis (Value & Volume)
- 10.5. Market Analysis, Insights and Forecast - by Price Trend Analysis
- 11. Asia Pacific Feed Testing Market Analysis, Insights and Forecast, 2020-2032
- 11.1. Market Analysis, Insights and Forecast - by Production Analysis
- 11.2. Market Analysis, Insights and Forecast - by Consumption Analysis
- 11.3. Market Analysis, Insights and Forecast - by Import Market Analysis (Value & Volume)
- 11.4. Market Analysis, Insights and Forecast - by Export Market Analysis (Value & Volume)
- 11.5. Market Analysis, Insights and Forecast - by Price Trend Analysis
- 12. Competitive Analysis
- 12.1. Company Profiles
- 12.1.1 SGS SA
- 12.1.1.1. Company Overview
- 12.1.1.2. Products
- 12.1.1.3. Company Financials
- 12.1.1.4. SWOT Analysis
- 12.1.2 R J Hill Laboratories Ltd
- 12.1.2.1. Company Overview
- 12.1.2.2. Products
- 12.1.2.3. Company Financials
- 12.1.2.4. SWOT Analysis
- 12.1.3 NSF International*List Not Exhaustive
- 12.1.3.1. Company Overview
- 12.1.3.2. Products
- 12.1.3.3. Company Financials
- 12.1.3.4. SWOT Analysis
- 12.1.4 Intertek Group PLC
- 12.1.4.1. Company Overview
- 12.1.4.2. Products
- 12.1.4.3. Company Financials
- 12.1.4.4. SWOT Analysis
- 12.1.5 Adpen Laboratories Inc
- 12.1.5.1. Company Overview
- 12.1.5.2. Products
- 12.1.5.3. Company Financials
- 12.1.5.4. SWOT Analysis
- 12.1.6 Bruker Biosciences Corporation
- 12.1.6.1. Company Overview
- 12.1.6.2. Products
- 12.1.6.3. Company Financials
- 12.1.6.4. SWOT Analysis
- 12.1.7 Genetic ID NA Inc
- 12.1.7.1. Company Overview
- 12.1.7.2. Products
- 12.1.7.3. Company Financials
- 12.1.7.4. SWOT Analysis
- 12.1.8 Genon Laboratories Ltd
- 12.1.8.1. Company Overview
- 12.1.8.2. Products
- 12.1.8.3. Company Financials
- 12.1.8.4. SWOT Analysis
- 12.1.9 Eurofins Scientific
- 12.1.9.1. Company Overview
- 12.1.9.2. Products
- 12.1.9.3. Company Financials
- 12.1.9.4. SWOT Analysis
- 12.1.10 Invisible Sentinel Inc
- 12.1.10.1. Company Overview
- 12.1.10.2. Products
- 12.1.10.3. Company Financials
- 12.1.10.4. SWOT Analysis
- 12.1.1 SGS SA
- 12.2. Market Entropy
- 12.2.1 Company's Key Areas Served
- 12.2.2 Recent Developments
- 12.3. Company Market Share Analysis 2025
- 12.3.1 Top 5 Companies Market Share Analysis
- 12.3.2 Top 3 Companies Market Share Analysis
- 12.4. List of Potential Customers
- 13. Research Methodology
List of Figures
- Figure 1: Global Feed Testing Market Revenue Breakdown (Million, %) by Region 2025 & 2033
- Figure 2: Global Feed Testing Market Volume Breakdown (Kiloton, %) by Region 2025 & 2033
- Figure 3: North America Feed Testing Market Revenue (Million), by Production Analysis 2025 & 2033
- Figure 4: North America Feed Testing Market Volume (Kiloton), by Production Analysis 2025 & 2033
- Figure 5: North America Feed Testing Market Revenue Share (%), by Production Analysis 2025 & 2033
- Figure 6: North America Feed Testing Market Volume Share (%), by Production Analysis 2025 & 2033
- Figure 7: North America Feed Testing Market Revenue (Million), by Consumption Analysis 2025 & 2033
- Figure 8: North America Feed Testing Market Volume (Kiloton), by Consumption Analysis 2025 & 2033
- Figure 9: North America Feed Testing Market Revenue Share (%), by Consumption Analysis 2025 & 2033
- Figure 10: North America Feed Testing Market Volume Share (%), by Consumption Analysis 2025 & 2033
- Figure 11: North America Feed Testing Market Revenue (Million), by Import Market Analysis (Value & Volume) 2025 & 2033
- Figure 12: North America Feed Testing Market Volume (Kiloton), by Import Market Analysis (Value & Volume) 2025 & 2033
- Figure 13: North America Feed Testing Market Revenue Share (%), by Import Market Analysis (Value & Volume) 2025 & 2033
- Figure 14: North America Feed Testing Market Volume Share (%), by Import Market Analysis (Value & Volume) 2025 & 2033
- Figure 15: North America Feed Testing Market Revenue (Million), by Export Market Analysis (Value & Volume) 2025 & 2033
- Figure 16: North America Feed Testing Market Volume (Kiloton), by Export Market Analysis (Value & Volume) 2025 & 2033
- Figure 17: North America Feed Testing Market Revenue Share (%), by Export Market Analysis (Value & Volume) 2025 & 2033
- Figure 18: North America Feed Testing Market Volume Share (%), by Export Market Analysis (Value & Volume) 2025 & 2033
- Figure 19: North America Feed Testing Market Revenue (Million), by Price Trend Analysis 2025 & 2033
- Figure 20: North America Feed Testing Market Volume (Kiloton), by Price Trend Analysis 2025 & 2033
- Figure 21: North America Feed Testing Market Revenue Share (%), by Price Trend Analysis 2025 & 2033
- Figure 22: North America Feed Testing Market Volume Share (%), by Price Trend Analysis 2025 & 2033
- Figure 23: North America Feed Testing Market Revenue (Million), by Country 2025 & 2033
- Figure 24: North America Feed Testing Market Volume (Kiloton), by Country 2025 & 2033
- Figure 25: North America Feed Testing Market Revenue Share (%), by Country 2025 & 2033
- Figure 26: North America Feed Testing Market Volume Share (%), by Country 2025 & 2033
- Figure 27: South America Feed Testing Market Revenue (Million), by Production Analysis 2025 & 2033
- Figure 28: South America Feed Testing Market Volume (Kiloton), by Production Analysis 2025 & 2033
- Figure 29: South America Feed Testing Market Revenue Share (%), by Production Analysis 2025 & 2033
- Figure 30: South America Feed Testing Market Volume Share (%), by Production Analysis 2025 & 2033
- Figure 31: South America Feed Testing Market Revenue (Million), by Consumption Analysis 2025 & 2033
- Figure 32: South America Feed Testing Market Volume (Kiloton), by Consumption Analysis 2025 & 2033
- Figure 33: South America Feed Testing Market Revenue Share (%), by Consumption Analysis 2025 & 2033
- Figure 34: South America Feed Testing Market Volume Share (%), by Consumption Analysis 2025 & 2033
- Figure 35: South America Feed Testing Market Revenue (Million), by Import Market Analysis (Value & Volume) 2025 & 2033
- Figure 36: South America Feed Testing Market Volume (Kiloton), by Import Market Analysis (Value & Volume) 2025 & 2033
- Figure 37: South America Feed Testing Market Revenue Share (%), by Import Market Analysis (Value & Volume) 2025 & 2033
- Figure 38: South America Feed Testing Market Volume Share (%), by Import Market Analysis (Value & Volume) 2025 & 2033
- Figure 39: South America Feed Testing Market Revenue (Million), by Export Market Analysis (Value & Volume) 2025 & 2033
- Figure 40: South America Feed Testing Market Volume (Kiloton), by Export Market Analysis (Value & Volume) 2025 & 2033
- Figure 41: South America Feed Testing Market Revenue Share (%), by Export Market Analysis (Value & Volume) 2025 & 2033
- Figure 42: South America Feed Testing Market Volume Share (%), by Export Market Analysis (Value & Volume) 2025 & 2033
- Figure 43: South America Feed Testing Market Revenue (Million), by Price Trend Analysis 2025 & 2033
- Figure 44: South America Feed Testing Market Volume (Kiloton), by Price Trend Analysis 2025 & 2033
- Figure 45: South America Feed Testing Market Revenue Share (%), by Price Trend Analysis 2025 & 2033
- Figure 46: South America Feed Testing Market Volume Share (%), by Price Trend Analysis 2025 & 2033
- Figure 47: South America Feed Testing Market Revenue (Million), by Country 2025 & 2033
- Figure 48: South America Feed Testing Market Volume (Kiloton), by Country 2025 & 2033
- Figure 49: South America Feed Testing Market Revenue Share (%), by Country 2025 & 2033
- Figure 50: South America Feed Testing Market Volume Share (%), by Country 2025 & 2033
- Figure 51: Europe Feed Testing Market Revenue (Million), by Production Analysis 2025 & 2033
- Figure 52: Europe Feed Testing Market Volume (Kiloton), by Production Analysis 2025 & 2033
- Figure 53: Europe Feed Testing Market Revenue Share (%), by Production Analysis 2025 & 2033
- Figure 54: Europe Feed Testing Market Volume Share (%), by Production Analysis 2025 & 2033
- Figure 55: Europe Feed Testing Market Revenue (Million), by Consumption Analysis 2025 & 2033
- Figure 56: Europe Feed Testing Market Volume (Kiloton), by Consumption Analysis 2025 & 2033
- Figure 57: Europe Feed Testing Market Revenue Share (%), by Consumption Analysis 2025 & 2033
- Figure 58: Europe Feed Testing Market Volume Share (%), by Consumption Analysis 2025 & 2033
- Figure 59: Europe Feed Testing Market Revenue (Million), by Import Market Analysis (Value & Volume) 2025 & 2033
- Figure 60: Europe Feed Testing Market Volume (Kiloton), by Import Market Analysis (Value & Volume) 2025 & 2033
- Figure 61: Europe Feed Testing Market Revenue Share (%), by Import Market Analysis (Value & Volume) 2025 & 2033
- Figure 62: Europe Feed Testing Market Volume Share (%), by Import Market Analysis (Value & Volume) 2025 & 2033
- Figure 63: Europe Feed Testing Market Revenue (Million), by Export Market Analysis (Value & Volume) 2025 & 2033
- Figure 64: Europe Feed Testing Market Volume (Kiloton), by Export Market Analysis (Value & Volume) 2025 & 2033
- Figure 65: Europe Feed Testing Market Revenue Share (%), by Export Market Analysis (Value & Volume) 2025 & 2033
- Figure 66: Europe Feed Testing Market Volume Share (%), by Export Market Analysis (Value & Volume) 2025 & 2033
- Figure 67: Europe Feed Testing Market Revenue (Million), by Price Trend Analysis 2025 & 2033
- Figure 68: Europe Feed Testing Market Volume (Kiloton), by Price Trend Analysis 2025 & 2033
- Figure 69: Europe Feed Testing Market Revenue Share (%), by Price Trend Analysis 2025 & 2033
- Figure 70: Europe Feed Testing Market Volume Share (%), by Price Trend Analysis 2025 & 2033
- Figure 71: Europe Feed Testing Market Revenue (Million), by Country 2025 & 2033
- Figure 72: Europe Feed Testing Market Volume (Kiloton), by Country 2025 & 2033
- Figure 73: Europe Feed Testing Market Revenue Share (%), by Country 2025 & 2033
- Figure 74: Europe Feed Testing Market Volume Share (%), by Country 2025 & 2033
- Figure 75: Middle East & Africa Feed Testing Market Revenue (Million), by Production Analysis 2025 & 2033
- Figure 76: Middle East & Africa Feed Testing Market Volume (Kiloton), by Production Analysis 2025 & 2033
- Figure 77: Middle East & Africa Feed Testing Market Revenue Share (%), by Production Analysis 2025 & 2033
- Figure 78: Middle East & Africa Feed Testing Market Volume Share (%), by Production Analysis 2025 & 2033
- Figure 79: Middle East & Africa Feed Testing Market Revenue (Million), by Consumption Analysis 2025 & 2033
- Figure 80: Middle East & Africa Feed Testing Market Volume (Kiloton), by Consumption Analysis 2025 & 2033
- Figure 81: Middle East & Africa Feed Testing Market Revenue Share (%), by Consumption Analysis 2025 & 2033
- Figure 82: Middle East & Africa Feed Testing Market Volume Share (%), by Consumption Analysis 2025 & 2033
- Figure 83: Middle East & Africa Feed Testing Market Revenue (Million), by Import Market Analysis (Value & Volume) 2025 & 2033
- Figure 84: Middle East & Africa Feed Testing Market Volume (Kiloton), by Import Market Analysis (Value & Volume) 2025 & 2033
- Figure 85: Middle East & Africa Feed Testing Market Revenue Share (%), by Import Market Analysis (Value & Volume) 2025 & 2033
- Figure 86: Middle East & Africa Feed Testing Market Volume Share (%), by Import Market Analysis (Value & Volume) 2025 & 2033
- Figure 87: Middle East & Africa Feed Testing Market Revenue (Million), by Export Market Analysis (Value & Volume) 2025 & 2033
- Figure 88: Middle East & Africa Feed Testing Market Volume (Kiloton), by Export Market Analysis (Value & Volume) 2025 & 2033
- Figure 89: Middle East & Africa Feed Testing Market Revenue Share (%), by Export Market Analysis (Value & Volume) 2025 & 2033
- Figure 90: Middle East & Africa Feed Testing Market Volume Share (%), by Export Market Analysis (Value & Volume) 2025 & 2033
- Figure 91: Middle East & Africa Feed Testing Market Revenue (Million), by Price Trend Analysis 2025 & 2033
- Figure 92: Middle East & Africa Feed Testing Market Volume (Kiloton), by Price Trend Analysis 2025 & 2033
- Figure 93: Middle East & Africa Feed Testing Market Revenue Share (%), by Price Trend Analysis 2025 & 2033
- Figure 94: Middle East & Africa Feed Testing Market Volume Share (%), by Price Trend Analysis 2025 & 2033
- Figure 95: Middle East & Africa Feed Testing Market Revenue (Million), by Country 2025 & 2033
- Figure 96: Middle East & Africa Feed Testing Market Volume (Kiloton), by Country 2025 & 2033
- Figure 97: Middle East & Africa Feed Testing Market Revenue Share (%), by Country 2025 & 2033
- Figure 98: Middle East & Africa Feed Testing Market Volume Share (%), by Country 2025 & 2033
- Figure 99: Asia Pacific Feed Testing Market Revenue (Million), by Production Analysis 2025 & 2033
- Figure 100: Asia Pacific Feed Testing Market Volume (Kiloton), by Production Analysis 2025 & 2033
- Figure 101: Asia Pacific Feed Testing Market Revenue Share (%), by Production Analysis 2025 & 2033
- Figure 102: Asia Pacific Feed Testing Market Volume Share (%), by Production Analysis 2025 & 2033
- Figure 103: Asia Pacific Feed Testing Market Revenue (Million), by Consumption Analysis 2025 & 2033
- Figure 104: Asia Pacific Feed Testing Market Volume (Kiloton), by Consumption Analysis 2025 & 2033
- Figure 105: Asia Pacific Feed Testing Market Revenue Share (%), by Consumption Analysis 2025 & 2033
- Figure 106: Asia Pacific Feed Testing Market Volume Share (%), by Consumption Analysis 2025 & 2033
- Figure 107: Asia Pacific Feed Testing Market Revenue (Million), by Import Market Analysis (Value & Volume) 2025 & 2033
- Figure 108: Asia Pacific Feed Testing Market Volume (Kiloton), by Import Market Analysis (Value & Volume) 2025 & 2033
- Figure 109: Asia Pacific Feed Testing Market Revenue Share (%), by Import Market Analysis (Value & Volume) 2025 & 2033
- Figure 110: Asia Pacific Feed Testing Market Volume Share (%), by Import Market Analysis (Value & Volume) 2025 & 2033
- Figure 111: Asia Pacific Feed Testing Market Revenue (Million), by Export Market Analysis (Value & Volume) 2025 & 2033
- Figure 112: Asia Pacific Feed Testing Market Volume (Kiloton), by Export Market Analysis (Value & Volume) 2025 & 2033
- Figure 113: Asia Pacific Feed Testing Market Revenue Share (%), by Export Market Analysis (Value & Volume) 2025 & 2033
- Figure 114: Asia Pacific Feed Testing Market Volume Share (%), by Export Market Analysis (Value & Volume) 2025 & 2033
- Figure 115: Asia Pacific Feed Testing Market Revenue (Million), by Price Trend Analysis 2025 & 2033
- Figure 116: Asia Pacific Feed Testing Market Volume (Kiloton), by Price Trend Analysis 2025 & 2033
- Figure 117: Asia Pacific Feed Testing Market Revenue Share (%), by Price Trend Analysis 2025 & 2033
- Figure 118: Asia Pacific Feed Testing Market Volume Share (%), by Price Trend Analysis 2025 & 2033
- Figure 119: Asia Pacific Feed Testing Market Revenue (Million), by Country 2025 & 2033
- Figure 120: Asia Pacific Feed Testing Market Volume (Kiloton), by Country 2025 & 2033
- Figure 121: Asia Pacific Feed Testing Market Revenue Share (%), by Country 2025 & 2033
- Figure 122: Asia Pacific Feed Testing Market Volume Share (%), by Country 2025 & 2033
List of Tables
- Table 1: Global Feed Testing Market Revenue Million Forecast, by Production Analysis 2020 & 2033
- Table 2: Global Feed Testing Market Volume Kiloton Forecast, by Production Analysis 2020 & 2033
- Table 3: Global Feed Testing Market Revenue Million Forecast, by Consumption Analysis 2020 & 2033
- Table 4: Global Feed Testing Market Volume Kiloton Forecast, by Consumption Analysis 2020 & 2033
- Table 5: Global Feed Testing Market Revenue Million Forecast, by Import Market Analysis (Value & Volume) 2020 & 2033
- Table 6: Global Feed Testing Market Volume Kiloton Forecast, by Import Market Analysis (Value & Volume) 2020 & 2033
- Table 7: Global Feed Testing Market Revenue Million Forecast, by Export Market Analysis (Value & Volume) 2020 & 2033
- Table 8: Global Feed Testing Market Volume Kiloton Forecast, by Export Market Analysis (Value & Volume) 2020 & 2033
- Table 9: Global Feed Testing Market Revenue Million Forecast, by Price Trend Analysis 2020 & 2033
- Table 10: Global Feed Testing Market Volume Kiloton Forecast, by Price Trend Analysis 2020 & 2033
- Table 11: Global Feed Testing Market Revenue Million Forecast, by Region 2020 & 2033
- Table 12: Global Feed Testing Market Volume Kiloton Forecast, by Region 2020 & 2033
- Table 13: Global Feed Testing Market Revenue Million Forecast, by Production Analysis 2020 & 2033
- Table 14: Global Feed Testing Market Volume Kiloton Forecast, by Production Analysis 2020 & 2033
- Table 15: Global Feed Testing Market Revenue Million Forecast, by Consumption Analysis 2020 & 2033
- Table 16: Global Feed Testing Market Volume Kiloton Forecast, by Consumption Analysis 2020 & 2033
- Table 17: Global Feed Testing Market Revenue Million Forecast, by Import Market Analysis (Value & Volume) 2020 & 2033
- Table 18: Global Feed Testing Market Volume Kiloton Forecast, by Import Market Analysis (Value & Volume) 2020 & 2033
- Table 19: Global Feed Testing Market Revenue Million Forecast, by Export Market Analysis (Value & Volume) 2020 & 2033
- Table 20: Global Feed Testing Market Volume Kiloton Forecast, by Export Market Analysis (Value & Volume) 2020 & 2033
- Table 21: Global Feed Testing Market Revenue Million Forecast, by Price Trend Analysis 2020 & 2033
- Table 22: Global Feed Testing Market Volume Kiloton Forecast, by Price Trend Analysis 2020 & 2033
- Table 23: Global Feed Testing Market Revenue Million Forecast, by Country 2020 & 2033
- Table 24: Global Feed Testing Market Volume Kiloton Forecast, by Country 2020 & 2033
- Table 25: United States Feed Testing Market Revenue (Million) Forecast, by Application 2020 & 2033
- Table 26: United States Feed Testing Market Volume (Kiloton) Forecast, by Application 2020 & 2033
- Table 27: Canada Feed Testing Market Revenue (Million) Forecast, by Application 2020 & 2033
- Table 28: Canada Feed Testing Market Volume (Kiloton) Forecast, by Application 2020 & 2033
- Table 29: Mexico Feed Testing Market Revenue (Million) Forecast, by Application 2020 & 2033
- Table 30: Mexico Feed Testing Market Volume (Kiloton) Forecast, by Application 2020 & 2033
- Table 31: Global Feed Testing Market Revenue Million Forecast, by Production Analysis 2020 & 2033
- Table 32: Global Feed Testing Market Volume Kiloton Forecast, by Production Analysis 2020 & 2033
- Table 33: Global Feed Testing Market Revenue Million Forecast, by Consumption Analysis 2020 & 2033
- Table 34: Global Feed Testing Market Volume Kiloton Forecast, by Consumption Analysis 2020 & 2033
- Table 35: Global Feed Testing Market Revenue Million Forecast, by Import Market Analysis (Value & Volume) 2020 & 2033
- Table 36: Global Feed Testing Market Volume Kiloton Forecast, by Import Market Analysis (Value & Volume) 2020 & 2033
- Table 37: Global Feed Testing Market Revenue Million Forecast, by Export Market Analysis (Value & Volume) 2020 & 2033
- Table 38: Global Feed Testing Market Volume Kiloton Forecast, by Export Market Analysis (Value & Volume) 2020 & 2033
- Table 39: Global Feed Testing Market Revenue Million Forecast, by Price Trend Analysis 2020 & 2033
- Table 40: Global Feed Testing Market Volume Kiloton Forecast, by Price Trend Analysis 2020 & 2033
- Table 41: Global Feed Testing Market Revenue Million Forecast, by Country 2020 & 2033
- Table 42: Global Feed Testing Market Volume Kiloton Forecast, by Country 2020 & 2033
- Table 43: Brazil Feed Testing Market Revenue (Million) Forecast, by Application 2020 & 2033
- Table 44: Brazil Feed Testing Market Volume (Kiloton) Forecast, by Application 2020 & 2033
- Table 45: Argentina Feed Testing Market Revenue (Million) Forecast, by Application 2020 & 2033
- Table 46: Argentina Feed Testing Market Volume (Kiloton) Forecast, by Application 2020 & 2033
- Table 47: Rest of South America Feed Testing Market Revenue (Million) Forecast, by Application 2020 & 2033
- Table 48: Rest of South America Feed Testing Market Volume (Kiloton) Forecast, by Application 2020 & 2033
- Table 49: Global Feed Testing Market Revenue Million Forecast, by Production Analysis 2020 & 2033
- Table 50: Global Feed Testing Market Volume Kiloton Forecast, by Production Analysis 2020 & 2033
- Table 51: Global Feed Testing Market Revenue Million Forecast, by Consumption Analysis 2020 & 2033
- Table 52: Global Feed Testing Market Volume Kiloton Forecast, by Consumption Analysis 2020 & 2033
- Table 53: Global Feed Testing Market Revenue Million Forecast, by Import Market Analysis (Value & Volume) 2020 & 2033
- Table 54: Global Feed Testing Market Volume Kiloton Forecast, by Import Market Analysis (Value & Volume) 2020 & 2033
- Table 55: Global Feed Testing Market Revenue Million Forecast, by Export Market Analysis (Value & Volume) 2020 & 2033
- Table 56: Global Feed Testing Market Volume Kiloton Forecast, by Export Market Analysis (Value & Volume) 2020 & 2033
- Table 57: Global Feed Testing Market Revenue Million Forecast, by Price Trend Analysis 2020 & 2033
- Table 58: Global Feed Testing Market Volume Kiloton Forecast, by Price Trend Analysis 2020 & 2033
- Table 59: Global Feed Testing Market Revenue Million Forecast, by Country 2020 & 2033
- Table 60: Global Feed Testing Market Volume Kiloton Forecast, by Country 2020 & 2033
- Table 61: United Kingdom Feed Testing Market Revenue (Million) Forecast, by Application 2020 & 2033
- Table 62: United Kingdom Feed Testing Market Volume (Kiloton) Forecast, by Application 2020 & 2033
- Table 63: Germany Feed Testing Market Revenue (Million) Forecast, by Application 2020 & 2033
- Table 64: Germany Feed Testing Market Volume (Kiloton) Forecast, by Application 2020 & 2033
- Table 65: France Feed Testing Market Revenue (Million) Forecast, by Application 2020 & 2033
- Table 66: France Feed Testing Market Volume (Kiloton) Forecast, by Application 2020 & 2033
- Table 67: Italy Feed Testing Market Revenue (Million) Forecast, by Application 2020 & 2033
- Table 68: Italy Feed Testing Market Volume (Kiloton) Forecast, by Application 2020 & 2033
- Table 69: Spain Feed Testing Market Revenue (Million) Forecast, by Application 2020 & 2033
- Table 70: Spain Feed Testing Market Volume (Kiloton) Forecast, by Application 2020 & 2033
- Table 71: Russia Feed Testing Market Revenue (Million) Forecast, by Application 2020 & 2033
- Table 72: Russia Feed Testing Market Volume (Kiloton) Forecast, by Application 2020 & 2033
- Table 73: Benelux Feed Testing Market Revenue (Million) Forecast, by Application 2020 & 2033
- Table 74: Benelux Feed Testing Market Volume (Kiloton) Forecast, by Application 2020 & 2033
- Table 75: Nordics Feed Testing Market Revenue (Million) Forecast, by Application 2020 & 2033
- Table 76: Nordics Feed Testing Market Volume (Kiloton) Forecast, by Application 2020 & 2033
- Table 77: Rest of Europe Feed Testing Market Revenue (Million) Forecast, by Application 2020 & 2033
- Table 78: Rest of Europe Feed Testing Market Volume (Kiloton) Forecast, by Application 2020 & 2033
- Table 79: Global Feed Testing Market Revenue Million Forecast, by Production Analysis 2020 & 2033
- Table 80: Global Feed Testing Market Volume Kiloton Forecast, by Production Analysis 2020 & 2033
- Table 81: Global Feed Testing Market Revenue Million Forecast, by Consumption Analysis 2020 & 2033
- Table 82: Global Feed Testing Market Volume Kiloton Forecast, by Consumption Analysis 2020 & 2033
- Table 83: Global Feed Testing Market Revenue Million Forecast, by Import Market Analysis (Value & Volume) 2020 & 2033
- Table 84: Global Feed Testing Market Volume Kiloton Forecast, by Import Market Analysis (Value & Volume) 2020 & 2033
- Table 85: Global Feed Testing Market Revenue Million Forecast, by Export Market Analysis (Value & Volume) 2020 & 2033
- Table 86: Global Feed Testing Market Volume Kiloton Forecast, by Export Market Analysis (Value & Volume) 2020 & 2033
- Table 87: Global Feed Testing Market Revenue Million Forecast, by Price Trend Analysis 2020 & 2033
- Table 88: Global Feed Testing Market Volume Kiloton Forecast, by Price Trend Analysis 2020 & 2033
- Table 89: Global Feed Testing Market Revenue Million Forecast, by Country 2020 & 2033
- Table 90: Global Feed Testing Market Volume Kiloton Forecast, by Country 2020 & 2033
- Table 91: Turkey Feed Testing Market Revenue (Million) Forecast, by Application 2020 & 2033
- Table 92: Turkey Feed Testing Market Volume (Kiloton) Forecast, by Application 2020 & 2033
- Table 93: Israel Feed Testing Market Revenue (Million) Forecast, by Application 2020 & 2033
- Table 94: Israel Feed Testing Market Volume (Kiloton) Forecast, by Application 2020 & 2033
- Table 95: GCC Feed Testing Market Revenue (Million) Forecast, by Application 2020 & 2033
- Table 96: GCC Feed Testing Market Volume (Kiloton) Forecast, by Application 2020 & 2033
- Table 97: North Africa Feed Testing Market Revenue (Million) Forecast, by Application 2020 & 2033
- Table 98: North Africa Feed Testing Market Volume (Kiloton) Forecast, by Application 2020 & 2033
- Table 99: South Africa Feed Testing Market Revenue (Million) Forecast, by Application 2020 & 2033
- Table 100: South Africa Feed Testing Market Volume (Kiloton) Forecast, by Application 2020 & 2033
- Table 101: Rest of Middle East & Africa Feed Testing Market Revenue (Million) Forecast, by Application 2020 & 2033
- Table 102: Rest of Middle East & Africa Feed Testing Market Volume (Kiloton) Forecast, by Application 2020 & 2033
- Table 103: Global Feed Testing Market Revenue Million Forecast, by Production Analysis 2020 & 2033
- Table 104: Global Feed Testing Market Volume Kiloton Forecast, by Production Analysis 2020 & 2033
- Table 105: Global Feed Testing Market Revenue Million Forecast, by Consumption Analysis 2020 & 2033
- Table 106: Global Feed Testing Market Volume Kiloton Forecast, by Consumption Analysis 2020 & 2033
- Table 107: Global Feed Testing Market Revenue Million Forecast, by Import Market Analysis (Value & Volume) 2020 & 2033
- Table 108: Global Feed Testing Market Volume Kiloton Forecast, by Import Market Analysis (Value & Volume) 2020 & 2033
- Table 109: Global Feed Testing Market Revenue Million Forecast, by Export Market Analysis (Value & Volume) 2020 & 2033
- Table 110: Global Feed Testing Market Volume Kiloton Forecast, by Export Market Analysis (Value & Volume) 2020 & 2033
- Table 111: Global Feed Testing Market Revenue Million Forecast, by Price Trend Analysis 2020 & 2033
- Table 112: Global Feed Testing Market Volume Kiloton Forecast, by Price Trend Analysis 2020 & 2033
- Table 113: Global Feed Testing Market Revenue Million Forecast, by Country 2020 & 2033
- Table 114: Global Feed Testing Market Volume Kiloton Forecast, by Country 2020 & 2033
- Table 115: China Feed Testing Market Revenue (Million) Forecast, by Application 2020 & 2033
- Table 116: China Feed Testing Market Volume (Kiloton) Forecast, by Application 2020 & 2033
- Table 117: India Feed Testing Market Revenue (Million) Forecast, by Application 2020 & 2033
- Table 118: India Feed Testing Market Volume (Kiloton) Forecast, by Application 2020 & 2033
- Table 119: Japan Feed Testing Market Revenue (Million) Forecast, by Application 2020 & 2033
- Table 120: Japan Feed Testing Market Volume (Kiloton) Forecast, by Application 2020 & 2033
- Table 121: South Korea Feed Testing Market Revenue (Million) Forecast, by Application 2020 & 2033
- Table 122: South Korea Feed Testing Market Volume (Kiloton) Forecast, by Application 2020 & 2033
- Table 123: ASEAN Feed Testing Market Revenue (Million) Forecast, by Application 2020 & 2033
- Table 124: ASEAN Feed Testing Market Volume (Kiloton) Forecast, by Application 2020 & 2033
- Table 125: Oceania Feed Testing Market Revenue (Million) Forecast, by Application 2020 & 2033
- Table 126: Oceania Feed Testing Market Volume (Kiloton) Forecast, by Application 2020 & 2033
- Table 127: Rest of Asia Pacific Feed Testing Market Revenue (Million) Forecast, by Application 2020 & 2033
- Table 128: Rest of Asia Pacific Feed Testing Market Volume (Kiloton) Forecast, by Application 2020 & 2033
Frequently Asked Questions
1. What is the projected Compound Annual Growth Rate (CAGR) of the Feed Testing Market?
The projected CAGR is approximately 9.80%.
2. Which companies are prominent players in the Feed Testing Market?
Key companies in the market include SGS SA, R J Hill Laboratories Ltd, NSF International*List Not Exhaustive, Intertek Group PLC, Adpen Laboratories Inc, Bruker Biosciences Corporation, Genetic ID NA Inc, Genon Laboratories Ltd, Eurofins Scientific, Invisible Sentinel Inc.
3. What are the main segments of the Feed Testing Market?
The market segments include Production Analysis, Consumption Analysis, Import Market Analysis (Value & Volume), Export Market Analysis (Value & Volume), Price Trend Analysis.
4. Can you provide details about the market size?
The market size is estimated to be USD 2.54 Million as of 2022.
5. What are some drivers contributing to market growth?
Decreasing Per Capita Arable Land; Increased Demand for Food.
6. What are the notable trends driving market growth?
Increasing Government Regulations Driving Growth of Pet Food Testing Market.
7. Are there any restraints impacting market growth?
High Initial Investments; Requirement of Precision Agriculture.
8. Can you provide examples of recent developments in the market?
N/A
9. What pricing options are available for accessing the report?
Pricing options include single-user, multi-user, and enterprise licenses priced at USD 4750, USD 5250, and USD 8750 respectively.
10. Is the market size provided in terms of value or volume?
The market size is provided in terms of value, measured in Million and volume, measured in Kiloton.
11. Are there any specific market keywords associated with the report?
Yes, the market keyword associated with the report is "Feed Testing Market," which aids in identifying and referencing the specific market segment covered.
12. How do I determine which pricing option suits my needs best?
The pricing options vary based on user requirements and access needs. Individual users may opt for single-user licenses, while businesses requiring broader access may choose multi-user or enterprise licenses for cost-effective access to the report.
13. Are there any additional resources or data provided in the Feed Testing Market report?
While the report offers comprehensive insights, it's advisable to review the specific contents or supplementary materials provided to ascertain if additional resources or data are available.
14. How can I stay updated on further developments or reports in the Feed Testing Market?
To stay informed about further developments, trends, and reports in the Feed Testing Market, consider subscribing to industry newsletters, following relevant companies and organizations, or regularly checking reputable industry news sources and publications.
Methodology
Step 1 - Identification of Relevant Samples Size from Population Database


Step 2 - Approaches for Defining Global Market Size (Value, Volume* & Price*)

Note*: In applicable scenarios
Step 3 - Data Sources
Primary Research
- Web Analytics
- Survey Reports
- Research Institute
- Latest Research Reports
- Opinion Leaders
Secondary Research
- Annual Reports
- White Paper
- Latest Press Release
- Industry Association
- Paid Database
- Investor Presentations

Step 4 - Data Triangulation
Involves using different sources of information in order to increase the validity of a study
These sources are likely to be stakeholders in a program - participants, other researchers, program staff, other community members, and so on.
Then we put all data in single framework & apply various statistical tools to find out the dynamic on the market.
During the analysis stage, feedback from the stakeholder groups would be compared to determine areas of agreement as well as areas of divergence