

Key Insights
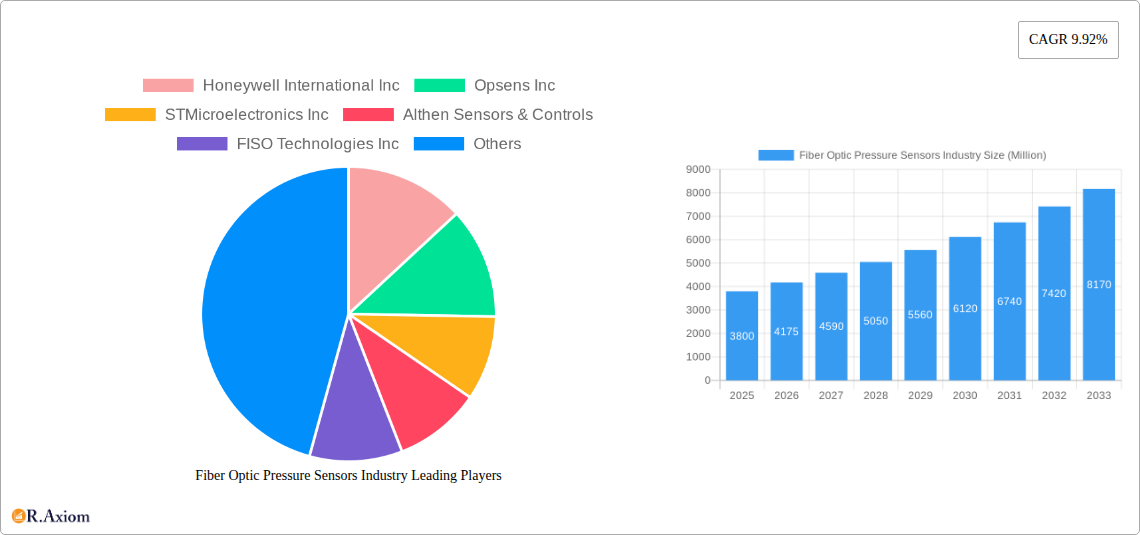
The global Fiber Optic Pressure Sensors market is poised for significant expansion, projected to reach USD 3.8 billion in 2025, with a robust Compound Annual Growth Rate (CAGR) of 10.7%. This growth trajectory is primarily fueled by an increasing demand for high-performance pressure sensing solutions across a multitude of industries. Key drivers include the inherent advantages of fiber optic technology, such as immunity to electromagnetic interference, high accuracy, and the ability to operate in extreme environments, making them indispensable in sectors like automotive, where precise pressure monitoring is critical for safety and efficiency, and healthcare, for advanced diagnostic and monitoring equipment. The burgeoning adoption of Industry 4.0 principles, which emphasize automation and real-time data acquisition, further propels the demand for these sophisticated sensors. Furthermore, advancements in fiber optic sensor technology, leading to enhanced sensitivity, miniaturization, and cost-effectiveness, are continually expanding their application scope. The market is witnessing a surge in wireless fiber optic pressure sensor solutions, offering greater flexibility and ease of deployment, catering to evolving industrial needs.
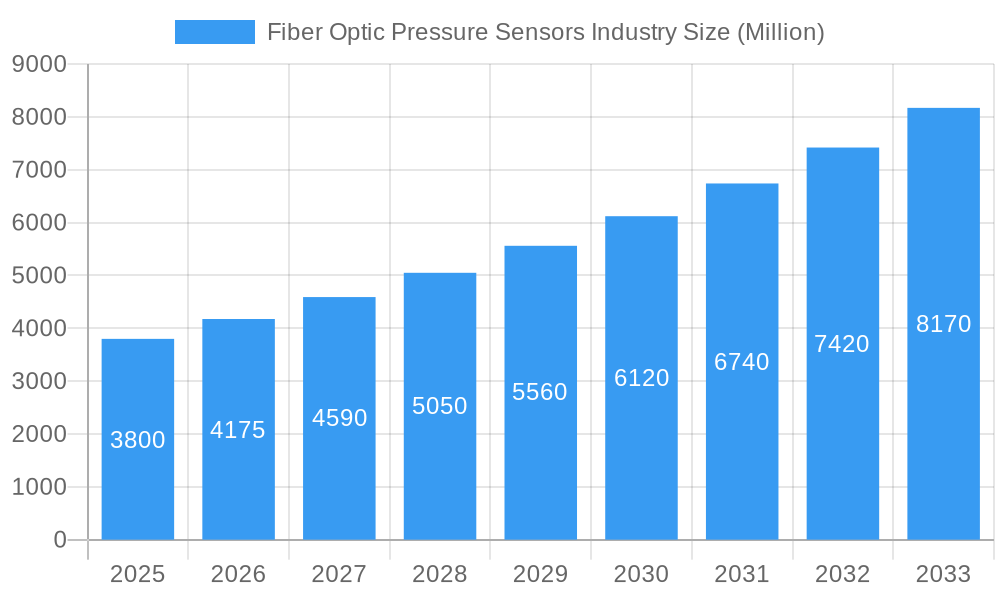
Fiber Optic Pressure Sensors Industry Market Size (In Billion)
The market's dynamism is also shaped by prevailing trends such as the integration of fiber optic pressure sensors with AI and machine learning for predictive maintenance and advanced analytics, particularly in the oil and gas and petrochemical sectors for optimizing operations and ensuring safety. The expansion of smart grid infrastructure and the increasing deployment of renewable energy sources also necessitate reliable pressure monitoring, contributing to market growth. While the market demonstrates strong upward momentum, certain restraints like the initial cost of implementation for some advanced systems and the need for specialized expertise for installation and maintenance might pose localized challenges. However, the long-term benefits of superior performance, durability, and reduced lifecycle costs are expected to outweigh these considerations, solidifying the market's growth potential throughout the forecast period. Segmentation by technology reveals a strong preference for established methods like Fiber Bragg Grating and Intensity-based sensors, alongside emerging innovations.
Fiber Optic Pressure Sensors Industry Company Market Share
This comprehensive report delves into the dynamic Fiber Optic Pressure Sensors Industry, providing an in-depth analysis of market dynamics, technological advancements, and growth opportunities. With a study period spanning from 2019 to 2033, a base year of 2025, and a detailed forecast period from 2025 to 2033, this report offers unparalleled insights for stakeholders seeking to navigate this rapidly evolving sector. Our analysis encompasses key segments including Type (Wired, Wireless), Technology (Fabry-Perot, Fiber Bragg Grating, Intensity-based, Other Technologies), and Application (Automotive, Consumer Electronics, Healthcare, Industrial, Oil and Gas, Petrochemical, Other Applications), with a projected global market size estimated to reach $X billion by 2033, growing at a Compound Annual Growth Rate (CAGR) of X%.
Fiber Optic Pressure Sensors Industry Market Concentration & Innovation
The Fiber Optic Pressure Sensors market exhibits a moderate to high concentration, with key players such as Honeywell International Inc., Opsens Inc., STMicroelectronics Inc., Althen Sensors & Controls, FISO Technologies Inc., NXP Semiconductors, Omron Corporation, Robert Bosch GmbH, Infineon Technologies Inc., and Panasonic Corporation holding significant market shares. Innovation is a primary driver, fueled by advancements in sensor materials, miniaturization, and integration capabilities. Regulatory frameworks, particularly in healthcare and industrial sectors, are becoming more stringent, demanding higher accuracy and reliability, thereby pushing innovation. Product substitutes, while present in the form of traditional pressure sensors, are gradually being outpaced by the inherent advantages of fiber optic technology, including immunity to electromagnetic interference, intrinsic safety, and remote sensing capabilities. End-user trends lean towards smart, connected systems requiring robust and reliable sensing solutions, accelerating the adoption of fiber optic pressure sensors. Mergers and acquisitions (M&A) activity, with an estimated $X billion in deal values recorded during the historical period, plays a crucial role in market consolidation and the expansion of product portfolios.
- Key Innovation Drivers: Miniaturization, enhanced accuracy, multiplexing capabilities, development of novel fiber coatings for extreme environments.
- Regulatory Impact: Stringent quality control and performance standards in medical devices and hazardous industrial applications.
- M&A Focus: Acquisition of specialized sensor technologies and expansion into high-growth application segments.
Fiber Optic Pressure Sensors Industry Industry Trends & Insights
The global Fiber Optic Pressure Sensors market is poised for substantial growth, driven by a confluence of technological advancements and expanding application frontiers. The increasing demand for high-performance, reliable, and robust sensing solutions across diverse industries is a paramount growth driver. The automotive sector is witnessing a surge in adoption for applications such as tire pressure monitoring systems, engine management, and advanced driver-assistance systems (ADAS), where the immunity to electromagnetic interference offered by fiber optics is critical. In the healthcare industry, fiber optic pressure sensors are indispensable for minimally invasive surgical procedures, patient monitoring, and diagnostic equipment due to their biocompatibility and accuracy. The industrial sector, encompassing oil and gas, petrochemical, and manufacturing, relies heavily on these sensors for process control, safety monitoring, and harsh environment operations, where conventional sensors falter.
Technological disruptions are continuously reshaping the market. Advancements in Fabry-Perot and Fiber Bragg Grating (FBG) technologies have led to higher sensitivity, wider dynamic ranges, and improved multiplexing capabilities, allowing multiple sensors to be read from a single fiber. Intensity-based sensors continue to offer cost-effectiveness for less demanding applications. The integration of artificial intelligence (AI) and machine learning (ML) with sensor data is enabling predictive maintenance and real-time process optimization, further enhancing the value proposition. Consumer preferences are increasingly shifting towards smart devices and connected ecosystems, where reliable and embedded sensing is essential. The competitive landscape is characterized by continuous product innovation and strategic partnerships aimed at expanding market reach and technological expertise. The market penetration of fiber optic pressure sensors is expected to deepen, particularly in emerging economies as infrastructure development and industrialization accelerate. The overall CAGR for the forecast period is estimated to be robust, reflecting the sustained demand and technological evolution within this critical industry.
Dominant Markets & Segments in Fiber Optic Pressure Sensors Industry
The Industrial application segment is projected to dominate the Fiber Optic Pressure Sensors market, propelled by the stringent requirements for reliability, safety, and precision in sectors like Oil and Gas, Petrochemical, and general manufacturing. The inherent advantages of fiber optic sensors, such as their immunity to harsh environments, electromagnetic interference (EMI), and hazardous conditions, make them indispensable for these critical operations. Within the industrial realm, Oil and Gas exploration and production, particularly in offshore and subsea applications, represent a significant revenue stream. The need for continuous monitoring of downhole pressures, pipeline integrity, and processing facilities drives substantial demand.
Geographically, North America and Europe currently lead the market, owing to their established industrial bases, advanced technological infrastructure, and stringent regulatory compliance mandates. However, the Asia Pacific region is exhibiting the fastest growth, driven by rapid industrialization, significant investments in infrastructure, and the burgeoning demand for smart manufacturing and automation.
- Dominant Technology: Fiber Bragg Grating (FBG) technology holds a commanding position due to its multiplexing capabilities, high resolution, and ease of integration into complex systems. Fabry-Perot sensors also show significant traction, especially in applications requiring very high sensitivity.
- Leading Application: Industrial applications, with Oil & Gas and Petrochemical segments being key contributors, followed by Healthcare due to increasing demand for advanced medical devices.
- Key Regional Drivers:
- North America/Europe: Robust industrial base, stringent safety regulations, high R&D investment.
- Asia Pacific: Rapid industrial growth, government initiatives supporting smart manufacturing, expanding healthcare sector, infrastructure development projects.
- Wired vs. Wireless: While wired configurations remain prevalent due to their inherent reliability and data integrity in static applications, the development of advanced wireless interrogation systems is gradually increasing the market share of wireless fiber optic pressure sensors, especially in challenging installation scenarios.
Fiber Optic Pressure Sensors Industry Product Developments
Recent product developments in the Fiber Optic Pressure Sensors industry are characterized by enhanced miniaturization, improved accuracy, and wider operational temperature ranges. Innovations in Fabry-Perot and Fiber Bragg Grating (FBG) technologies are leading to sensors with superior resolution and multiplexing capabilities. For instance, new FBG sensors are being designed for extremely high-pressure environments in the oil and gas sector, while Fabry-Perot sensors are finding wider application in minimally invasive healthcare devices. The integration of these sensors with advanced interrogation units and data processing algorithms is creating more intelligent and responsive systems, offering significant competitive advantages in demanding applications across automotive, industrial, and healthcare sectors.
Report Scope & Segmentation Analysis
This report meticulously analyzes the Fiber Optic Pressure Sensors market across key segmentation dimensions to provide a granular understanding of market dynamics.
Type: The Wired segment is expected to retain its dominance due to established infrastructure and high reliability requirements, though the Wireless segment is projected for significant growth, driven by flexibility and ease of deployment in hard-to-reach areas.
Technology: Fiber Bragg Grating (FBG) technology is anticipated to lead, owing to its multiplexing capabilities and robust performance. Fabry-Perot sensors are expected to witness substantial growth, particularly in niche applications demanding exceptional sensitivity. Intensity-based sensors will continue to cater to cost-sensitive markets.
Application: The Industrial sector is projected to be the largest segment, driven by the Oil & Gas and Petrochemical industries. Healthcare applications are also slated for robust expansion, fueled by advancements in medical technology. The Automotive sector's demand will grow with the increasing complexity of vehicle systems.
Key Drivers of Fiber Optic Pressure Sensors Industry Growth
The Fiber Optic Pressure Sensors Industry is propelled by several critical growth drivers. The increasing demand for high-precision and reliable measurements in harsh and hazardous environments, especially within the oil and gas and petrochemical sectors, is a primary catalyst. Furthermore, the growing adoption of industrial automation and the Internet of Things (IoT) necessitates advanced sensing solutions like fiber optics, which offer immunity to electromagnetic interference and intrinsic safety. In the healthcare sector, the trend towards minimally invasive procedures and advanced diagnostics relies heavily on the accuracy and biocompatibility of fiber optic sensors. Government initiatives promoting industrial safety and infrastructure development also contribute significantly to market expansion.
Challenges in the Fiber Optic Pressure Sensors Industry Sector
Despite the promising growth trajectory, the Fiber Optic Pressure Sensors Industry faces several challenges. The initial cost of implementation for fiber optic systems can be higher compared to conventional pressure sensors, posing a barrier to widespread adoption in price-sensitive markets. The need for specialized expertise for installation and maintenance can also be a limiting factor. Furthermore, the development of standardized interoperability protocols across different manufacturers is still evolving, potentially hindering seamless integration into existing systems. Intense competition from established traditional sensor manufacturers also presents a challenge, requiring continuous innovation and competitive pricing strategies.
Emerging Opportunities in Fiber Optic Pressure Sensors Industry
Emerging opportunities within the Fiber Optic Pressure Sensors Industry are abundant and span technological advancements and new market applications. The growing demand for smart cities and intelligent infrastructure presents a significant avenue for growth, with applications in structural health monitoring of bridges and buildings. The expansion of renewable energy sectors, such as wind and solar farms, requires robust pressure sensing for performance optimization and safety. Advancements in materials science are enabling the development of even more durable and sensitive fiber optic sensors capable of withstanding extreme temperatures and corrosive environments. The increasing trend towards miniaturization is also opening doors for novel applications in consumer electronics and wearable technology, where compact and reliable pressure sensing is becoming increasingly important.
Leading Players in the Fiber Optic Pressure Sensors Industry Market
- Honeywell International Inc.
- Opsens Inc.
- STMicroelectronics Inc.
- Althen Sensors & Controls
- FISO Technologies Inc.
- NXP Semiconductors
- Omron Corporation
- Robert Bosch GmbH
- Infineon Technologies Inc.
- Panasonic Corporation
Key Developments in Fiber Optic Pressure Sensors Industry Industry
- 2023/08: Honeywell International Inc. launched a new series of compact fiber optic pressure sensors for industrial automation, enhancing system efficiency and safety.
- 2023/05: Opsens Inc. secured a significant contract to supply fiber optic pressure sensors for a major offshore oil and gas project, highlighting the segment's growth.
- 2022/11: FISO Technologies Inc. introduced advanced Fabry-Perot pressure sensors with enhanced resolution for critical medical applications.
- 2022/07: STMicroelectronics Inc. announced advancements in MEMS-based fiber optic sensor integration, paving the way for smaller and more cost-effective solutions.
- 2021/12: Althen Sensors & Controls expanded its product portfolio with high-temperature fiber optic pressure sensors for petrochemical applications.
Strategic Outlook for Fiber Optic Pressure Sensors Industry Market
The strategic outlook for the Fiber Optic Pressure Sensors Industry remains highly positive, driven by an unabated demand for precision, reliability, and safety across diverse sectors. Key growth catalysts include the continued integration of IoT and AI, enabling smarter manufacturing and predictive maintenance. The expanding healthcare sector's need for advanced medical devices and minimally invasive technologies will further propel adoption. Furthermore, investments in infrastructure development and the growth of specialized industrial applications, such as aerospace and defense, present significant untapped potential. Companies focusing on technological innovation, particularly in FBG and Fabry-Perot technologies, along with strategic partnerships and market expansion into high-growth regions, are best positioned to capitalize on the future opportunities within this dynamic market.
Fiber Optic Pressure Sensors Industry Segmentation
-
1. Type
- 1.1. Wired
- 1.2. Wireless
-
2. Technology
- 2.1. Fabry-Perot
- 2.2. Fiber Bragg Grating
- 2.3. Intensity-based
- 2.4. Other Technologies
-
3. Application
- 3.1. Automotive
- 3.2. Consumer Electronics
- 3.3. Healthcare
- 3.4. Industrial
- 3.5. Oil and Gas
- 3.6. Petrochemical
- 3.7. Other Applications
Fiber Optic Pressure Sensors Industry Segmentation By Geography
-
1. North America
- 1.1. United States
- 1.2. Canada
-
2. Europe
- 2.1. United Kingdom
- 2.2. Germany
- 2.3. France
- 2.4. Russia
- 2.5. Rest of Europe
-
3. Asia Pacific
- 3.1. China
- 3.2. India
- 3.3. Japan
- 3.4. Rest of Asia Pacific
-
4. Rest of the World
- 4.1. Latin America
- 4.2. Middle East
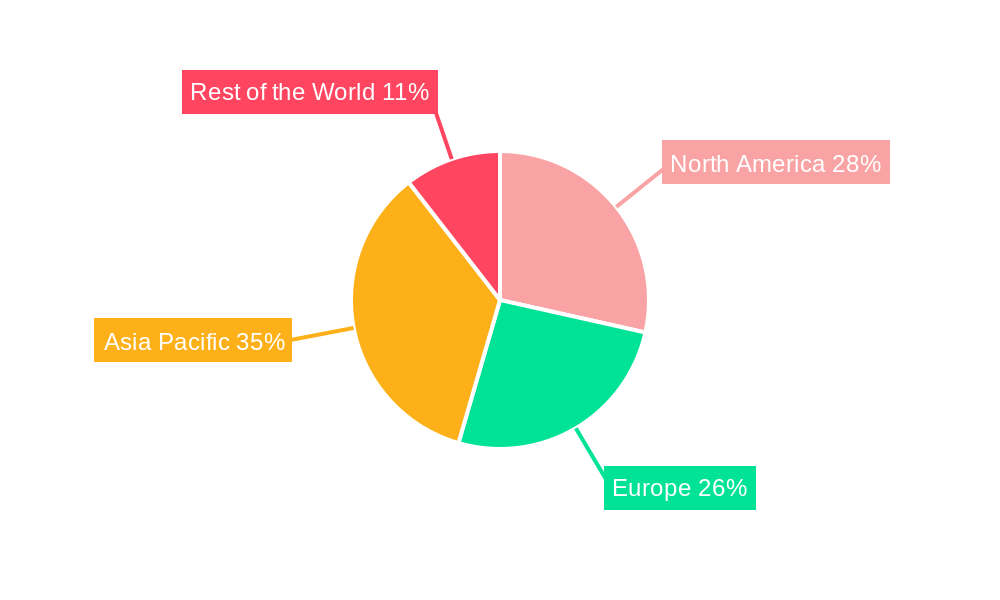
Fiber Optic Pressure Sensors Industry Regional Market Share
Geographic Coverage of Fiber Optic Pressure Sensors Industry
Fiber Optic Pressure Sensors Industry REPORT HIGHLIGHTS
| Aspects | Details |
|---|---|
| Study Period | 2020-2034 |
| Base Year | 2025 |
| Estimated Year | 2026 |
| Forecast Period | 2026-2034 |
| Historical Period | 2020-2025 |
| Growth Rate | CAGR of 11.5% from 2020-2034 |
| Segmentation |
|
Table of Contents
- 1. Introduction
- 1.1. Research Scope
- 1.2. Market Segmentation
- 1.3. Research Objective
- 1.4. Definitions and Assumptions
- 2. Executive Summary
- 2.1. Market Snapshot
- 3. Market Dynamics
- 3.1. Market Drivers
- 3.2. Market Restrains
- 3.3. Market Trends
- 3.4. Market Opportunities
- 4. Market Factor Analysis
- 4.1. Porters Five Forces
- 4.1.1. Bargaining Power of Suppliers
- 4.1.2. Bargaining Power of Buyers
- 4.1.3. Threat of New Entrants
- 4.1.4. Threat of Substitutes
- 4.1.5. Competitive Rivalry
- 4.2. PESTEL analysis
- 4.3. BCG Analysis
- 4.3.1. Stars (High Growth, High Market Share)
- 4.3.2. Cash Cows (Low Growth, High Market Share)
- 4.3.3. Question Mark (High Growth, Low Market Share)
- 4.3.4. Dogs (Low Growth, Low Market Share)
- 4.4. Ansoff Matrix Analysis
- 4.5. Supply Chain Analysis
- 4.6. Regulatory Landscape
- 4.7. Current Market Potential and Opportunity Assessment (TAM–SAM–SOM Framework)
- 4.8. RAX Analyst Note
- 4.1. Porters Five Forces
- 5. Market Analysis, Insights and Forecast 2021-2033
- 5.1. Market Analysis, Insights and Forecast - by Type
- 5.1.1. Wired
- 5.1.2. Wireless
- 5.2. Market Analysis, Insights and Forecast - by Technology
- 5.2.1. Fabry-Perot
- 5.2.2. Fiber Bragg Grating
- 5.2.3. Intensity-based
- 5.2.4. Other Technologies
- 5.3. Market Analysis, Insights and Forecast - by Application
- 5.3.1. Automotive
- 5.3.2. Consumer Electronics
- 5.3.3. Healthcare
- 5.3.4. Industrial
- 5.3.5. Oil and Gas
- 5.3.6. Petrochemical
- 5.3.7. Other Applications
- 5.4. Market Analysis, Insights and Forecast - by Region
- 5.4.1. North America
- 5.4.2. Europe
- 5.4.3. Asia Pacific
- 5.4.4. Rest of the World
- 5.1. Market Analysis, Insights and Forecast - by Type
- 6. Global Fiber Optic Pressure Sensors Industry Analysis, Insights and Forecast, 2021-2033
- 6.1. Market Analysis, Insights and Forecast - by Type
- 6.1.1. Wired
- 6.1.2. Wireless
- 6.2. Market Analysis, Insights and Forecast - by Technology
- 6.2.1. Fabry-Perot
- 6.2.2. Fiber Bragg Grating
- 6.2.3. Intensity-based
- 6.2.4. Other Technologies
- 6.3. Market Analysis, Insights and Forecast - by Application
- 6.3.1. Automotive
- 6.3.2. Consumer Electronics
- 6.3.3. Healthcare
- 6.3.4. Industrial
- 6.3.5. Oil and Gas
- 6.3.6. Petrochemical
- 6.3.7. Other Applications
- 6.1. Market Analysis, Insights and Forecast - by Type
- 7. North America Fiber Optic Pressure Sensors Industry Analysis, Insights and Forecast, 2020-2032
- 7.1. Market Analysis, Insights and Forecast - by Type
- 7.1.1. Wired
- 7.1.2. Wireless
- 7.2. Market Analysis, Insights and Forecast - by Technology
- 7.2.1. Fabry-Perot
- 7.2.2. Fiber Bragg Grating
- 7.2.3. Intensity-based
- 7.2.4. Other Technologies
- 7.3. Market Analysis, Insights and Forecast - by Application
- 7.3.1. Automotive
- 7.3.2. Consumer Electronics
- 7.3.3. Healthcare
- 7.3.4. Industrial
- 7.3.5. Oil and Gas
- 7.3.6. Petrochemical
- 7.3.7. Other Applications
- 7.1. Market Analysis, Insights and Forecast - by Type
- 8. Europe Fiber Optic Pressure Sensors Industry Analysis, Insights and Forecast, 2020-2032
- 8.1. Market Analysis, Insights and Forecast - by Type
- 8.1.1. Wired
- 8.1.2. Wireless
- 8.2. Market Analysis, Insights and Forecast - by Technology
- 8.2.1. Fabry-Perot
- 8.2.2. Fiber Bragg Grating
- 8.2.3. Intensity-based
- 8.2.4. Other Technologies
- 8.3. Market Analysis, Insights and Forecast - by Application
- 8.3.1. Automotive
- 8.3.2. Consumer Electronics
- 8.3.3. Healthcare
- 8.3.4. Industrial
- 8.3.5. Oil and Gas
- 8.3.6. Petrochemical
- 8.3.7. Other Applications
- 8.1. Market Analysis, Insights and Forecast - by Type
- 9. Asia Pacific Fiber Optic Pressure Sensors Industry Analysis, Insights and Forecast, 2020-2032
- 9.1. Market Analysis, Insights and Forecast - by Type
- 9.1.1. Wired
- 9.1.2. Wireless
- 9.2. Market Analysis, Insights and Forecast - by Technology
- 9.2.1. Fabry-Perot
- 9.2.2. Fiber Bragg Grating
- 9.2.3. Intensity-based
- 9.2.4. Other Technologies
- 9.3. Market Analysis, Insights and Forecast - by Application
- 9.3.1. Automotive
- 9.3.2. Consumer Electronics
- 9.3.3. Healthcare
- 9.3.4. Industrial
- 9.3.5. Oil and Gas
- 9.3.6. Petrochemical
- 9.3.7. Other Applications
- 9.1. Market Analysis, Insights and Forecast - by Type
- 10. Rest of the World Fiber Optic Pressure Sensors Industry Analysis, Insights and Forecast, 2020-2032
- 10.1. Market Analysis, Insights and Forecast - by Type
- 10.1.1. Wired
- 10.1.2. Wireless
- 10.2. Market Analysis, Insights and Forecast - by Technology
- 10.2.1. Fabry-Perot
- 10.2.2. Fiber Bragg Grating
- 10.2.3. Intensity-based
- 10.2.4. Other Technologies
- 10.3. Market Analysis, Insights and Forecast - by Application
- 10.3.1. Automotive
- 10.3.2. Consumer Electronics
- 10.3.3. Healthcare
- 10.3.4. Industrial
- 10.3.5. Oil and Gas
- 10.3.6. Petrochemical
- 10.3.7. Other Applications
- 10.1. Market Analysis, Insights and Forecast - by Type
- 11. Competitive Analysis
- 11.1. Company Profiles
- 11.1.1 Honeywell International Inc
- 11.1.1.1. Company Overview
- 11.1.1.2. Products
- 11.1.1.3. Company Financials
- 11.1.1.4. SWOT Analysis
- 11.1.2 Opsens Inc
- 11.1.2.1. Company Overview
- 11.1.2.2. Products
- 11.1.2.3. Company Financials
- 11.1.2.4. SWOT Analysis
- 11.1.3 STMicroelectronics Inc
- 11.1.3.1. Company Overview
- 11.1.3.2. Products
- 11.1.3.3. Company Financials
- 11.1.3.4. SWOT Analysis
- 11.1.4 Althen Sensors & Controls
- 11.1.4.1. Company Overview
- 11.1.4.2. Products
- 11.1.4.3. Company Financials
- 11.1.4.4. SWOT Analysis
- 11.1.5 FISO Technologies Inc
- 11.1.5.1. Company Overview
- 11.1.5.2. Products
- 11.1.5.3. Company Financials
- 11.1.5.4. SWOT Analysis
- 11.1.6 NXP Semiconductors
- 11.1.6.1. Company Overview
- 11.1.6.2. Products
- 11.1.6.3. Company Financials
- 11.1.6.4. SWOT Analysis
- 11.1.7 Omron Corporation
- 11.1.7.1. Company Overview
- 11.1.7.2. Products
- 11.1.7.3. Company Financials
- 11.1.7.4. SWOT Analysis
- 11.1.8 Robert Bosch GmbH
- 11.1.8.1. Company Overview
- 11.1.8.2. Products
- 11.1.8.3. Company Financials
- 11.1.8.4. SWOT Analysis
- 11.1.9 Infineon Technologies Inc
- 11.1.9.1. Company Overview
- 11.1.9.2. Products
- 11.1.9.3. Company Financials
- 11.1.9.4. SWOT Analysis
- 11.1.10 Panasonic Corporation
- 11.1.10.1. Company Overview
- 11.1.10.2. Products
- 11.1.10.3. Company Financials
- 11.1.10.4. SWOT Analysis
- 11.1.1 Honeywell International Inc
- 11.2. Market Entropy
- 11.2.1 Company's Key Areas Served
- 11.2.2 Recent Developments
- 11.3. Company Market Share Analysis 2025
- 11.3.1 Top 5 Companies Market Share Analysis
- 11.3.2 Top 3 Companies Market Share Analysis
- 11.4. List of Potential Customers
- 12. Research Methodology
List of Figures
- Figure 1: Global Fiber Optic Pressure Sensors Industry Revenue Breakdown (billion, %) by Region 2025 & 2033
- Figure 2: Global Fiber Optic Pressure Sensors Industry Volume Breakdown (K Unit, %) by Region 2025 & 2033
- Figure 3: North America Fiber Optic Pressure Sensors Industry Revenue (billion), by Type 2025 & 2033
- Figure 4: North America Fiber Optic Pressure Sensors Industry Volume (K Unit), by Type 2025 & 2033
- Figure 5: North America Fiber Optic Pressure Sensors Industry Revenue Share (%), by Type 2025 & 2033
- Figure 6: North America Fiber Optic Pressure Sensors Industry Volume Share (%), by Type 2025 & 2033
- Figure 7: North America Fiber Optic Pressure Sensors Industry Revenue (billion), by Technology 2025 & 2033
- Figure 8: North America Fiber Optic Pressure Sensors Industry Volume (K Unit), by Technology 2025 & 2033
- Figure 9: North America Fiber Optic Pressure Sensors Industry Revenue Share (%), by Technology 2025 & 2033
- Figure 10: North America Fiber Optic Pressure Sensors Industry Volume Share (%), by Technology 2025 & 2033
- Figure 11: North America Fiber Optic Pressure Sensors Industry Revenue (billion), by Application 2025 & 2033
- Figure 12: North America Fiber Optic Pressure Sensors Industry Volume (K Unit), by Application 2025 & 2033
- Figure 13: North America Fiber Optic Pressure Sensors Industry Revenue Share (%), by Application 2025 & 2033
- Figure 14: North America Fiber Optic Pressure Sensors Industry Volume Share (%), by Application 2025 & 2033
- Figure 15: North America Fiber Optic Pressure Sensors Industry Revenue (billion), by Country 2025 & 2033
- Figure 16: North America Fiber Optic Pressure Sensors Industry Volume (K Unit), by Country 2025 & 2033
- Figure 17: North America Fiber Optic Pressure Sensors Industry Revenue Share (%), by Country 2025 & 2033
- Figure 18: North America Fiber Optic Pressure Sensors Industry Volume Share (%), by Country 2025 & 2033
- Figure 19: Europe Fiber Optic Pressure Sensors Industry Revenue (billion), by Type 2025 & 2033
- Figure 20: Europe Fiber Optic Pressure Sensors Industry Volume (K Unit), by Type 2025 & 2033
- Figure 21: Europe Fiber Optic Pressure Sensors Industry Revenue Share (%), by Type 2025 & 2033
- Figure 22: Europe Fiber Optic Pressure Sensors Industry Volume Share (%), by Type 2025 & 2033
- Figure 23: Europe Fiber Optic Pressure Sensors Industry Revenue (billion), by Technology 2025 & 2033
- Figure 24: Europe Fiber Optic Pressure Sensors Industry Volume (K Unit), by Technology 2025 & 2033
- Figure 25: Europe Fiber Optic Pressure Sensors Industry Revenue Share (%), by Technology 2025 & 2033
- Figure 26: Europe Fiber Optic Pressure Sensors Industry Volume Share (%), by Technology 2025 & 2033
- Figure 27: Europe Fiber Optic Pressure Sensors Industry Revenue (billion), by Application 2025 & 2033
- Figure 28: Europe Fiber Optic Pressure Sensors Industry Volume (K Unit), by Application 2025 & 2033
- Figure 29: Europe Fiber Optic Pressure Sensors Industry Revenue Share (%), by Application 2025 & 2033
- Figure 30: Europe Fiber Optic Pressure Sensors Industry Volume Share (%), by Application 2025 & 2033
- Figure 31: Europe Fiber Optic Pressure Sensors Industry Revenue (billion), by Country 2025 & 2033
- Figure 32: Europe Fiber Optic Pressure Sensors Industry Volume (K Unit), by Country 2025 & 2033
- Figure 33: Europe Fiber Optic Pressure Sensors Industry Revenue Share (%), by Country 2025 & 2033
- Figure 34: Europe Fiber Optic Pressure Sensors Industry Volume Share (%), by Country 2025 & 2033
- Figure 35: Asia Pacific Fiber Optic Pressure Sensors Industry Revenue (billion), by Type 2025 & 2033
- Figure 36: Asia Pacific Fiber Optic Pressure Sensors Industry Volume (K Unit), by Type 2025 & 2033
- Figure 37: Asia Pacific Fiber Optic Pressure Sensors Industry Revenue Share (%), by Type 2025 & 2033
- Figure 38: Asia Pacific Fiber Optic Pressure Sensors Industry Volume Share (%), by Type 2025 & 2033
- Figure 39: Asia Pacific Fiber Optic Pressure Sensors Industry Revenue (billion), by Technology 2025 & 2033
- Figure 40: Asia Pacific Fiber Optic Pressure Sensors Industry Volume (K Unit), by Technology 2025 & 2033
- Figure 41: Asia Pacific Fiber Optic Pressure Sensors Industry Revenue Share (%), by Technology 2025 & 2033
- Figure 42: Asia Pacific Fiber Optic Pressure Sensors Industry Volume Share (%), by Technology 2025 & 2033
- Figure 43: Asia Pacific Fiber Optic Pressure Sensors Industry Revenue (billion), by Application 2025 & 2033
- Figure 44: Asia Pacific Fiber Optic Pressure Sensors Industry Volume (K Unit), by Application 2025 & 2033
- Figure 45: Asia Pacific Fiber Optic Pressure Sensors Industry Revenue Share (%), by Application 2025 & 2033
- Figure 46: Asia Pacific Fiber Optic Pressure Sensors Industry Volume Share (%), by Application 2025 & 2033
- Figure 47: Asia Pacific Fiber Optic Pressure Sensors Industry Revenue (billion), by Country 2025 & 2033
- Figure 48: Asia Pacific Fiber Optic Pressure Sensors Industry Volume (K Unit), by Country 2025 & 2033
- Figure 49: Asia Pacific Fiber Optic Pressure Sensors Industry Revenue Share (%), by Country 2025 & 2033
- Figure 50: Asia Pacific Fiber Optic Pressure Sensors Industry Volume Share (%), by Country 2025 & 2033
- Figure 51: Rest of the World Fiber Optic Pressure Sensors Industry Revenue (billion), by Type 2025 & 2033
- Figure 52: Rest of the World Fiber Optic Pressure Sensors Industry Volume (K Unit), by Type 2025 & 2033
- Figure 53: Rest of the World Fiber Optic Pressure Sensors Industry Revenue Share (%), by Type 2025 & 2033
- Figure 54: Rest of the World Fiber Optic Pressure Sensors Industry Volume Share (%), by Type 2025 & 2033
- Figure 55: Rest of the World Fiber Optic Pressure Sensors Industry Revenue (billion), by Technology 2025 & 2033
- Figure 56: Rest of the World Fiber Optic Pressure Sensors Industry Volume (K Unit), by Technology 2025 & 2033
- Figure 57: Rest of the World Fiber Optic Pressure Sensors Industry Revenue Share (%), by Technology 2025 & 2033
- Figure 58: Rest of the World Fiber Optic Pressure Sensors Industry Volume Share (%), by Technology 2025 & 2033
- Figure 59: Rest of the World Fiber Optic Pressure Sensors Industry Revenue (billion), by Application 2025 & 2033
- Figure 60: Rest of the World Fiber Optic Pressure Sensors Industry Volume (K Unit), by Application 2025 & 2033
- Figure 61: Rest of the World Fiber Optic Pressure Sensors Industry Revenue Share (%), by Application 2025 & 2033
- Figure 62: Rest of the World Fiber Optic Pressure Sensors Industry Volume Share (%), by Application 2025 & 2033
- Figure 63: Rest of the World Fiber Optic Pressure Sensors Industry Revenue (billion), by Country 2025 & 2033
- Figure 64: Rest of the World Fiber Optic Pressure Sensors Industry Volume (K Unit), by Country 2025 & 2033
- Figure 65: Rest of the World Fiber Optic Pressure Sensors Industry Revenue Share (%), by Country 2025 & 2033
- Figure 66: Rest of the World Fiber Optic Pressure Sensors Industry Volume Share (%), by Country 2025 & 2033
List of Tables
- Table 1: Global Fiber Optic Pressure Sensors Industry Revenue billion Forecast, by Type 2020 & 2033
- Table 2: Global Fiber Optic Pressure Sensors Industry Volume K Unit Forecast, by Type 2020 & 2033
- Table 3: Global Fiber Optic Pressure Sensors Industry Revenue billion Forecast, by Technology 2020 & 2033
- Table 4: Global Fiber Optic Pressure Sensors Industry Volume K Unit Forecast, by Technology 2020 & 2033
- Table 5: Global Fiber Optic Pressure Sensors Industry Revenue billion Forecast, by Application 2020 & 2033
- Table 6: Global Fiber Optic Pressure Sensors Industry Volume K Unit Forecast, by Application 2020 & 2033
- Table 7: Global Fiber Optic Pressure Sensors Industry Revenue billion Forecast, by Region 2020 & 2033
- Table 8: Global Fiber Optic Pressure Sensors Industry Volume K Unit Forecast, by Region 2020 & 2033
- Table 9: Global Fiber Optic Pressure Sensors Industry Revenue billion Forecast, by Type 2020 & 2033
- Table 10: Global Fiber Optic Pressure Sensors Industry Volume K Unit Forecast, by Type 2020 & 2033
- Table 11: Global Fiber Optic Pressure Sensors Industry Revenue billion Forecast, by Technology 2020 & 2033
- Table 12: Global Fiber Optic Pressure Sensors Industry Volume K Unit Forecast, by Technology 2020 & 2033
- Table 13: Global Fiber Optic Pressure Sensors Industry Revenue billion Forecast, by Application 2020 & 2033
- Table 14: Global Fiber Optic Pressure Sensors Industry Volume K Unit Forecast, by Application 2020 & 2033
- Table 15: Global Fiber Optic Pressure Sensors Industry Revenue billion Forecast, by Country 2020 & 2033
- Table 16: Global Fiber Optic Pressure Sensors Industry Volume K Unit Forecast, by Country 2020 & 2033
- Table 17: United States Fiber Optic Pressure Sensors Industry Revenue (billion) Forecast, by Application 2020 & 2033
- Table 18: United States Fiber Optic Pressure Sensors Industry Volume (K Unit) Forecast, by Application 2020 & 2033
- Table 19: Canada Fiber Optic Pressure Sensors Industry Revenue (billion) Forecast, by Application 2020 & 2033
- Table 20: Canada Fiber Optic Pressure Sensors Industry Volume (K Unit) Forecast, by Application 2020 & 2033
- Table 21: Global Fiber Optic Pressure Sensors Industry Revenue billion Forecast, by Type 2020 & 2033
- Table 22: Global Fiber Optic Pressure Sensors Industry Volume K Unit Forecast, by Type 2020 & 2033
- Table 23: Global Fiber Optic Pressure Sensors Industry Revenue billion Forecast, by Technology 2020 & 2033
- Table 24: Global Fiber Optic Pressure Sensors Industry Volume K Unit Forecast, by Technology 2020 & 2033
- Table 25: Global Fiber Optic Pressure Sensors Industry Revenue billion Forecast, by Application 2020 & 2033
- Table 26: Global Fiber Optic Pressure Sensors Industry Volume K Unit Forecast, by Application 2020 & 2033
- Table 27: Global Fiber Optic Pressure Sensors Industry Revenue billion Forecast, by Country 2020 & 2033
- Table 28: Global Fiber Optic Pressure Sensors Industry Volume K Unit Forecast, by Country 2020 & 2033
- Table 29: United Kingdom Fiber Optic Pressure Sensors Industry Revenue (billion) Forecast, by Application 2020 & 2033
- Table 30: United Kingdom Fiber Optic Pressure Sensors Industry Volume (K Unit) Forecast, by Application 2020 & 2033
- Table 31: Germany Fiber Optic Pressure Sensors Industry Revenue (billion) Forecast, by Application 2020 & 2033
- Table 32: Germany Fiber Optic Pressure Sensors Industry Volume (K Unit) Forecast, by Application 2020 & 2033
- Table 33: France Fiber Optic Pressure Sensors Industry Revenue (billion) Forecast, by Application 2020 & 2033
- Table 34: France Fiber Optic Pressure Sensors Industry Volume (K Unit) Forecast, by Application 2020 & 2033
- Table 35: Russia Fiber Optic Pressure Sensors Industry Revenue (billion) Forecast, by Application 2020 & 2033
- Table 36: Russia Fiber Optic Pressure Sensors Industry Volume (K Unit) Forecast, by Application 2020 & 2033
- Table 37: Rest of Europe Fiber Optic Pressure Sensors Industry Revenue (billion) Forecast, by Application 2020 & 2033
- Table 38: Rest of Europe Fiber Optic Pressure Sensors Industry Volume (K Unit) Forecast, by Application 2020 & 2033
- Table 39: Global Fiber Optic Pressure Sensors Industry Revenue billion Forecast, by Type 2020 & 2033
- Table 40: Global Fiber Optic Pressure Sensors Industry Volume K Unit Forecast, by Type 2020 & 2033
- Table 41: Global Fiber Optic Pressure Sensors Industry Revenue billion Forecast, by Technology 2020 & 2033
- Table 42: Global Fiber Optic Pressure Sensors Industry Volume K Unit Forecast, by Technology 2020 & 2033
- Table 43: Global Fiber Optic Pressure Sensors Industry Revenue billion Forecast, by Application 2020 & 2033
- Table 44: Global Fiber Optic Pressure Sensors Industry Volume K Unit Forecast, by Application 2020 & 2033
- Table 45: Global Fiber Optic Pressure Sensors Industry Revenue billion Forecast, by Country 2020 & 2033
- Table 46: Global Fiber Optic Pressure Sensors Industry Volume K Unit Forecast, by Country 2020 & 2033
- Table 47: China Fiber Optic Pressure Sensors Industry Revenue (billion) Forecast, by Application 2020 & 2033
- Table 48: China Fiber Optic Pressure Sensors Industry Volume (K Unit) Forecast, by Application 2020 & 2033
- Table 49: India Fiber Optic Pressure Sensors Industry Revenue (billion) Forecast, by Application 2020 & 2033
- Table 50: India Fiber Optic Pressure Sensors Industry Volume (K Unit) Forecast, by Application 2020 & 2033
- Table 51: Japan Fiber Optic Pressure Sensors Industry Revenue (billion) Forecast, by Application 2020 & 2033
- Table 52: Japan Fiber Optic Pressure Sensors Industry Volume (K Unit) Forecast, by Application 2020 & 2033
- Table 53: Rest of Asia Pacific Fiber Optic Pressure Sensors Industry Revenue (billion) Forecast, by Application 2020 & 2033
- Table 54: Rest of Asia Pacific Fiber Optic Pressure Sensors Industry Volume (K Unit) Forecast, by Application 2020 & 2033
- Table 55: Global Fiber Optic Pressure Sensors Industry Revenue billion Forecast, by Type 2020 & 2033
- Table 56: Global Fiber Optic Pressure Sensors Industry Volume K Unit Forecast, by Type 2020 & 2033
- Table 57: Global Fiber Optic Pressure Sensors Industry Revenue billion Forecast, by Technology 2020 & 2033
- Table 58: Global Fiber Optic Pressure Sensors Industry Volume K Unit Forecast, by Technology 2020 & 2033
- Table 59: Global Fiber Optic Pressure Sensors Industry Revenue billion Forecast, by Application 2020 & 2033
- Table 60: Global Fiber Optic Pressure Sensors Industry Volume K Unit Forecast, by Application 2020 & 2033
- Table 61: Global Fiber Optic Pressure Sensors Industry Revenue billion Forecast, by Country 2020 & 2033
- Table 62: Global Fiber Optic Pressure Sensors Industry Volume K Unit Forecast, by Country 2020 & 2033
- Table 63: Latin America Fiber Optic Pressure Sensors Industry Revenue (billion) Forecast, by Application 2020 & 2033
- Table 64: Latin America Fiber Optic Pressure Sensors Industry Volume (K Unit) Forecast, by Application 2020 & 2033
- Table 65: Middle East Fiber Optic Pressure Sensors Industry Revenue (billion) Forecast, by Application 2020 & 2033
- Table 66: Middle East Fiber Optic Pressure Sensors Industry Volume (K Unit) Forecast, by Application 2020 & 2033
Frequently Asked Questions
1. What is the projected Compound Annual Growth Rate (CAGR) of the Fiber Optic Pressure Sensors Industry?
The projected CAGR is approximately 11.5%.
2. Which companies are prominent players in the Fiber Optic Pressure Sensors Industry?
Key companies in the market include Honeywell International Inc, Opsens Inc, STMicroelectronics Inc, Althen Sensors & Controls, FISO Technologies Inc, NXP Semiconductors, Omron Corporation, Robert Bosch GmbH, Infineon Technologies Inc, Panasonic Corporation.
3. What are the main segments of the Fiber Optic Pressure Sensors Industry?
The market segments include Type, Technology, Application.
4. Can you provide details about the market size?
The market size is estimated to be USD 1.7 billion as of 2022.
5. What are some drivers contributing to market growth?
; Rapid Technological Advancements; Easy Deployment with High Stability.
6. What are the notable trends driving market growth?
Oil and Gas Expected to Drive the Market Growth.
7. Are there any restraints impacting market growth?
; High Cost of Product in Biomedical Applications.
8. Can you provide examples of recent developments in the market?
N/A
9. What pricing options are available for accessing the report?
Pricing options include single-user, multi-user, and enterprise licenses priced at USD 4750, USD 5250, and USD 8750 respectively.
10. Is the market size provided in terms of value or volume?
The market size is provided in terms of value, measured in billion and volume, measured in K Unit.
11. Are there any specific market keywords associated with the report?
Yes, the market keyword associated with the report is "Fiber Optic Pressure Sensors Industry," which aids in identifying and referencing the specific market segment covered.
12. How do I determine which pricing option suits my needs best?
The pricing options vary based on user requirements and access needs. Individual users may opt for single-user licenses, while businesses requiring broader access may choose multi-user or enterprise licenses for cost-effective access to the report.
13. Are there any additional resources or data provided in the Fiber Optic Pressure Sensors Industry report?
While the report offers comprehensive insights, it's advisable to review the specific contents or supplementary materials provided to ascertain if additional resources or data are available.
14. How can I stay updated on further developments or reports in the Fiber Optic Pressure Sensors Industry?
To stay informed about further developments, trends, and reports in the Fiber Optic Pressure Sensors Industry, consider subscribing to industry newsletters, following relevant companies and organizations, or regularly checking reputable industry news sources and publications.
Methodology
Step 1 - Identification of Relevant Samples Size from Population Database


Step 2 - Approaches for Defining Global Market Size (Value, Volume* & Price*)

Note*: In applicable scenarios
Step 3 - Data Sources
Primary Research
- Web Analytics
- Survey Reports
- Research Institute
- Latest Research Reports
- Opinion Leaders
Secondary Research
- Annual Reports
- White Paper
- Latest Press Release
- Industry Association
- Paid Database
- Investor Presentations

Step 4 - Data Triangulation
Involves using different sources of information in order to increase the validity of a study
These sources are likely to be stakeholders in a program - participants, other researchers, program staff, other community members, and so on.
Then we put all data in single framework & apply various statistical tools to find out the dynamic on the market.
During the analysis stage, feedback from the stakeholder groups would be compared to determine areas of agreement as well as areas of divergence