Key Insights
The global Field Erected Cooling Towers market is projected for substantial growth, driven by escalating demand across vital industrial sectors including power generation, petrochemicals, and oil & gas. With a projected Compound Annual Growth Rate (CAGR) of 5.65% from 2025 to 2033, the market size, currently valued at 2.93 billion, is set for significant expansion. This growth is underpinned by the critical need for efficient thermal management in these industries, exacerbated by aging infrastructure and new industrial developments. Increasing emphasis on energy efficiency and stringent environmental regulations further compel industrial investment in advanced cooling solutions, stimulating market growth. The market is segmented by type into Wet, Dry, and Hybrid cooling towers, with Wet towers leading due to their economic viability and superior thermal performance. Design variations, including Natural, Induced, and Forced draft, cater to diverse operational requirements.
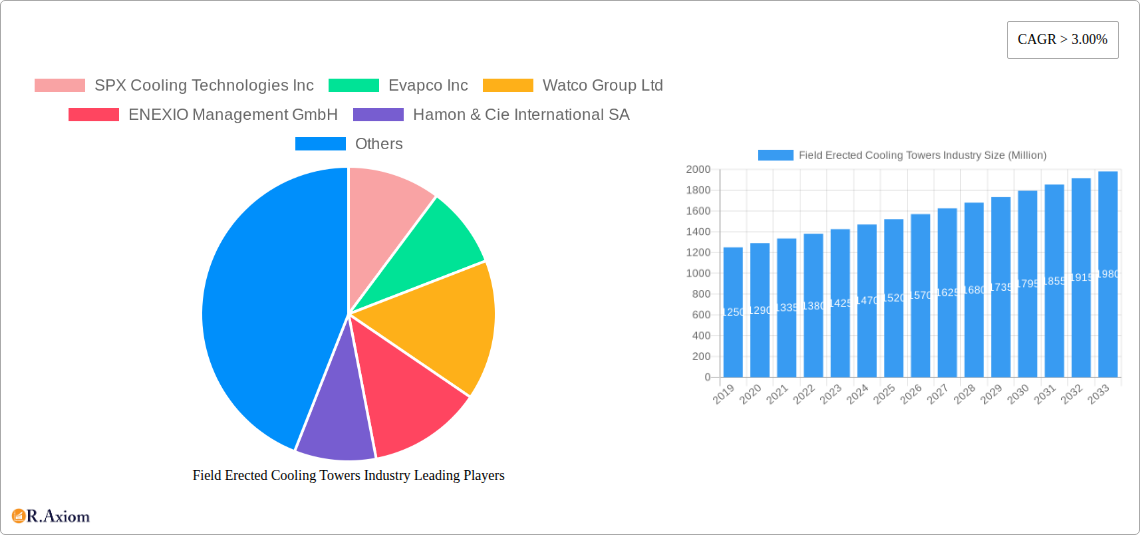
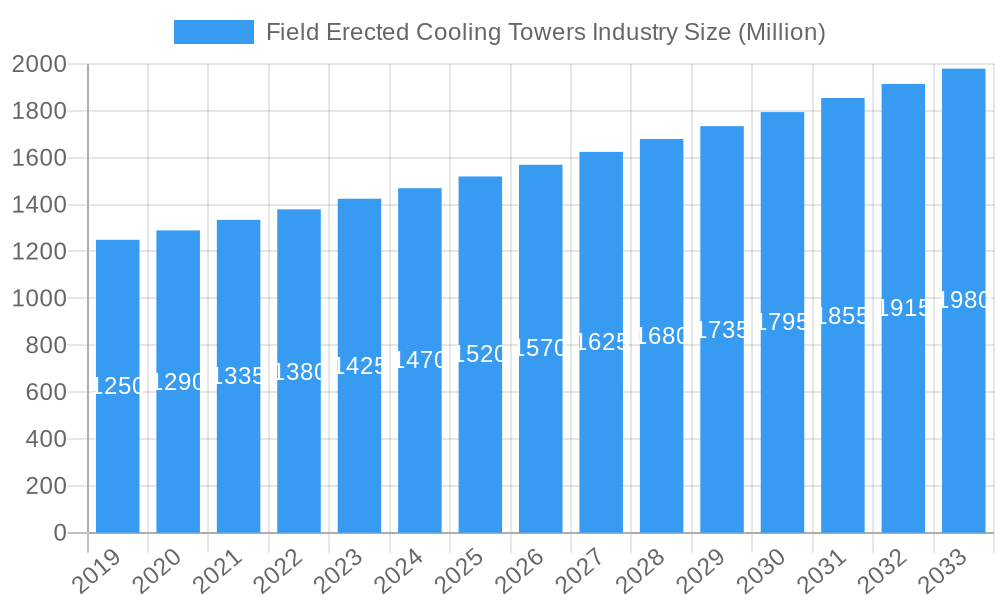
Field Erected Cooling Towers Industry Market Size (In Billion)
Key market drivers include expanding industrial capacities, a rising demand for water conservation through efficient cooling technologies, and the increasing adoption of advanced materials for enhanced tower durability and performance. Emerging trends such as the integration of smart technologies for predictive maintenance and operational optimization, alongside a shift towards sustainable and environmentally responsible cooling solutions, are defining the market's direction. However, significant initial investment costs and strict regulations concerning water discharge present potential challenges. Geographically, North America and Europe remain established markets, while the Asia Pacific region, fueled by rapid industrialization and a growing energy sector, is anticipated to experience the most robust growth. Prominent players like SPX Cooling Technologies Inc., Evapco Inc., and ENEXIO Management GmbH are leading innovation and market expansion to address evolving industry demands.
Field Erected Cooling Towers Industry Company Market Share
Field Erected Cooling Towers Industry Report Description
Unlock critical insights into the global Field Erected Cooling Towers market with this comprehensive industry analysis. Covering the period 2019–2033, this report provides an in-depth examination of market dynamics, growth drivers, competitive landscapes, and future opportunities. Essential for stakeholders in power generation, petrochemicals, oil & gas, and other industrial sectors seeking to understand and capitalize on the evolving cooling tower solutions market.
Field Erected Cooling Towers Industry Market Concentration & Innovation
The Field Erected Cooling Towers market exhibits moderate to high concentration, with key players dominating a significant portion of the global market share. Innovation remains a critical driver, fueled by the constant demand for enhanced energy efficiency, reduced water consumption, and improved thermal performance. Companies are investing heavily in research and development to create advanced cooling solutions. Regulatory frameworks, particularly concerning environmental standards and water usage, are increasingly influencing product development and market entry. The emergence of stringent emissions regulations and water scarcity concerns is pushing for the adoption of more sustainable cooling technologies. Product substitutes, such as air-cooled heat exchangers and hybrid systems, pose a growing challenge, forcing manufacturers to continuously innovate and differentiate their offerings. End-user trends indicate a growing preference for customized solutions tailored to specific industrial needs, alongside a focus on lifecycle cost reduction. Mergers and acquisitions (M&A) activities are prevalent, with a total M&A deal value estimated in the hundreds of millions, indicating consolidation and strategic expansion. For instance, the acquisition of Midwest Cooling Tower Services by Specialty Welding and Turnarounds, LLC (SWAT) in December 2021 signifies a trend towards integrated service offerings and market expansion within the industrial maintenance sector, valued at an estimated $50 Million. SPX Cooling Technologies Inc. and Evapco Inc. are consistently among the leaders in market share, often exceeding 15% each.
Field Erected Cooling Towers Industry Industry Trends & Insights
The Field Erected Cooling Towers industry is poised for significant growth, driven by the escalating demand for efficient thermal management across a wide spectrum of industrial applications. The global market is projected to witness a Compound Annual Growth Rate (CAGR) of approximately 5.5% from the base year 2025 through the forecast period ending 2033. This robust growth is primarily attributed to the continuous expansion of the power generation sector, the burgeoning petrochemical and oil & gas industries, and the increasing need for process cooling in manufacturing. Technological disruptions are playing a pivotal role, with a shift towards more sustainable and water-efficient cooling tower designs. Innovations such as advanced fill materials, optimized fan technologies, and smart monitoring systems are enhancing performance and reducing operational costs. Consumer preferences are leaning towards hybrid cooling towers that offer a balance between water and energy efficiency, especially in water-scarce regions. Furthermore, the growing emphasis on reducing the environmental footprint of industrial operations is compelling industries to invest in cutting-edge cooling solutions. Competitive dynamics are intensifying, with established players focusing on expanding their product portfolios and geographical reach, while new entrants are vying for market share through innovative offerings and competitive pricing. The market penetration of advanced cooling technologies is expected to rise as industries increasingly recognize the long-term economic and environmental benefits. The overall market size is estimated to reach $30 Billion by 2033.
Dominant Markets & Segments in Field Erected Cooling Towers Industry
The Power Generation sector remains the dominant end-user segment for Field Erected Cooling Towers, accounting for an estimated 40% of the global market share. This dominance is driven by the continuous need for efficient heat rejection in thermal power plants, including coal-fired, natural gas, and nuclear facilities. Economic policies promoting energy security and the expansion of power infrastructure globally are key drivers in this segment. The Petrochemicals and Oil & Gas industries are also significant contributors, representing approximately 25% and 20% of the market, respectively. These sectors require robust cooling solutions for refining processes, chemical manufacturing, and upstream operations. Infrastructure development and the demand for fossil fuels, despite the energy transition, continue to support the growth in these segments.
Within the Type segmentation, Wet Cooling Towers hold the largest market share, estimated at 65%, due to their high efficiency and cost-effectiveness in many applications. However, Hybrid Cooling Towers are experiencing rapid growth, projected to capture 20% of the market by 2033, driven by their ability to conserve water in arid regions and reduce thermal pollution. Dry Cooling Towers constitute the remaining 15%, primarily used in applications where water availability is a severe constraint.
In terms of Design, Induced Draft Cooling Towers dominate the market, accounting for approximately 55% of sales. Their inherent design advantages in airflow management and reduced recirculation make them a preferred choice for many industrial applications. Forced Draft Cooling Towers hold about 30% of the market, often favored for their compactness and ability to handle higher heat loads, while Natural Draft Cooling Towers, though requiring significant space, are still relevant in large-scale power plants, representing 15%.
Geographically, North America and Asia Pacific are the leading regions. North America, driven by its established industrial base and stringent environmental regulations, accounts for approximately 30% of the market. Asia Pacific, with its rapid industrialization and burgeoning energy demands, is the fastest-growing region, projected to reach 35% market share by 2033.
Field Erected Cooling Towers Industry Product Developments
Product development in the Field Erected Cooling Towers industry is increasingly focused on enhancing energy efficiency, minimizing water consumption, and extending operational lifespans. Manufacturers are introducing advanced fill media with improved heat transfer capabilities and reduced fouling. The integration of smart monitoring systems and IoT capabilities allows for real-time performance tracking, predictive maintenance, and optimized operational control. Innovations in fan technology, such as variable frequency drives and aerodynamic blade designs, contribute to significant energy savings. Furthermore, the development of hybrid cooling tower designs offers a compelling solution for industries facing water scarcity or strict environmental regulations. These advancements provide a competitive advantage by enabling lower operational costs and a reduced environmental impact for end-users.
Report Scope & Segmentation Analysis
This report meticulously analyzes the Field Erected Cooling Towers market across key segmentation dimensions. The Type segmentation includes Wet, Dry, and Hybrid cooling towers. Wet towers are projected to maintain a significant market share due to their established performance, while Hybrid towers are expected to witness substantial growth, driven by water conservation needs. The Design segmentation covers Natural, Induced, and Forced draft configurations. Induced draft designs are anticipated to lead due to their operational efficiency and space utilization. The End User segmentation delves into Power Generation, Petrochemicals, Oil & Gas, and Other End Users. Power Generation is expected to remain the largest segment, with Petrochemicals and Oil & Gas showing robust growth, while Other End Users, encompassing HVAC and manufacturing, represent a diversifying market. Each segment’s market size, growth projections, and competitive dynamics are thoroughly assessed.
Key Drivers of Field Erected Cooling Towers Industry Growth
The Field Erected Cooling Towers industry is propelled by several key growth drivers. Firstly, the global increase in industrialization and urbanization necessitates greater energy production, leading to higher demand for cooling solutions in power plants. Secondly, stringent environmental regulations mandating reduced water consumption and emissions are driving the adoption of water-efficient and low-emission cooling technologies, such as hybrid and advanced wet cooling towers. Thirdly, technological advancements in materials science, aerodynamics, and digital control systems are leading to the development of more efficient, reliable, and cost-effective cooling tower designs. For instance, the ongoing development of advanced fill materials with higher surface area to volume ratios directly impacts heat transfer efficiency. Finally, the growing demand for process cooling in sectors like petrochemicals, oil and gas, and pharmaceuticals further underpins market expansion.
Challenges in the Field Erected Cooling Towers Industry Sector
Despite robust growth, the Field Erected Cooling Towers industry faces several challenges. High initial capital investment for large-scale field-erected towers can be a significant barrier for some industries, particularly smaller enterprises or those in developing economies. Stringent environmental regulations, while driving innovation, also impose compliance costs and can lead to longer project approval timelines. Supply chain disruptions and fluctuations in raw material prices, such as steel and specialized plastics, can impact manufacturing costs and project delivery schedules. Furthermore, the increasing competition from alternative cooling technologies, like air-cooled heat exchangers, poses a continuous threat. For example, a prolonged period of high steel prices could increase the cost of fabrication by 10-15%, impacting project feasibility.
Emerging Opportunities in Field Erected Cooling Towers Industry
The Field Erected Cooling Towers industry is ripe with emerging opportunities. The transition towards renewable energy sources, such as concentrated solar power (CSP) and geothermal energy, is creating new avenues for cooling tower integration. Retrofitting and upgrading existing industrial facilities with more efficient and environmentally compliant cooling systems presents a substantial market. The development of smart cooling towers with advanced IoT capabilities for predictive maintenance and remote monitoring offers significant value-added services. Moreover, the growing demand for water-efficient cooling solutions in arid and semi-arid regions opens up opportunities for hybrid and dry cooling technologies. The increasing focus on circular economy principles is also driving innovation in water treatment and reuse within cooling tower systems.
Leading Players in the Field Erected Cooling Towers Industry Market
- SPX Cooling Technologies Inc.
- Evapco Inc.
- Watco Group Ltd
- ENEXIO Management GmbH
- Hamon & Cie International SA
- Towertech Cooling System Pvt Ltd
- Paharpur Cooling Towers Ltd
- Cyrco Inc.
- Babcock & Wilcox Enterprises Inc.
- Marley Flow Control Pty Ltd
Key Developments in Field Erected Cooling Towers Industry Industry
- February 2020: SPX Cooling Technologies Inc. launched its new Marley MH Element Fluid Cooler, an induced-draft, crossflow closed-circuit cooling tower suitable for heating, ventilation, air conditioning (HVAC), industrial, and process cooling applications, enhancing their product offering for diverse industrial needs.
- December 2021: Specialty Welding and Turnarounds, LLC (SWAT), a leading provider of highly technical maintenance services to the chemical, refinery, renewable, and industrial markets, announced the acquisition of Midwest Cooling Tower Services (MWCTS) from Dorilton Capital. Midwest provides critical cooling tower solutions, including inspection, maintenance and repair, specialty distribution, and rental across the United States, signaling market consolidation and expanded service capabilities.
Strategic Outlook for Field Erected Cooling Towers Industry Market
The strategic outlook for the Field Erected Cooling Towers market is highly positive, driven by ongoing industrial expansion and an increasing emphasis on sustainability. Growth catalysts include the continuous demand from the power generation, petrochemical, and oil & gas sectors, coupled with the imperative to comply with evolving environmental regulations concerning water and energy usage. Manufacturers focusing on the development and deployment of advanced hybrid and dry cooling technologies are well-positioned to capitalize on emerging opportunities. Furthermore, investments in smart cooling solutions and after-sales services, such as maintenance and upgrades, will be crucial for sustained competitive advantage. The market's future trajectory will be shaped by innovation, strategic partnerships, and the ability to adapt to the dynamic needs of a global industrial landscape striving for efficiency and environmental responsibility.
Field Erected Cooling Towers Industry Segmentation
-
1. Type
- 1.1. Wet
- 1.2. Dry
- 1.3. Hybrid
-
2. Design
- 2.1. Natural
- 2.2. Induced
- 2.3. Forced
-
3. End User
- 3.1. Power Generation
- 3.2. Petrochemicals
- 3.3. Oil & Gas
- 3.4. Other End Users
Field Erected Cooling Towers Industry Segmentation By Geography
- 1. North America
- 2. Europe
- 3. Asia Pacific
- 4. Middle East
- 5. South America
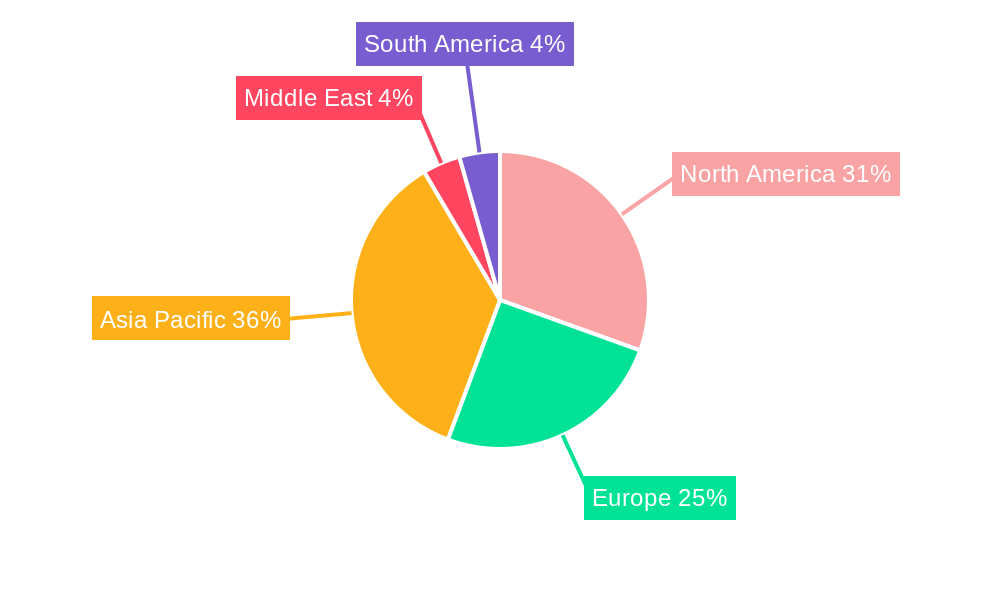
Field Erected Cooling Towers Industry Regional Market Share
Geographic Coverage of Field Erected Cooling Towers Industry
Field Erected Cooling Towers Industry REPORT HIGHLIGHTS
| Aspects | Details |
|---|---|
| Study Period | 2020-2034 |
| Base Year | 2025 |
| Estimated Year | 2026 |
| Forecast Period | 2026-2034 |
| Historical Period | 2020-2025 |
| Growth Rate | CAGR of 5.65% from 2020-2034 |
| Segmentation |
|
Table of Contents
- 1. Introduction
- 1.1. Research Scope
- 1.2. Market Segmentation
- 1.3. Research Objective
- 1.4. Definitions and Assumptions
- 2. Executive Summary
- 2.1. Market Snapshot
- 3. Market Dynamics
- 3.1. Market Drivers
- 3.2. Market Restrains
- 3.3. Market Trends
- 3.4. Market Opportunities
- 4. Market Factor Analysis
- 4.1. Porters Five Forces
- 4.1.1. Bargaining Power of Suppliers
- 4.1.2. Bargaining Power of Buyers
- 4.1.3. Threat of New Entrants
- 4.1.4. Threat of Substitutes
- 4.1.5. Competitive Rivalry
- 4.2. PESTEL analysis
- 4.3. BCG Analysis
- 4.3.1. Stars (High Growth, High Market Share)
- 4.3.2. Cash Cows (Low Growth, High Market Share)
- 4.3.3. Question Mark (High Growth, Low Market Share)
- 4.3.4. Dogs (Low Growth, Low Market Share)
- 4.4. Ansoff Matrix Analysis
- 4.5. Supply Chain Analysis
- 4.6. Regulatory Landscape
- 4.7. Current Market Potential and Opportunity Assessment (TAM–SAM–SOM Framework)
- 4.8. RAX Analyst Note
- 4.1. Porters Five Forces
- 5. Market Analysis, Insights and Forecast 2021-2033
- 5.1. Market Analysis, Insights and Forecast - by Type
- 5.1.1. Wet
- 5.1.2. Dry
- 5.1.3. Hybrid
- 5.2. Market Analysis, Insights and Forecast - by Design
- 5.2.1. Natural
- 5.2.2. Induced
- 5.2.3. Forced
- 5.3. Market Analysis, Insights and Forecast - by End User
- 5.3.1. Power Generation
- 5.3.2. Petrochemicals
- 5.3.3. Oil & Gas
- 5.3.4. Other End Users
- 5.4. Market Analysis, Insights and Forecast - by Region
- 5.4.1. North America
- 5.4.2. Europe
- 5.4.3. Asia Pacific
- 5.4.4. Middle East
- 5.4.5. South America
- 5.1. Market Analysis, Insights and Forecast - by Type
- 6. Global Field Erected Cooling Towers Industry Analysis, Insights and Forecast, 2021-2033
- 6.1. Market Analysis, Insights and Forecast - by Type
- 6.1.1. Wet
- 6.1.2. Dry
- 6.1.3. Hybrid
- 6.2. Market Analysis, Insights and Forecast - by Design
- 6.2.1. Natural
- 6.2.2. Induced
- 6.2.3. Forced
- 6.3. Market Analysis, Insights and Forecast - by End User
- 6.3.1. Power Generation
- 6.3.2. Petrochemicals
- 6.3.3. Oil & Gas
- 6.3.4. Other End Users
- 6.1. Market Analysis, Insights and Forecast - by Type
- 7. North America Field Erected Cooling Towers Industry Analysis, Insights and Forecast, 2020-2032
- 7.1. Market Analysis, Insights and Forecast - by Type
- 7.1.1. Wet
- 7.1.2. Dry
- 7.1.3. Hybrid
- 7.2. Market Analysis, Insights and Forecast - by Design
- 7.2.1. Natural
- 7.2.2. Induced
- 7.2.3. Forced
- 7.3. Market Analysis, Insights and Forecast - by End User
- 7.3.1. Power Generation
- 7.3.2. Petrochemicals
- 7.3.3. Oil & Gas
- 7.3.4. Other End Users
- 7.1. Market Analysis, Insights and Forecast - by Type
- 8. Europe Field Erected Cooling Towers Industry Analysis, Insights and Forecast, 2020-2032
- 8.1. Market Analysis, Insights and Forecast - by Type
- 8.1.1. Wet
- 8.1.2. Dry
- 8.1.3. Hybrid
- 8.2. Market Analysis, Insights and Forecast - by Design
- 8.2.1. Natural
- 8.2.2. Induced
- 8.2.3. Forced
- 8.3. Market Analysis, Insights and Forecast - by End User
- 8.3.1. Power Generation
- 8.3.2. Petrochemicals
- 8.3.3. Oil & Gas
- 8.3.4. Other End Users
- 8.1. Market Analysis, Insights and Forecast - by Type
- 9. Asia Pacific Field Erected Cooling Towers Industry Analysis, Insights and Forecast, 2020-2032
- 9.1. Market Analysis, Insights and Forecast - by Type
- 9.1.1. Wet
- 9.1.2. Dry
- 9.1.3. Hybrid
- 9.2. Market Analysis, Insights and Forecast - by Design
- 9.2.1. Natural
- 9.2.2. Induced
- 9.2.3. Forced
- 9.3. Market Analysis, Insights and Forecast - by End User
- 9.3.1. Power Generation
- 9.3.2. Petrochemicals
- 9.3.3. Oil & Gas
- 9.3.4. Other End Users
- 9.1. Market Analysis, Insights and Forecast - by Type
- 10. Middle East Field Erected Cooling Towers Industry Analysis, Insights and Forecast, 2020-2032
- 10.1. Market Analysis, Insights and Forecast - by Type
- 10.1.1. Wet
- 10.1.2. Dry
- 10.1.3. Hybrid
- 10.2. Market Analysis, Insights and Forecast - by Design
- 10.2.1. Natural
- 10.2.2. Induced
- 10.2.3. Forced
- 10.3. Market Analysis, Insights and Forecast - by End User
- 10.3.1. Power Generation
- 10.3.2. Petrochemicals
- 10.3.3. Oil & Gas
- 10.3.4. Other End Users
- 10.1. Market Analysis, Insights and Forecast - by Type
- 11. South America Field Erected Cooling Towers Industry Analysis, Insights and Forecast, 2020-2032
- 11.1. Market Analysis, Insights and Forecast - by Type
- 11.1.1. Wet
- 11.1.2. Dry
- 11.1.3. Hybrid
- 11.2. Market Analysis, Insights and Forecast - by Design
- 11.2.1. Natural
- 11.2.2. Induced
- 11.2.3. Forced
- 11.3. Market Analysis, Insights and Forecast - by End User
- 11.3.1. Power Generation
- 11.3.2. Petrochemicals
- 11.3.3. Oil & Gas
- 11.3.4. Other End Users
- 11.1. Market Analysis, Insights and Forecast - by Type
- 12. Competitive Analysis
- 12.1. Company Profiles
- 12.1.1 SPX Cooling Technologies Inc
- 12.1.1.1. Company Overview
- 12.1.1.2. Products
- 12.1.1.3. Company Financials
- 12.1.1.4. SWOT Analysis
- 12.1.2 Evapco Inc
- 12.1.2.1. Company Overview
- 12.1.2.2. Products
- 12.1.2.3. Company Financials
- 12.1.2.4. SWOT Analysis
- 12.1.3 Watco Group Ltd
- 12.1.3.1. Company Overview
- 12.1.3.2. Products
- 12.1.3.3. Company Financials
- 12.1.3.4. SWOT Analysis
- 12.1.4 ENEXIO Management GmbH
- 12.1.4.1. Company Overview
- 12.1.4.2. Products
- 12.1.4.3. Company Financials
- 12.1.4.4. SWOT Analysis
- 12.1.5 Hamon & Cie International SA
- 12.1.5.1. Company Overview
- 12.1.5.2. Products
- 12.1.5.3. Company Financials
- 12.1.5.4. SWOT Analysis
- 12.1.6 Towertech Cooling System Pvt Ltd
- 12.1.6.1. Company Overview
- 12.1.6.2. Products
- 12.1.6.3. Company Financials
- 12.1.6.4. SWOT Analysis
- 12.1.7 Paharpur Cooling Towers Ltd
- 12.1.7.1. Company Overview
- 12.1.7.2. Products
- 12.1.7.3. Company Financials
- 12.1.7.4. SWOT Analysis
- 12.1.8 Cyrco Inc
- 12.1.8.1. Company Overview
- 12.1.8.2. Products
- 12.1.8.3. Company Financials
- 12.1.8.4. SWOT Analysis
- 12.1.9 Babcock & Wilcox Enterprises Inc
- 12.1.9.1. Company Overview
- 12.1.9.2. Products
- 12.1.9.3. Company Financials
- 12.1.9.4. SWOT Analysis
- 12.1.10 Marley Flow Control Pty Ltd*List Not Exhaustive
- 12.1.10.1. Company Overview
- 12.1.10.2. Products
- 12.1.10.3. Company Financials
- 12.1.10.4. SWOT Analysis
- 12.1.1 SPX Cooling Technologies Inc
- 12.2. Market Entropy
- 12.2.1 Company's Key Areas Served
- 12.2.2 Recent Developments
- 12.3. Company Market Share Analysis 2025
- 12.3.1 Top 5 Companies Market Share Analysis
- 12.3.2 Top 3 Companies Market Share Analysis
- 12.4. List of Potential Customers
- 13. Research Methodology
List of Figures
- Figure 1: Global Field Erected Cooling Towers Industry Revenue Breakdown (billion, %) by Region 2025 & 2033
- Figure 2: Global Field Erected Cooling Towers Industry Volume Breakdown (Gigawatt, %) by Region 2025 & 2033
- Figure 3: North America Field Erected Cooling Towers Industry Revenue (billion), by Type 2025 & 2033
- Figure 4: North America Field Erected Cooling Towers Industry Volume (Gigawatt), by Type 2025 & 2033
- Figure 5: North America Field Erected Cooling Towers Industry Revenue Share (%), by Type 2025 & 2033
- Figure 6: North America Field Erected Cooling Towers Industry Volume Share (%), by Type 2025 & 2033
- Figure 7: North America Field Erected Cooling Towers Industry Revenue (billion), by Design 2025 & 2033
- Figure 8: North America Field Erected Cooling Towers Industry Volume (Gigawatt), by Design 2025 & 2033
- Figure 9: North America Field Erected Cooling Towers Industry Revenue Share (%), by Design 2025 & 2033
- Figure 10: North America Field Erected Cooling Towers Industry Volume Share (%), by Design 2025 & 2033
- Figure 11: North America Field Erected Cooling Towers Industry Revenue (billion), by End User 2025 & 2033
- Figure 12: North America Field Erected Cooling Towers Industry Volume (Gigawatt), by End User 2025 & 2033
- Figure 13: North America Field Erected Cooling Towers Industry Revenue Share (%), by End User 2025 & 2033
- Figure 14: North America Field Erected Cooling Towers Industry Volume Share (%), by End User 2025 & 2033
- Figure 15: North America Field Erected Cooling Towers Industry Revenue (billion), by Country 2025 & 2033
- Figure 16: North America Field Erected Cooling Towers Industry Volume (Gigawatt), by Country 2025 & 2033
- Figure 17: North America Field Erected Cooling Towers Industry Revenue Share (%), by Country 2025 & 2033
- Figure 18: North America Field Erected Cooling Towers Industry Volume Share (%), by Country 2025 & 2033
- Figure 19: Europe Field Erected Cooling Towers Industry Revenue (billion), by Type 2025 & 2033
- Figure 20: Europe Field Erected Cooling Towers Industry Volume (Gigawatt), by Type 2025 & 2033
- Figure 21: Europe Field Erected Cooling Towers Industry Revenue Share (%), by Type 2025 & 2033
- Figure 22: Europe Field Erected Cooling Towers Industry Volume Share (%), by Type 2025 & 2033
- Figure 23: Europe Field Erected Cooling Towers Industry Revenue (billion), by Design 2025 & 2033
- Figure 24: Europe Field Erected Cooling Towers Industry Volume (Gigawatt), by Design 2025 & 2033
- Figure 25: Europe Field Erected Cooling Towers Industry Revenue Share (%), by Design 2025 & 2033
- Figure 26: Europe Field Erected Cooling Towers Industry Volume Share (%), by Design 2025 & 2033
- Figure 27: Europe Field Erected Cooling Towers Industry Revenue (billion), by End User 2025 & 2033
- Figure 28: Europe Field Erected Cooling Towers Industry Volume (Gigawatt), by End User 2025 & 2033
- Figure 29: Europe Field Erected Cooling Towers Industry Revenue Share (%), by End User 2025 & 2033
- Figure 30: Europe Field Erected Cooling Towers Industry Volume Share (%), by End User 2025 & 2033
- Figure 31: Europe Field Erected Cooling Towers Industry Revenue (billion), by Country 2025 & 2033
- Figure 32: Europe Field Erected Cooling Towers Industry Volume (Gigawatt), by Country 2025 & 2033
- Figure 33: Europe Field Erected Cooling Towers Industry Revenue Share (%), by Country 2025 & 2033
- Figure 34: Europe Field Erected Cooling Towers Industry Volume Share (%), by Country 2025 & 2033
- Figure 35: Asia Pacific Field Erected Cooling Towers Industry Revenue (billion), by Type 2025 & 2033
- Figure 36: Asia Pacific Field Erected Cooling Towers Industry Volume (Gigawatt), by Type 2025 & 2033
- Figure 37: Asia Pacific Field Erected Cooling Towers Industry Revenue Share (%), by Type 2025 & 2033
- Figure 38: Asia Pacific Field Erected Cooling Towers Industry Volume Share (%), by Type 2025 & 2033
- Figure 39: Asia Pacific Field Erected Cooling Towers Industry Revenue (billion), by Design 2025 & 2033
- Figure 40: Asia Pacific Field Erected Cooling Towers Industry Volume (Gigawatt), by Design 2025 & 2033
- Figure 41: Asia Pacific Field Erected Cooling Towers Industry Revenue Share (%), by Design 2025 & 2033
- Figure 42: Asia Pacific Field Erected Cooling Towers Industry Volume Share (%), by Design 2025 & 2033
- Figure 43: Asia Pacific Field Erected Cooling Towers Industry Revenue (billion), by End User 2025 & 2033
- Figure 44: Asia Pacific Field Erected Cooling Towers Industry Volume (Gigawatt), by End User 2025 & 2033
- Figure 45: Asia Pacific Field Erected Cooling Towers Industry Revenue Share (%), by End User 2025 & 2033
- Figure 46: Asia Pacific Field Erected Cooling Towers Industry Volume Share (%), by End User 2025 & 2033
- Figure 47: Asia Pacific Field Erected Cooling Towers Industry Revenue (billion), by Country 2025 & 2033
- Figure 48: Asia Pacific Field Erected Cooling Towers Industry Volume (Gigawatt), by Country 2025 & 2033
- Figure 49: Asia Pacific Field Erected Cooling Towers Industry Revenue Share (%), by Country 2025 & 2033
- Figure 50: Asia Pacific Field Erected Cooling Towers Industry Volume Share (%), by Country 2025 & 2033
- Figure 51: Middle East Field Erected Cooling Towers Industry Revenue (billion), by Type 2025 & 2033
- Figure 52: Middle East Field Erected Cooling Towers Industry Volume (Gigawatt), by Type 2025 & 2033
- Figure 53: Middle East Field Erected Cooling Towers Industry Revenue Share (%), by Type 2025 & 2033
- Figure 54: Middle East Field Erected Cooling Towers Industry Volume Share (%), by Type 2025 & 2033
- Figure 55: Middle East Field Erected Cooling Towers Industry Revenue (billion), by Design 2025 & 2033
- Figure 56: Middle East Field Erected Cooling Towers Industry Volume (Gigawatt), by Design 2025 & 2033
- Figure 57: Middle East Field Erected Cooling Towers Industry Revenue Share (%), by Design 2025 & 2033
- Figure 58: Middle East Field Erected Cooling Towers Industry Volume Share (%), by Design 2025 & 2033
- Figure 59: Middle East Field Erected Cooling Towers Industry Revenue (billion), by End User 2025 & 2033
- Figure 60: Middle East Field Erected Cooling Towers Industry Volume (Gigawatt), by End User 2025 & 2033
- Figure 61: Middle East Field Erected Cooling Towers Industry Revenue Share (%), by End User 2025 & 2033
- Figure 62: Middle East Field Erected Cooling Towers Industry Volume Share (%), by End User 2025 & 2033
- Figure 63: Middle East Field Erected Cooling Towers Industry Revenue (billion), by Country 2025 & 2033
- Figure 64: Middle East Field Erected Cooling Towers Industry Volume (Gigawatt), by Country 2025 & 2033
- Figure 65: Middle East Field Erected Cooling Towers Industry Revenue Share (%), by Country 2025 & 2033
- Figure 66: Middle East Field Erected Cooling Towers Industry Volume Share (%), by Country 2025 & 2033
- Figure 67: South America Field Erected Cooling Towers Industry Revenue (billion), by Type 2025 & 2033
- Figure 68: South America Field Erected Cooling Towers Industry Volume (Gigawatt), by Type 2025 & 2033
- Figure 69: South America Field Erected Cooling Towers Industry Revenue Share (%), by Type 2025 & 2033
- Figure 70: South America Field Erected Cooling Towers Industry Volume Share (%), by Type 2025 & 2033
- Figure 71: South America Field Erected Cooling Towers Industry Revenue (billion), by Design 2025 & 2033
- Figure 72: South America Field Erected Cooling Towers Industry Volume (Gigawatt), by Design 2025 & 2033
- Figure 73: South America Field Erected Cooling Towers Industry Revenue Share (%), by Design 2025 & 2033
- Figure 74: South America Field Erected Cooling Towers Industry Volume Share (%), by Design 2025 & 2033
- Figure 75: South America Field Erected Cooling Towers Industry Revenue (billion), by End User 2025 & 2033
- Figure 76: South America Field Erected Cooling Towers Industry Volume (Gigawatt), by End User 2025 & 2033
- Figure 77: South America Field Erected Cooling Towers Industry Revenue Share (%), by End User 2025 & 2033
- Figure 78: South America Field Erected Cooling Towers Industry Volume Share (%), by End User 2025 & 2033
- Figure 79: South America Field Erected Cooling Towers Industry Revenue (billion), by Country 2025 & 2033
- Figure 80: South America Field Erected Cooling Towers Industry Volume (Gigawatt), by Country 2025 & 2033
- Figure 81: South America Field Erected Cooling Towers Industry Revenue Share (%), by Country 2025 & 2033
- Figure 82: South America Field Erected Cooling Towers Industry Volume Share (%), by Country 2025 & 2033
List of Tables
- Table 1: Global Field Erected Cooling Towers Industry Revenue billion Forecast, by Type 2020 & 2033
- Table 2: Global Field Erected Cooling Towers Industry Volume Gigawatt Forecast, by Type 2020 & 2033
- Table 3: Global Field Erected Cooling Towers Industry Revenue billion Forecast, by Design 2020 & 2033
- Table 4: Global Field Erected Cooling Towers Industry Volume Gigawatt Forecast, by Design 2020 & 2033
- Table 5: Global Field Erected Cooling Towers Industry Revenue billion Forecast, by End User 2020 & 2033
- Table 6: Global Field Erected Cooling Towers Industry Volume Gigawatt Forecast, by End User 2020 & 2033
- Table 7: Global Field Erected Cooling Towers Industry Revenue billion Forecast, by Region 2020 & 2033
- Table 8: Global Field Erected Cooling Towers Industry Volume Gigawatt Forecast, by Region 2020 & 2033
- Table 9: Global Field Erected Cooling Towers Industry Revenue billion Forecast, by Type 2020 & 2033
- Table 10: Global Field Erected Cooling Towers Industry Volume Gigawatt Forecast, by Type 2020 & 2033
- Table 11: Global Field Erected Cooling Towers Industry Revenue billion Forecast, by Design 2020 & 2033
- Table 12: Global Field Erected Cooling Towers Industry Volume Gigawatt Forecast, by Design 2020 & 2033
- Table 13: Global Field Erected Cooling Towers Industry Revenue billion Forecast, by End User 2020 & 2033
- Table 14: Global Field Erected Cooling Towers Industry Volume Gigawatt Forecast, by End User 2020 & 2033
- Table 15: Global Field Erected Cooling Towers Industry Revenue billion Forecast, by Country 2020 & 2033
- Table 16: Global Field Erected Cooling Towers Industry Volume Gigawatt Forecast, by Country 2020 & 2033
- Table 17: Global Field Erected Cooling Towers Industry Revenue billion Forecast, by Type 2020 & 2033
- Table 18: Global Field Erected Cooling Towers Industry Volume Gigawatt Forecast, by Type 2020 & 2033
- Table 19: Global Field Erected Cooling Towers Industry Revenue billion Forecast, by Design 2020 & 2033
- Table 20: Global Field Erected Cooling Towers Industry Volume Gigawatt Forecast, by Design 2020 & 2033
- Table 21: Global Field Erected Cooling Towers Industry Revenue billion Forecast, by End User 2020 & 2033
- Table 22: Global Field Erected Cooling Towers Industry Volume Gigawatt Forecast, by End User 2020 & 2033
- Table 23: Global Field Erected Cooling Towers Industry Revenue billion Forecast, by Country 2020 & 2033
- Table 24: Global Field Erected Cooling Towers Industry Volume Gigawatt Forecast, by Country 2020 & 2033
- Table 25: Global Field Erected Cooling Towers Industry Revenue billion Forecast, by Type 2020 & 2033
- Table 26: Global Field Erected Cooling Towers Industry Volume Gigawatt Forecast, by Type 2020 & 2033
- Table 27: Global Field Erected Cooling Towers Industry Revenue billion Forecast, by Design 2020 & 2033
- Table 28: Global Field Erected Cooling Towers Industry Volume Gigawatt Forecast, by Design 2020 & 2033
- Table 29: Global Field Erected Cooling Towers Industry Revenue billion Forecast, by End User 2020 & 2033
- Table 30: Global Field Erected Cooling Towers Industry Volume Gigawatt Forecast, by End User 2020 & 2033
- Table 31: Global Field Erected Cooling Towers Industry Revenue billion Forecast, by Country 2020 & 2033
- Table 32: Global Field Erected Cooling Towers Industry Volume Gigawatt Forecast, by Country 2020 & 2033
- Table 33: Global Field Erected Cooling Towers Industry Revenue billion Forecast, by Type 2020 & 2033
- Table 34: Global Field Erected Cooling Towers Industry Volume Gigawatt Forecast, by Type 2020 & 2033
- Table 35: Global Field Erected Cooling Towers Industry Revenue billion Forecast, by Design 2020 & 2033
- Table 36: Global Field Erected Cooling Towers Industry Volume Gigawatt Forecast, by Design 2020 & 2033
- Table 37: Global Field Erected Cooling Towers Industry Revenue billion Forecast, by End User 2020 & 2033
- Table 38: Global Field Erected Cooling Towers Industry Volume Gigawatt Forecast, by End User 2020 & 2033
- Table 39: Global Field Erected Cooling Towers Industry Revenue billion Forecast, by Country 2020 & 2033
- Table 40: Global Field Erected Cooling Towers Industry Volume Gigawatt Forecast, by Country 2020 & 2033
- Table 41: Global Field Erected Cooling Towers Industry Revenue billion Forecast, by Type 2020 & 2033
- Table 42: Global Field Erected Cooling Towers Industry Volume Gigawatt Forecast, by Type 2020 & 2033
- Table 43: Global Field Erected Cooling Towers Industry Revenue billion Forecast, by Design 2020 & 2033
- Table 44: Global Field Erected Cooling Towers Industry Volume Gigawatt Forecast, by Design 2020 & 2033
- Table 45: Global Field Erected Cooling Towers Industry Revenue billion Forecast, by End User 2020 & 2033
- Table 46: Global Field Erected Cooling Towers Industry Volume Gigawatt Forecast, by End User 2020 & 2033
- Table 47: Global Field Erected Cooling Towers Industry Revenue billion Forecast, by Country 2020 & 2033
- Table 48: Global Field Erected Cooling Towers Industry Volume Gigawatt Forecast, by Country 2020 & 2033
Frequently Asked Questions
1. What is the projected Compound Annual Growth Rate (CAGR) of the Field Erected Cooling Towers Industry?
The projected CAGR is approximately 5.65%.
2. Which companies are prominent players in the Field Erected Cooling Towers Industry?
Key companies in the market include SPX Cooling Technologies Inc, Evapco Inc, Watco Group Ltd, ENEXIO Management GmbH, Hamon & Cie International SA, Towertech Cooling System Pvt Ltd, Paharpur Cooling Towers Ltd, Cyrco Inc, Babcock & Wilcox Enterprises Inc, Marley Flow Control Pty Ltd*List Not Exhaustive.
3. What are the main segments of the Field Erected Cooling Towers Industry?
The market segments include Type, Design, End User.
4. Can you provide details about the market size?
The market size is estimated to be USD 2.93 billion as of 2022.
5. What are some drivers contributing to market growth?
4.; Declining Cost of Lithium Batteries4.; Increased Adoption of Renewable Energy.
6. What are the notable trends driving market growth?
Wet Type Segment to Dominate the Market.
7. Are there any restraints impacting market growth?
4.; Mismatch in Demand and Supply of Raw Materials for Battery Manufacturing.
8. Can you provide examples of recent developments in the market?
In February 2020, SPX Cooling Technologies Inc. launched its new Marley MH Element Fluid Cooler, an induced-draft, crossflow closed-circuit cooling tower suitable for heating, ventilation, air conditioning (HVAC), industrial, and process cooling applications.
9. What pricing options are available for accessing the report?
Pricing options include single-user, multi-user, and enterprise licenses priced at USD 4750, USD 5250, and USD 8750 respectively.
10. Is the market size provided in terms of value or volume?
The market size is provided in terms of value, measured in billion and volume, measured in Gigawatt.
11. Are there any specific market keywords associated with the report?
Yes, the market keyword associated with the report is "Field Erected Cooling Towers Industry," which aids in identifying and referencing the specific market segment covered.
12. How do I determine which pricing option suits my needs best?
The pricing options vary based on user requirements and access needs. Individual users may opt for single-user licenses, while businesses requiring broader access may choose multi-user or enterprise licenses for cost-effective access to the report.
13. Are there any additional resources or data provided in the Field Erected Cooling Towers Industry report?
While the report offers comprehensive insights, it's advisable to review the specific contents or supplementary materials provided to ascertain if additional resources or data are available.
14. How can I stay updated on further developments or reports in the Field Erected Cooling Towers Industry?
To stay informed about further developments, trends, and reports in the Field Erected Cooling Towers Industry, consider subscribing to industry newsletters, following relevant companies and organizations, or regularly checking reputable industry news sources and publications.
Methodology
Step 1 - Identification of Relevant Samples Size from Population Database


Step 2 - Approaches for Defining Global Market Size (Value, Volume* & Price*)

Note*: In applicable scenarios
Step 3 - Data Sources
Primary Research
- Web Analytics
- Survey Reports
- Research Institute
- Latest Research Reports
- Opinion Leaders
Secondary Research
- Annual Reports
- White Paper
- Latest Press Release
- Industry Association
- Paid Database
- Investor Presentations

Step 4 - Data Triangulation
Involves using different sources of information in order to increase the validity of a study
These sources are likely to be stakeholders in a program - participants, other researchers, program staff, other community members, and so on.
Then we put all data in single framework & apply various statistical tools to find out the dynamic on the market.
During the analysis stage, feedback from the stakeholder groups would be compared to determine areas of agreement as well as areas of divergence

