Key Insights
The global Fire Blanket market is projected for robust expansion, with an estimated market size of approximately $850 million in 2025, poised for a Compound Annual Growth Rate (CAGR) of around 6.5% throughout the forecast period of 2025-2033. This sustained growth is primarily fueled by an increasing emphasis on workplace safety regulations and a heightened awareness of fire prevention measures across various sectors. Industrial applications, including manufacturing facilities, laboratories, and construction sites, represent a significant segment, driven by stringent safety protocols and the need to mitigate risks associated with hazardous materials and operations. Public places, such as schools, hospitals, and commercial buildings, are also witnessing a surge in demand as authorities mandate improved fire safety infrastructure. Furthermore, the residential sector is contributing to market growth as consumers become more conscious of home fire safety, opting for readily accessible and effective fire suppression tools. The market is characterized by a diverse range of product types, with Fiberglass Fire Blankets dominating due to their excellent fire-resistant properties, durability, and cost-effectiveness. Asbestos fire blankets, while historically significant, are being phased out due to health concerns, and Cotton Fire Blankets offer a more economical alternative for less demanding applications.
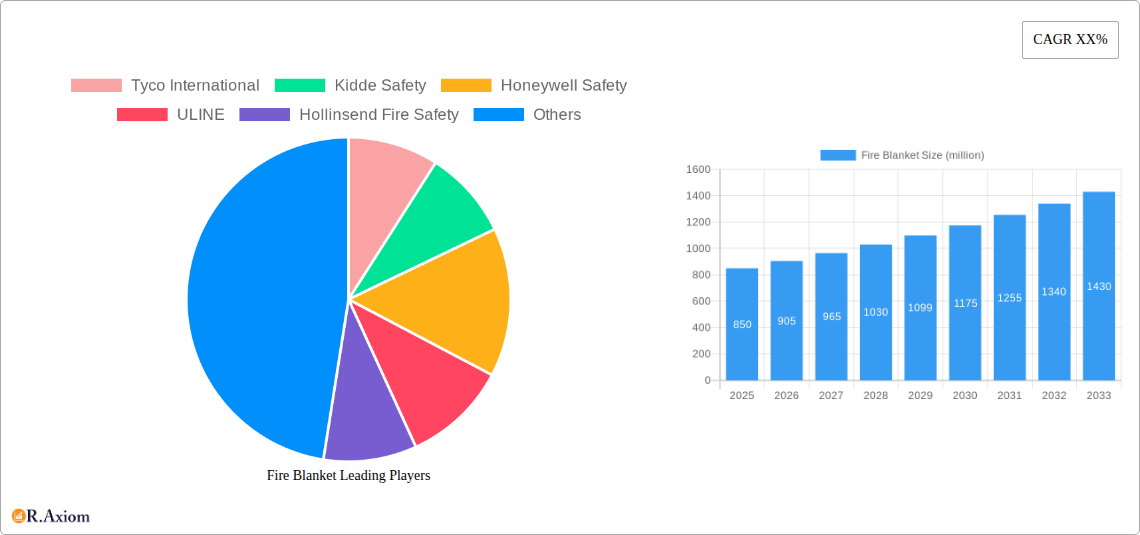
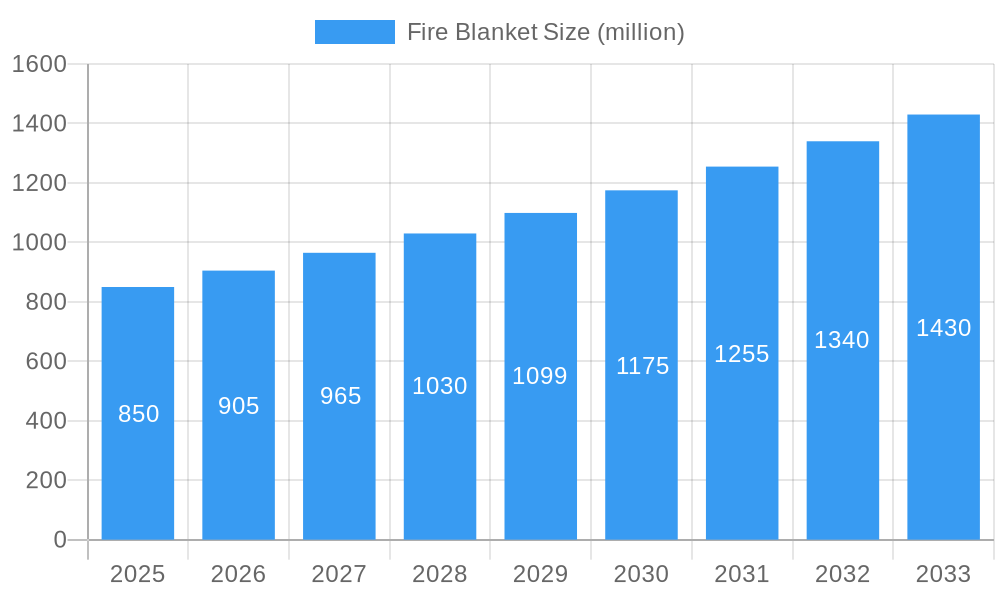
Fire Blanket Market Size (In Million)
Key drivers propelling the fire blanket market include advancements in material science leading to more efficient and user-friendly fire blanket designs, alongside governmental initiatives promoting fire safety awareness and compliance. The increasing frequency of industrial accidents and a growing concern for protecting assets and lives in commercial and residential spaces are also significant contributing factors. However, the market faces certain restraints, including the high initial cost of some advanced fire blanket technologies and a lack of widespread awareness in developing regions. Competition among key players like Tyco International, Kidde Safety, and Honeywell Safety, along with emerging manufacturers, is driving innovation and product differentiation. Regional dynamics indicate strong demand in North America and Europe, attributed to mature safety standards and a proactive approach to risk management. The Asia Pacific region is expected to emerge as a high-growth market due to rapid industrialization, increasing construction activities, and a growing population coupled with rising safety consciousness. Investments in fire safety infrastructure and stringent regulatory frameworks in countries like China and India are expected to further accelerate market penetration.
Fire Blanket Company Market Share
Here is a detailed, SEO-optimized report description for the Fire Blanket market, designed for immediate use without modification:
Fire Blanket Market Concentration & Innovation
The global Fire Blanket market, estimated to be valued at over $300 million in 2025, exhibits a moderately consolidated landscape with several key players vying for market share. Innovation remains a crucial differentiator, driven by advancements in material science and enhanced fire suppression technologies. Regulatory frameworks, particularly those pertaining to workplace safety and public building codes, significantly influence market demand and product standards, with an expected market size exceeding $500 million by 2033. Product substitutes, such as fire extinguishers and sprinkler systems, present a competitive challenge, necessitating continuous product improvement and cost-effectiveness. End-user trends are shifting towards lightweight, easy-to-deploy, and high-performance fire blankets, particularly in industrial and commercial settings. Mergers and acquisition (M&A) activities, though not extensively documented for this specific niche, are anticipated to increase as larger safety equipment manufacturers seek to broaden their portfolios. M&A deal values are projected to rise as companies consolidate to achieve economies of scale and expand geographical reach. Key companies such as Tyco International, Kidde Safety, and Honeywell Safety are at the forefront of this innovative drive.
Fire Blanket Industry Trends & Insights
The Fire Blanket industry is poised for substantial growth, with a projected Compound Annual Growth Rate (CAGR) of approximately 6.5% from 2025 to 2033, leading to an estimated market valuation of over $500 million. This expansion is fueled by increasing global awareness of fire safety regulations and the inherent risks associated with industrial processes, public gatherings, and domestic environments. Technological disruptions are primarily focused on material innovation, with a growing emphasis on advanced fiberglass and composite materials that offer superior fire resistance, durability, and ease of use. Consumer preferences are evolving to favor compact, user-friendly, and aesthetically unobtrusive fire blanket solutions, especially for home and public space applications. Competitive dynamics are characterized by a blend of established global players and regional specialists, each striving to differentiate through product quality, certifications, and pricing strategies. Market penetration is expected to deepen across developing economies as safety standards are harmonized and awareness campaigns gain traction. The focus on advanced fire suppression is also driving the adoption of specialized fire blankets for unique industrial applications.
Dominant Markets & Segments in Fire Blanket
The Fire Blanket market exhibits distinct dominance across various segments and geographical regions. Industrial Use stands out as the leading application segment, driven by stringent safety mandates in manufacturing, chemical processing, and construction industries. The requirement for reliable fire suppression in high-risk environments ensures consistent demand for robust fire blankets. Within this segment, key drivers include industrial expansion in emerging economies and stricter adherence to occupational safety and health administration (OSHA) regulations. The Fiberglass Fire Blanket type dominates the market due to its excellent thermal insulation, non-combustibility, and durability, making it ideal for demanding industrial applications. Its widespread adoption is facilitated by its proven effectiveness and compliance with international safety standards.
In terms of geographical dominance, North America and Europe are leading markets, characterized by mature safety regulations, high disposable incomes, and a strong emphasis on workplace and public safety. The presence of major manufacturers and established distribution networks further solidifies their positions. Economic policies that prioritize public safety, coupled with robust infrastructure development in industrial sectors, are key drivers in these regions.
For Public Places, fire blankets are increasingly mandated in schools, hospitals, retail centers, and transportation hubs, reflecting a growing concern for mass casualty prevention. Factors such as increasing urbanization and a rise in public events contribute to the growth of this segment. The Home segment, while smaller, shows significant growth potential due to rising consumer awareness about fire hazards and the availability of more affordable and user-friendly options.
Fire Blanket Product Developments
Product development in the fire blanket sector is increasingly focused on enhancing material properties and user experience. Innovations include lightweight, self-extinguishing fiberglass fire blankets with improved thermal insulation capabilities and enhanced tear resistance. The development of specialized fire blankets for specific hazards, such as welding or chemical fires, offers a competitive advantage. Furthermore, advancements in packaging and deployment mechanisms are making fire blankets more accessible and user-friendly for a wider range of applications, from industrial settings to domestic use.
Report Scope & Segmentation Analysis
This report provides a comprehensive analysis of the global Fire Blanket market, segmented by Application into Industrial Use, Public Places, Home, and Others. The Industrial Use segment is projected to experience a CAGR of approximately 7% during the forecast period, driven by safety regulations in manufacturing and heavy industries. The Public Places segment is anticipated to grow at a CAGR of 6%, supported by increasing safety mandates in commercial and public infrastructure. The Home segment is expected to witness a CAGR of 5.5%, propelled by growing consumer awareness and affordability. The Others segment encompasses niche applications and is projected to grow at a modest pace.
The market is also segmented by Types, including Fiberglass Fire Blanket, Asbestos Fire Blanket, Cotton Fire Blanket, and Others. The Fiberglass Fire Blanket segment is the largest and fastest-growing, with an estimated market size of over $200 million in 2025, owing to its superior performance and safety profile. The Asbestos Fire Blanket segment is declining due to health concerns and regulatory bans. The Cotton Fire Blanket segment caters to specific, less demanding applications.
Key Drivers of Fire Blanket Growth
Several key factors are propelling the growth of the Fire Blanket market. Stringent government regulations and international safety standards mandating the availability of fire suppression equipment in various environments are primary drivers. The increasing frequency of industrial accidents and public fires heightens awareness and demand for effective fire safety solutions. Technological advancements in material science, leading to more durable, lightweight, and efficient fire blankets, also contribute significantly. Furthermore, the growing emphasis on workplace safety in developing economies, coupled with rising disposable incomes, is opening up new market opportunities.
Challenges in the Fire Blanket Sector
Despite robust growth, the Fire Blanket sector faces several challenges. Strict regulatory compliance and the need for certifications can be a significant barrier to entry for smaller manufacturers. Fluctuations in raw material prices, particularly for fiberglass and specialized chemicals, can impact production costs and profit margins. Intense competition from established players and the availability of alternative fire suppression systems, such as fire extinguishers, pose continuous pressure. Supply chain disruptions, especially in globalized markets, can also affect product availability and lead times. The market penetration in certain developing regions is also hindered by lack of awareness and affordability.
Emerging Opportunities in Fire Blanket
Emerging opportunities in the Fire Blanket market lie in the development of smart fire blankets integrated with sensors for early fire detection. The growing demand for sustainable and eco-friendly fire suppression materials presents another avenue for innovation. Expansion into emerging economies with rapidly industrializing sectors and increasing safety consciousness offers significant untapped potential. Furthermore, the development of specialized fire blankets for niche applications, such as laboratories, kitchens, and electric vehicle charging stations, can cater to specific market demands and drive growth.
Leading Players in the Fire Blanket Market
- Tyco International
- Kidde Safety
- Honeywell Safety
- ULINE
- Hollinsend Fire Safety
- Junkin Safety
- Triangle Fire
- Water Jel
- Oberon
- Acmetex
- JACTONE
- Safelincs
- Acme United Corporation
- KLEVERS-Italian
- Yaoxing
Key Developments in Fire Blanket Industry
- 2023: Launch of a new generation of lightweight, high-performance fiberglass fire blankets by Tyco International, enhancing portability and ease of deployment.
- 2023: Kidde Safety expands its product line with an advanced fire blanket designed for kitchen use, featuring enhanced oil fire resistance.
- 2022: Honeywell Safety receives UL certification for its expanded range of industrial-grade fire blankets, reinforcing its commitment to safety standards.
- 2022: ULINE introduces a cost-effective, bulk-packaged fire blanket solution targeting small to medium-sized businesses.
- 2021: Hollinsend Fire Safety develops a specialized fire blanket for welding applications, offering superior protection against sparks and heat.
- 2021: Junkin Safety enhances the durability and reusability of its fire blankets through advanced stitching and material treatments.
- 2020: Triangle Fire introduces a fire blanket with an integrated carrying case for improved storage and quick access in emergency situations.
- 2020: Water Jel expands its distribution network in Asia, making its fire suppression products more accessible in the region.
- 2019: Oberon launches an innovative, compact fire blanket designed for automotive and recreational vehicle applications.
- 2019: Acmetex introduces a fire blanket with enhanced chemical resistance for laboratory and industrial settings.
Strategic Outlook for Fire Blanket Market
The strategic outlook for the Fire Blanket market remains optimistic, driven by persistent global safety concerns and evolving regulatory landscapes. The industry's future growth will be shaped by continuous innovation in material science, leading to lighter, more effective, and user-friendly products. Expansion into emerging markets, coupled with strategic partnerships and potential M&A activities, will be crucial for market players to enhance their global footprint and competitive positioning. The increasing demand for specialized fire blankets catering to niche industrial and consumer needs presents significant untapped opportunities for market leaders.
Fire Blanket Segmentation
-
1. Application
- 1.1. Industrial Use
- 1.2. Public Places
- 1.3. Home
- 1.4. Others
-
2. Types
- 2.1. Fiberglass Fire Blanket
- 2.2. Asbestos Fire Blanket
- 2.3. Cotton Fire Blanket
- 2.4. Others
Fire Blanket Segmentation By Geography
-
1. North America
- 1.1. United States
- 1.2. Canada
- 1.3. Mexico
-
2. South America
- 2.1. Brazil
- 2.2. Argentina
- 2.3. Rest of South America
-
3. Europe
- 3.1. United Kingdom
- 3.2. Germany
- 3.3. France
- 3.4. Italy
- 3.5. Spain
- 3.6. Russia
- 3.7. Benelux
- 3.8. Nordics
- 3.9. Rest of Europe
-
4. Middle East & Africa
- 4.1. Turkey
- 4.2. Israel
- 4.3. GCC
- 4.4. North Africa
- 4.5. South Africa
- 4.6. Rest of Middle East & Africa
-
5. Asia Pacific
- 5.1. China
- 5.2. India
- 5.3. Japan
- 5.4. South Korea
- 5.5. ASEAN
- 5.6. Oceania
- 5.7. Rest of Asia Pacific
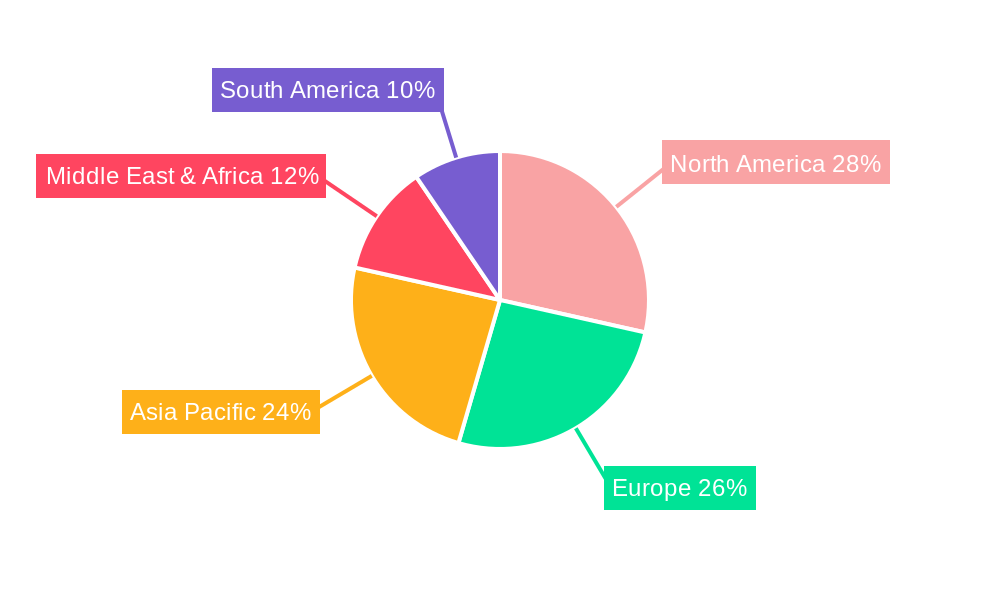
Fire Blanket Regional Market Share
Geographic Coverage of Fire Blanket
Fire Blanket REPORT HIGHLIGHTS
| Aspects | Details |
|---|---|
| Study Period | 2020-2034 |
| Base Year | 2025 |
| Estimated Year | 2026 |
| Forecast Period | 2026-2034 |
| Historical Period | 2020-2025 |
| Growth Rate | CAGR of XX% from 2020-2034 |
| Segmentation |
|
Table of Contents
- 1. Introduction
- 1.1. Research Scope
- 1.2. Market Segmentation
- 1.3. Research Objective
- 1.4. Definitions and Assumptions
- 2. Executive Summary
- 2.1. Market Snapshot
- 3. Market Dynamics
- 3.1. Market Drivers
- 3.2. Market Restrains
- 3.3. Market Trends
- 3.4. Market Opportunities
- 4. Market Factor Analysis
- 4.1. Porters Five Forces
- 4.1.1. Bargaining Power of Suppliers
- 4.1.2. Bargaining Power of Buyers
- 4.1.3. Threat of New Entrants
- 4.1.4. Threat of Substitutes
- 4.1.5. Competitive Rivalry
- 4.2. PESTEL analysis
- 4.3. BCG Analysis
- 4.3.1. Stars (High Growth, High Market Share)
- 4.3.2. Cash Cows (Low Growth, High Market Share)
- 4.3.3. Question Mark (High Growth, Low Market Share)
- 4.3.4. Dogs (Low Growth, Low Market Share)
- 4.4. Ansoff Matrix Analysis
- 4.5. Supply Chain Analysis
- 4.6. Regulatory Landscape
- 4.7. Current Market Potential and Opportunity Assessment (TAM–SAM–SOM Framework)
- 4.8. RAX Analyst Note
- 4.1. Porters Five Forces
- 5. Market Analysis, Insights and Forecast 2021-2033
- 5.1. Market Analysis, Insights and Forecast - by Application
- 5.1.1. Industrial Use
- 5.1.2. Public Places
- 5.1.3. Home
- 5.1.4. Others
- 5.2. Market Analysis, Insights and Forecast - by Types
- 5.2.1. Fiberglass Fire Blanket
- 5.2.2. Asbestos Fire Blanket
- 5.2.3. Cotton Fire Blanket
- 5.2.4. Others
- 5.3. Market Analysis, Insights and Forecast - by Region
- 5.3.1. North America
- 5.3.2. South America
- 5.3.3. Europe
- 5.3.4. Middle East & Africa
- 5.3.5. Asia Pacific
- 5.1. Market Analysis, Insights and Forecast - by Application
- 6. Global Fire Blanket Analysis, Insights and Forecast, 2021-2033
- 6.1. Market Analysis, Insights and Forecast - by Application
- 6.1.1. Industrial Use
- 6.1.2. Public Places
- 6.1.3. Home
- 6.1.4. Others
- 6.2. Market Analysis, Insights and Forecast - by Types
- 6.2.1. Fiberglass Fire Blanket
- 6.2.2. Asbestos Fire Blanket
- 6.2.3. Cotton Fire Blanket
- 6.2.4. Others
- 6.1. Market Analysis, Insights and Forecast - by Application
- 7. North America Fire Blanket Analysis, Insights and Forecast, 2020-2032
- 7.1. Market Analysis, Insights and Forecast - by Application
- 7.1.1. Industrial Use
- 7.1.2. Public Places
- 7.1.3. Home
- 7.1.4. Others
- 7.2. Market Analysis, Insights and Forecast - by Types
- 7.2.1. Fiberglass Fire Blanket
- 7.2.2. Asbestos Fire Blanket
- 7.2.3. Cotton Fire Blanket
- 7.2.4. Others
- 7.1. Market Analysis, Insights and Forecast - by Application
- 8. South America Fire Blanket Analysis, Insights and Forecast, 2020-2032
- 8.1. Market Analysis, Insights and Forecast - by Application
- 8.1.1. Industrial Use
- 8.1.2. Public Places
- 8.1.3. Home
- 8.1.4. Others
- 8.2. Market Analysis, Insights and Forecast - by Types
- 8.2.1. Fiberglass Fire Blanket
- 8.2.2. Asbestos Fire Blanket
- 8.2.3. Cotton Fire Blanket
- 8.2.4. Others
- 8.1. Market Analysis, Insights and Forecast - by Application
- 9. Europe Fire Blanket Analysis, Insights and Forecast, 2020-2032
- 9.1. Market Analysis, Insights and Forecast - by Application
- 9.1.1. Industrial Use
- 9.1.2. Public Places
- 9.1.3. Home
- 9.1.4. Others
- 9.2. Market Analysis, Insights and Forecast - by Types
- 9.2.1. Fiberglass Fire Blanket
- 9.2.2. Asbestos Fire Blanket
- 9.2.3. Cotton Fire Blanket
- 9.2.4. Others
- 9.1. Market Analysis, Insights and Forecast - by Application
- 10. Middle East & Africa Fire Blanket Analysis, Insights and Forecast, 2020-2032
- 10.1. Market Analysis, Insights and Forecast - by Application
- 10.1.1. Industrial Use
- 10.1.2. Public Places
- 10.1.3. Home
- 10.1.4. Others
- 10.2. Market Analysis, Insights and Forecast - by Types
- 10.2.1. Fiberglass Fire Blanket
- 10.2.2. Asbestos Fire Blanket
- 10.2.3. Cotton Fire Blanket
- 10.2.4. Others
- 10.1. Market Analysis, Insights and Forecast - by Application
- 11. Asia Pacific Fire Blanket Analysis, Insights and Forecast, 2020-2032
- 11.1. Market Analysis, Insights and Forecast - by Application
- 11.1.1. Industrial Use
- 11.1.2. Public Places
- 11.1.3. Home
- 11.1.4. Others
- 11.2. Market Analysis, Insights and Forecast - by Types
- 11.2.1. Fiberglass Fire Blanket
- 11.2.2. Asbestos Fire Blanket
- 11.2.3. Cotton Fire Blanket
- 11.2.4. Others
- 11.1. Market Analysis, Insights and Forecast - by Application
- 12. Competitive Analysis
- 12.1. Company Profiles
- 12.1.1 Tyco International
- 12.1.1.1. Company Overview
- 12.1.1.2. Products
- 12.1.1.3. Company Financials
- 12.1.1.4. SWOT Analysis
- 12.1.2 Kidde Safety
- 12.1.2.1. Company Overview
- 12.1.2.2. Products
- 12.1.2.3. Company Financials
- 12.1.2.4. SWOT Analysis
- 12.1.3 Honeywell Safety
- 12.1.3.1. Company Overview
- 12.1.3.2. Products
- 12.1.3.3. Company Financials
- 12.1.3.4. SWOT Analysis
- 12.1.4 ULINE
- 12.1.4.1. Company Overview
- 12.1.4.2. Products
- 12.1.4.3. Company Financials
- 12.1.4.4. SWOT Analysis
- 12.1.5 Hollinsend Fire Safety
- 12.1.5.1. Company Overview
- 12.1.5.2. Products
- 12.1.5.3. Company Financials
- 12.1.5.4. SWOT Analysis
- 12.1.6 Junkin Safety
- 12.1.6.1. Company Overview
- 12.1.6.2. Products
- 12.1.6.3. Company Financials
- 12.1.6.4. SWOT Analysis
- 12.1.7 Triangle Fire
- 12.1.7.1. Company Overview
- 12.1.7.2. Products
- 12.1.7.3. Company Financials
- 12.1.7.4. SWOT Analysis
- 12.1.8 Water Jel
- 12.1.8.1. Company Overview
- 12.1.8.2. Products
- 12.1.8.3. Company Financials
- 12.1.8.4. SWOT Analysis
- 12.1.9 Oberon
- 12.1.9.1. Company Overview
- 12.1.9.2. Products
- 12.1.9.3. Company Financials
- 12.1.9.4. SWOT Analysis
- 12.1.10 Acmetex
- 12.1.10.1. Company Overview
- 12.1.10.2. Products
- 12.1.10.3. Company Financials
- 12.1.10.4. SWOT Analysis
- 12.1.11 JACTONE
- 12.1.11.1. Company Overview
- 12.1.11.2. Products
- 12.1.11.3. Company Financials
- 12.1.11.4. SWOT Analysis
- 12.1.12 Safelincs
- 12.1.12.1. Company Overview
- 12.1.12.2. Products
- 12.1.12.3. Company Financials
- 12.1.12.4. SWOT Analysis
- 12.1.13 Acme United Corporation
- 12.1.13.1. Company Overview
- 12.1.13.2. Products
- 12.1.13.3. Company Financials
- 12.1.13.4. SWOT Analysis
- 12.1.14 KLEVERS-Italian
- 12.1.14.1. Company Overview
- 12.1.14.2. Products
- 12.1.14.3. Company Financials
- 12.1.14.4. SWOT Analysis
- 12.1.15 Yaoxing
- 12.1.15.1. Company Overview
- 12.1.15.2. Products
- 12.1.15.3. Company Financials
- 12.1.15.4. SWOT Analysis
- 12.1.1 Tyco International
- 12.2. Market Entropy
- 12.2.1 Company's Key Areas Served
- 12.2.2 Recent Developments
- 12.3. Company Market Share Analysis 2025
- 12.3.1 Top 5 Companies Market Share Analysis
- 12.3.2 Top 3 Companies Market Share Analysis
- 12.4. List of Potential Customers
- 13. Research Methodology
List of Figures
- Figure 1: Global Fire Blanket Revenue Breakdown (million, %) by Region 2025 & 2033
- Figure 2: Global Fire Blanket Volume Breakdown (K, %) by Region 2025 & 2033
- Figure 3: North America Fire Blanket Revenue (million), by Application 2025 & 2033
- Figure 4: North America Fire Blanket Volume (K), by Application 2025 & 2033
- Figure 5: North America Fire Blanket Revenue Share (%), by Application 2025 & 2033
- Figure 6: North America Fire Blanket Volume Share (%), by Application 2025 & 2033
- Figure 7: North America Fire Blanket Revenue (million), by Types 2025 & 2033
- Figure 8: North America Fire Blanket Volume (K), by Types 2025 & 2033
- Figure 9: North America Fire Blanket Revenue Share (%), by Types 2025 & 2033
- Figure 10: North America Fire Blanket Volume Share (%), by Types 2025 & 2033
- Figure 11: North America Fire Blanket Revenue (million), by Country 2025 & 2033
- Figure 12: North America Fire Blanket Volume (K), by Country 2025 & 2033
- Figure 13: North America Fire Blanket Revenue Share (%), by Country 2025 & 2033
- Figure 14: North America Fire Blanket Volume Share (%), by Country 2025 & 2033
- Figure 15: South America Fire Blanket Revenue (million), by Application 2025 & 2033
- Figure 16: South America Fire Blanket Volume (K), by Application 2025 & 2033
- Figure 17: South America Fire Blanket Revenue Share (%), by Application 2025 & 2033
- Figure 18: South America Fire Blanket Volume Share (%), by Application 2025 & 2033
- Figure 19: South America Fire Blanket Revenue (million), by Types 2025 & 2033
- Figure 20: South America Fire Blanket Volume (K), by Types 2025 & 2033
- Figure 21: South America Fire Blanket Revenue Share (%), by Types 2025 & 2033
- Figure 22: South America Fire Blanket Volume Share (%), by Types 2025 & 2033
- Figure 23: South America Fire Blanket Revenue (million), by Country 2025 & 2033
- Figure 24: South America Fire Blanket Volume (K), by Country 2025 & 2033
- Figure 25: South America Fire Blanket Revenue Share (%), by Country 2025 & 2033
- Figure 26: South America Fire Blanket Volume Share (%), by Country 2025 & 2033
- Figure 27: Europe Fire Blanket Revenue (million), by Application 2025 & 2033
- Figure 28: Europe Fire Blanket Volume (K), by Application 2025 & 2033
- Figure 29: Europe Fire Blanket Revenue Share (%), by Application 2025 & 2033
- Figure 30: Europe Fire Blanket Volume Share (%), by Application 2025 & 2033
- Figure 31: Europe Fire Blanket Revenue (million), by Types 2025 & 2033
- Figure 32: Europe Fire Blanket Volume (K), by Types 2025 & 2033
- Figure 33: Europe Fire Blanket Revenue Share (%), by Types 2025 & 2033
- Figure 34: Europe Fire Blanket Volume Share (%), by Types 2025 & 2033
- Figure 35: Europe Fire Blanket Revenue (million), by Country 2025 & 2033
- Figure 36: Europe Fire Blanket Volume (K), by Country 2025 & 2033
- Figure 37: Europe Fire Blanket Revenue Share (%), by Country 2025 & 2033
- Figure 38: Europe Fire Blanket Volume Share (%), by Country 2025 & 2033
- Figure 39: Middle East & Africa Fire Blanket Revenue (million), by Application 2025 & 2033
- Figure 40: Middle East & Africa Fire Blanket Volume (K), by Application 2025 & 2033
- Figure 41: Middle East & Africa Fire Blanket Revenue Share (%), by Application 2025 & 2033
- Figure 42: Middle East & Africa Fire Blanket Volume Share (%), by Application 2025 & 2033
- Figure 43: Middle East & Africa Fire Blanket Revenue (million), by Types 2025 & 2033
- Figure 44: Middle East & Africa Fire Blanket Volume (K), by Types 2025 & 2033
- Figure 45: Middle East & Africa Fire Blanket Revenue Share (%), by Types 2025 & 2033
- Figure 46: Middle East & Africa Fire Blanket Volume Share (%), by Types 2025 & 2033
- Figure 47: Middle East & Africa Fire Blanket Revenue (million), by Country 2025 & 2033
- Figure 48: Middle East & Africa Fire Blanket Volume (K), by Country 2025 & 2033
- Figure 49: Middle East & Africa Fire Blanket Revenue Share (%), by Country 2025 & 2033
- Figure 50: Middle East & Africa Fire Blanket Volume Share (%), by Country 2025 & 2033
- Figure 51: Asia Pacific Fire Blanket Revenue (million), by Application 2025 & 2033
- Figure 52: Asia Pacific Fire Blanket Volume (K), by Application 2025 & 2033
- Figure 53: Asia Pacific Fire Blanket Revenue Share (%), by Application 2025 & 2033
- Figure 54: Asia Pacific Fire Blanket Volume Share (%), by Application 2025 & 2033
- Figure 55: Asia Pacific Fire Blanket Revenue (million), by Types 2025 & 2033
- Figure 56: Asia Pacific Fire Blanket Volume (K), by Types 2025 & 2033
- Figure 57: Asia Pacific Fire Blanket Revenue Share (%), by Types 2025 & 2033
- Figure 58: Asia Pacific Fire Blanket Volume Share (%), by Types 2025 & 2033
- Figure 59: Asia Pacific Fire Blanket Revenue (million), by Country 2025 & 2033
- Figure 60: Asia Pacific Fire Blanket Volume (K), by Country 2025 & 2033
- Figure 61: Asia Pacific Fire Blanket Revenue Share (%), by Country 2025 & 2033
- Figure 62: Asia Pacific Fire Blanket Volume Share (%), by Country 2025 & 2033
List of Tables
- Table 1: Global Fire Blanket Revenue million Forecast, by Application 2020 & 2033
- Table 2: Global Fire Blanket Volume K Forecast, by Application 2020 & 2033
- Table 3: Global Fire Blanket Revenue million Forecast, by Types 2020 & 2033
- Table 4: Global Fire Blanket Volume K Forecast, by Types 2020 & 2033
- Table 5: Global Fire Blanket Revenue million Forecast, by Region 2020 & 2033
- Table 6: Global Fire Blanket Volume K Forecast, by Region 2020 & 2033
- Table 7: Global Fire Blanket Revenue million Forecast, by Application 2020 & 2033
- Table 8: Global Fire Blanket Volume K Forecast, by Application 2020 & 2033
- Table 9: Global Fire Blanket Revenue million Forecast, by Types 2020 & 2033
- Table 10: Global Fire Blanket Volume K Forecast, by Types 2020 & 2033
- Table 11: Global Fire Blanket Revenue million Forecast, by Country 2020 & 2033
- Table 12: Global Fire Blanket Volume K Forecast, by Country 2020 & 2033
- Table 13: United States Fire Blanket Revenue (million) Forecast, by Application 2020 & 2033
- Table 14: United States Fire Blanket Volume (K) Forecast, by Application 2020 & 2033
- Table 15: Canada Fire Blanket Revenue (million) Forecast, by Application 2020 & 2033
- Table 16: Canada Fire Blanket Volume (K) Forecast, by Application 2020 & 2033
- Table 17: Mexico Fire Blanket Revenue (million) Forecast, by Application 2020 & 2033
- Table 18: Mexico Fire Blanket Volume (K) Forecast, by Application 2020 & 2033
- Table 19: Global Fire Blanket Revenue million Forecast, by Application 2020 & 2033
- Table 20: Global Fire Blanket Volume K Forecast, by Application 2020 & 2033
- Table 21: Global Fire Blanket Revenue million Forecast, by Types 2020 & 2033
- Table 22: Global Fire Blanket Volume K Forecast, by Types 2020 & 2033
- Table 23: Global Fire Blanket Revenue million Forecast, by Country 2020 & 2033
- Table 24: Global Fire Blanket Volume K Forecast, by Country 2020 & 2033
- Table 25: Brazil Fire Blanket Revenue (million) Forecast, by Application 2020 & 2033
- Table 26: Brazil Fire Blanket Volume (K) Forecast, by Application 2020 & 2033
- Table 27: Argentina Fire Blanket Revenue (million) Forecast, by Application 2020 & 2033
- Table 28: Argentina Fire Blanket Volume (K) Forecast, by Application 2020 & 2033
- Table 29: Rest of South America Fire Blanket Revenue (million) Forecast, by Application 2020 & 2033
- Table 30: Rest of South America Fire Blanket Volume (K) Forecast, by Application 2020 & 2033
- Table 31: Global Fire Blanket Revenue million Forecast, by Application 2020 & 2033
- Table 32: Global Fire Blanket Volume K Forecast, by Application 2020 & 2033
- Table 33: Global Fire Blanket Revenue million Forecast, by Types 2020 & 2033
- Table 34: Global Fire Blanket Volume K Forecast, by Types 2020 & 2033
- Table 35: Global Fire Blanket Revenue million Forecast, by Country 2020 & 2033
- Table 36: Global Fire Blanket Volume K Forecast, by Country 2020 & 2033
- Table 37: United Kingdom Fire Blanket Revenue (million) Forecast, by Application 2020 & 2033
- Table 38: United Kingdom Fire Blanket Volume (K) Forecast, by Application 2020 & 2033
- Table 39: Germany Fire Blanket Revenue (million) Forecast, by Application 2020 & 2033
- Table 40: Germany Fire Blanket Volume (K) Forecast, by Application 2020 & 2033
- Table 41: France Fire Blanket Revenue (million) Forecast, by Application 2020 & 2033
- Table 42: France Fire Blanket Volume (K) Forecast, by Application 2020 & 2033
- Table 43: Italy Fire Blanket Revenue (million) Forecast, by Application 2020 & 2033
- Table 44: Italy Fire Blanket Volume (K) Forecast, by Application 2020 & 2033
- Table 45: Spain Fire Blanket Revenue (million) Forecast, by Application 2020 & 2033
- Table 46: Spain Fire Blanket Volume (K) Forecast, by Application 2020 & 2033
- Table 47: Russia Fire Blanket Revenue (million) Forecast, by Application 2020 & 2033
- Table 48: Russia Fire Blanket Volume (K) Forecast, by Application 2020 & 2033
- Table 49: Benelux Fire Blanket Revenue (million) Forecast, by Application 2020 & 2033
- Table 50: Benelux Fire Blanket Volume (K) Forecast, by Application 2020 & 2033
- Table 51: Nordics Fire Blanket Revenue (million) Forecast, by Application 2020 & 2033
- Table 52: Nordics Fire Blanket Volume (K) Forecast, by Application 2020 & 2033
- Table 53: Rest of Europe Fire Blanket Revenue (million) Forecast, by Application 2020 & 2033
- Table 54: Rest of Europe Fire Blanket Volume (K) Forecast, by Application 2020 & 2033
- Table 55: Global Fire Blanket Revenue million Forecast, by Application 2020 & 2033
- Table 56: Global Fire Blanket Volume K Forecast, by Application 2020 & 2033
- Table 57: Global Fire Blanket Revenue million Forecast, by Types 2020 & 2033
- Table 58: Global Fire Blanket Volume K Forecast, by Types 2020 & 2033
- Table 59: Global Fire Blanket Revenue million Forecast, by Country 2020 & 2033
- Table 60: Global Fire Blanket Volume K Forecast, by Country 2020 & 2033
- Table 61: Turkey Fire Blanket Revenue (million) Forecast, by Application 2020 & 2033
- Table 62: Turkey Fire Blanket Volume (K) Forecast, by Application 2020 & 2033
- Table 63: Israel Fire Blanket Revenue (million) Forecast, by Application 2020 & 2033
- Table 64: Israel Fire Blanket Volume (K) Forecast, by Application 2020 & 2033
- Table 65: GCC Fire Blanket Revenue (million) Forecast, by Application 2020 & 2033
- Table 66: GCC Fire Blanket Volume (K) Forecast, by Application 2020 & 2033
- Table 67: North Africa Fire Blanket Revenue (million) Forecast, by Application 2020 & 2033
- Table 68: North Africa Fire Blanket Volume (K) Forecast, by Application 2020 & 2033
- Table 69: South Africa Fire Blanket Revenue (million) Forecast, by Application 2020 & 2033
- Table 70: South Africa Fire Blanket Volume (K) Forecast, by Application 2020 & 2033
- Table 71: Rest of Middle East & Africa Fire Blanket Revenue (million) Forecast, by Application 2020 & 2033
- Table 72: Rest of Middle East & Africa Fire Blanket Volume (K) Forecast, by Application 2020 & 2033
- Table 73: Global Fire Blanket Revenue million Forecast, by Application 2020 & 2033
- Table 74: Global Fire Blanket Volume K Forecast, by Application 2020 & 2033
- Table 75: Global Fire Blanket Revenue million Forecast, by Types 2020 & 2033
- Table 76: Global Fire Blanket Volume K Forecast, by Types 2020 & 2033
- Table 77: Global Fire Blanket Revenue million Forecast, by Country 2020 & 2033
- Table 78: Global Fire Blanket Volume K Forecast, by Country 2020 & 2033
- Table 79: China Fire Blanket Revenue (million) Forecast, by Application 2020 & 2033
- Table 80: China Fire Blanket Volume (K) Forecast, by Application 2020 & 2033
- Table 81: India Fire Blanket Revenue (million) Forecast, by Application 2020 & 2033
- Table 82: India Fire Blanket Volume (K) Forecast, by Application 2020 & 2033
- Table 83: Japan Fire Blanket Revenue (million) Forecast, by Application 2020 & 2033
- Table 84: Japan Fire Blanket Volume (K) Forecast, by Application 2020 & 2033
- Table 85: South Korea Fire Blanket Revenue (million) Forecast, by Application 2020 & 2033
- Table 86: South Korea Fire Blanket Volume (K) Forecast, by Application 2020 & 2033
- Table 87: ASEAN Fire Blanket Revenue (million) Forecast, by Application 2020 & 2033
- Table 88: ASEAN Fire Blanket Volume (K) Forecast, by Application 2020 & 2033
- Table 89: Oceania Fire Blanket Revenue (million) Forecast, by Application 2020 & 2033
- Table 90: Oceania Fire Blanket Volume (K) Forecast, by Application 2020 & 2033
- Table 91: Rest of Asia Pacific Fire Blanket Revenue (million) Forecast, by Application 2020 & 2033
- Table 92: Rest of Asia Pacific Fire Blanket Volume (K) Forecast, by Application 2020 & 2033
Frequently Asked Questions
1. What is the projected Compound Annual Growth Rate (CAGR) of the Fire Blanket?
The projected CAGR is approximately XX%.
2. Which companies are prominent players in the Fire Blanket?
Key companies in the market include Tyco International, Kidde Safety, Honeywell Safety, ULINE, Hollinsend Fire Safety, Junkin Safety, Triangle Fire, Water Jel, Oberon, Acmetex, JACTONE, Safelincs, Acme United Corporation, KLEVERS-Italian, Yaoxing.
3. What are the main segments of the Fire Blanket?
The market segments include Application, Types.
4. Can you provide details about the market size?
The market size is estimated to be USD XXX million as of 2022.
5. What are some drivers contributing to market growth?
N/A
6. What are the notable trends driving market growth?
N/A
7. Are there any restraints impacting market growth?
N/A
8. Can you provide examples of recent developments in the market?
N/A
9. What pricing options are available for accessing the report?
Pricing options include single-user, multi-user, and enterprise licenses priced at USD 3350.00, USD 5025.00, and USD 6700.00 respectively.
10. Is the market size provided in terms of value or volume?
The market size is provided in terms of value, measured in million and volume, measured in K.
11. Are there any specific market keywords associated with the report?
Yes, the market keyword associated with the report is "Fire Blanket," which aids in identifying and referencing the specific market segment covered.
12. How do I determine which pricing option suits my needs best?
The pricing options vary based on user requirements and access needs. Individual users may opt for single-user licenses, while businesses requiring broader access may choose multi-user or enterprise licenses for cost-effective access to the report.
13. Are there any additional resources or data provided in the Fire Blanket report?
While the report offers comprehensive insights, it's advisable to review the specific contents or supplementary materials provided to ascertain if additional resources or data are available.
14. How can I stay updated on further developments or reports in the Fire Blanket?
To stay informed about further developments, trends, and reports in the Fire Blanket, consider subscribing to industry newsletters, following relevant companies and organizations, or regularly checking reputable industry news sources and publications.
Methodology
Step 1 - Identification of Relevant Samples Size from Population Database


Step 2 - Approaches for Defining Global Market Size (Value, Volume* & Price*)

Note*: In applicable scenarios
Step 3 - Data Sources
Primary Research
- Web Analytics
- Survey Reports
- Research Institute
- Latest Research Reports
- Opinion Leaders
Secondary Research
- Annual Reports
- White Paper
- Latest Press Release
- Industry Association
- Paid Database
- Investor Presentations

Step 4 - Data Triangulation
Involves using different sources of information in order to increase the validity of a study
These sources are likely to be stakeholders in a program - participants, other researchers, program staff, other community members, and so on.
Then we put all data in single framework & apply various statistical tools to find out the dynamic on the market.
During the analysis stage, feedback from the stakeholder groups would be compared to determine areas of agreement as well as areas of divergence

