

Key Insights
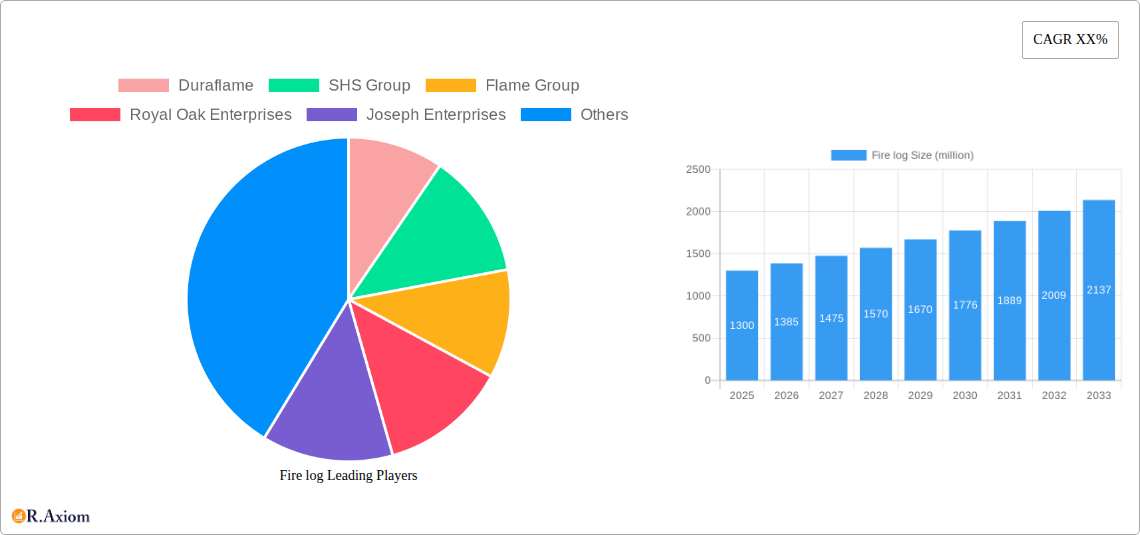
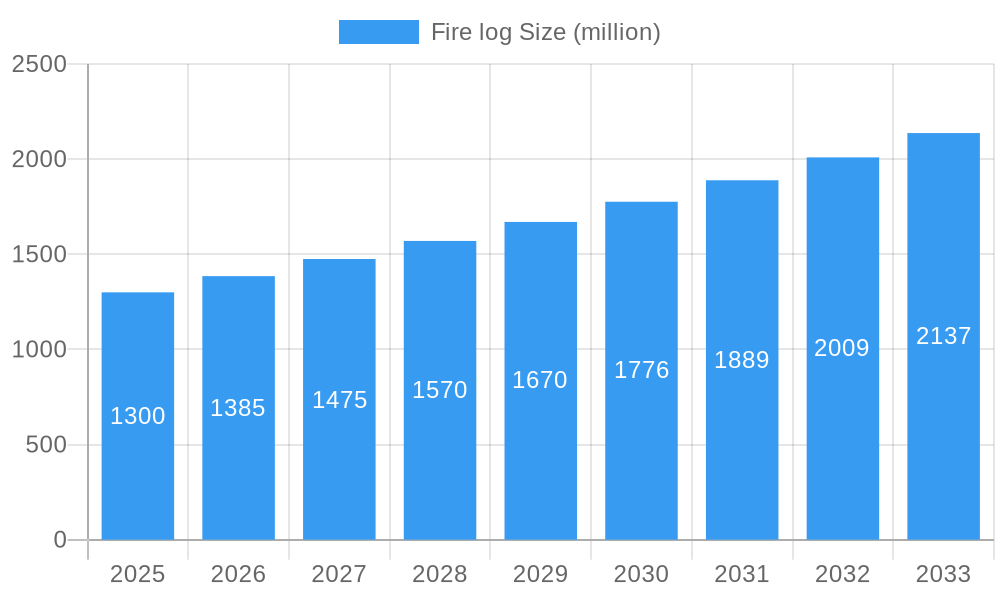
The global fire log market is experiencing robust growth, projected to reach an estimated market size of $1,300 million by 2025, with a Compound Annual Growth Rate (CAGR) of 6.5% anticipated over the forecast period of 2025-2033. This expansion is significantly driven by a growing consumer preference for convenient and eco-friendly heating solutions, particularly in residential settings. The "Compressed Sawdust Made" segment is leading the market, benefiting from advancements in sustainable manufacturing processes that transform waste wood into efficient burning logs. Furthermore, the "Sawdust and Paraffin Made" segment continues to hold a considerable share due to its established cost-effectiveness and widespread availability. The increasing awareness of environmental sustainability and the desire for cleaner burning fuels are acting as powerful catalysts, pushing consumers towards these alternatives over traditional firewood.
Fire log Market Size (In Billion)
The market's growth trajectory is further supported by emerging trends such as the development of advanced renewable biomass fiber logs that offer extended burn times and reduced emissions. While the market is generally expanding, potential restraints include fluctuating raw material prices for sawdust and paraffin, as well as regulatory hurdles related to emissions standards in certain regions. However, the widespread adoption of fire logs in North America and Europe, driven by colder climates and a strong established market for fireplaces and wood-burning stoves, is a key regional dominance. The Asia Pacific region is poised for significant growth, fueled by increasing disposable incomes and a rising interest in indoor heating and aesthetic fireplaces, presenting substantial opportunities for market players. Leading companies such as Duraflame, SHS Group, and Royal Oak Enterprises are actively investing in product innovation and expanding their distribution networks to capitalize on these evolving market dynamics and meet the growing demand for efficient and sustainable fire log solutions.
Fire log Company Market Share
Fire Log Market Analysis: Comprehensive Insights and Forecasts (2019-2033)
This comprehensive report offers an in-depth analysis of the global Fire Log market, covering historical trends, current dynamics, and future projections from 2019 to 2033. With a base year of 2025 and a forecast period spanning 2025-2033, this study is designed to equip industry stakeholders with actionable intelligence for strategic decision-making. We delve into market concentration, innovation drivers, segment-specific performance, and the competitive landscape, providing a detailed roadmap for navigating the evolving fire log industry.
Fire Log Market Concentration & Innovation
The global fire log market exhibits moderate concentration, with key players like Duraflame, SHS Group, Flame Group, Royal Oak Enterprises, and Joseph Enterprises holding significant market share. Innovation is primarily driven by the demand for eco-friendly and sustainable fire log alternatives, leading to advancements in compressed sawdust made logs, renewable biomass fibers made logs, and improved sawdust and paraffin made log formulations. Regulatory frameworks, particularly those concerning emissions and sustainability, play a crucial role in shaping product development and market entry strategies. Product substitutes, including natural firewood and electric fireplaces, present ongoing competitive pressures. End-user trends lean towards convenience, safety, and environmental consciousness. Mergers and acquisitions (M&A) are expected to remain a strategic tool for market consolidation and portfolio expansion, with estimated M&A deal values potentially reaching one hundred million over the forecast period.
Fire Log Industry Trends & Insights
The fire log industry is poised for robust growth, driven by several key factors. Increasing consumer preference for convenient and cleaner burning alternatives to traditional firewood fuels significant market expansion. The rising adoption of fireplaces and wood stoves in residential and commercial settings, particularly in regions with colder climates, further bolsters demand. Technological disruptions are evident in the development of more efficient and sustainable fire log manufacturing processes, leading to lower emissions and improved burn times. Market penetration for advanced fire log products, such as those made from renewable biomass fibers, is projected to increase. The Compound Annual Growth Rate (CAGR) for the fire log market is estimated to be around xx percent during the forecast period, indicating a healthy and sustained expansion. Competitive dynamics are characterized by a blend of established brands focusing on product innovation and market reach, and emerging players capitalizing on niche segments like eco-friendly products. The focus on enhancing user experience through ease of use, consistent burn quality, and minimal ash production will continue to shape product development and marketing strategies.
Dominant Markets & Segments in Fire Log
The Residential application segment is the dominant force within the fire log market, driven by widespread adoption in households for heating, ambiance, and recreational purposes. Economic policies promoting energy efficiency and home comfort, coupled with sustained growth in the construction of new homes and renovations, are key economic drivers supporting this dominance. Infrastructure development, such as the increasing availability of fireplaces and wood-burning stoves, further amplifies this trend.
Within the Types segmentation, Compressed Sawdust Made fire logs hold a significant market share due to their cost-effectiveness, consistent performance, and widespread availability. The development of improved binders and compression techniques enhances their burn quality and environmental profile.
The Commercial application segment, while smaller, is experiencing steady growth, fueled by the use of fire logs in restaurants, hotels, and recreational facilities to create inviting atmospheres. Government incentives for sustainable energy solutions and a growing emphasis on customer experience contribute to this segment's expansion.
Sawdust and Paraffin Made fire logs remain popular due to their ease of ignition and predictable burn, making them a preferred choice for consumers seeking convenience.
The Renewable Biomass Fibers Made segment represents a rapidly growing niche, driven by increasing environmental consciousness and regulatory support for sustainable products. Innovations in processing and utilization of agricultural waste and other biomass sources are propelling this segment's market penetration.
Fire Log Product Developments
Product innovations in the fire log market are increasingly focused on sustainability, convenience, and enhanced user experience. Developments include the creation of compressed sawdust logs with improved burn times and reduced emissions, and the exploration of novel renewable biomass fibers for eco-friendly alternatives. Companies are also enhancing the ease of ignition and consistency of burn for sawdust and paraffin made logs. These advancements aim to provide competitive advantages through superior performance, reduced environmental impact, and greater consumer appeal, directly addressing evolving market demands and regulatory trends.
Report Scope & Segmentation Analysis
This report segments the fire log market by Application and Type.
Residential Application: This segment encompasses fire logs used in homes for heating, ambiance, and recreation. Projections indicate continued strong growth, driven by homeowner preferences for convenience and aesthetics. Market size is estimated at one thousand million in the base year.
Commercial Application: This segment includes fire logs used in hospitality, retail, and other commercial establishments. While smaller, it shows promising growth due to increasing use for atmospheric enhancement. Market size is estimated at one hundred million in the base year.
Compressed Sawdust Made Types: This is a dominant segment, characterized by cost-effectiveness and consistent performance. Growth is driven by widespread adoption and ongoing product improvements. Market size is estimated at five hundred million in the base year.
Sawdust and Paraffin Made Types: This segment caters to the demand for ease of ignition and predictable burn. Its market size is estimated at three hundred million in the base year.
Renewable Biomass Fibers Made Types: This is a rapidly expanding segment, driven by sustainability trends and eco-conscious consumers. Significant growth is anticipated as technology and consumer awareness evolve. Market size is estimated at one hundred million in the base year.
Key Drivers of Fire Log Growth
The fire log market is propelled by several critical growth drivers. Technological advancements in manufacturing processes, leading to more sustainable and efficient fire logs, are paramount. Economic factors, such as rising disposable incomes and the increasing adoption of fireplaces for home heating and ambiance, contribute significantly. Regulatory frameworks promoting cleaner burning fuels and supporting sustainable energy solutions further incentivize market expansion. The growing consumer preference for convenience and ease of use over traditional firewood also plays a vital role, alongside an increasing awareness of the environmental benefits associated with renewable biomass-based fire logs.
Challenges in the Fire log Sector
Despite robust growth prospects, the fire log sector faces several challenges. Regulatory hurdles, particularly concerning emission standards and environmental certifications, can impact product development and market entry. Supply chain complexities for raw materials, including sustainable sourcing of biomass and sawdust, can lead to price volatility and availability issues. Intense competitive pressures from established players and substitute products like natural firewood and electric heating solutions require continuous innovation and cost management. Furthermore, consumer education regarding the benefits and proper usage of different fire log types remains an ongoing effort to maximize market penetration. The estimated impact of these challenges on market growth is xx percent annually.
Emerging Opportunities in Fire log
The fire log market presents significant emerging opportunities. The growing demand for eco-friendly and sustainable fire logs made from renewable biomass fibers offers a substantial growth avenue. Technological innovation in developing logs with extended burn times, reduced emissions, and enhanced aesthetic qualities will open new market segments. The expansion into new geographical markets with developing economies and increasing adoption of fireplaces presents untapped potential. Furthermore, exploring niche applications, such as decorative fire logs for specific events or specialized logs for camping and outdoor use, can drive incremental growth. The development of smart fire log solutions that integrate with home automation systems also represents a futuristic opportunity.
Leading Players in the Fire log Market
- Duraflame
- SHS Group
- Flame Group
- Royal Oak Enterprises
- Joseph Enterprises
- Enviro-Log
- CleanFlame
- Home Fire Prest Logs
- Fred Tebb & Sons
- EZ Firelogs
Key Developments in Fire log Industry
- 2023/10: Duraflame launches a new line of compressed sawdust logs with enhanced burn efficiency and reduced emissions.
- 2024/01: SHS Group acquires a key biomass processing facility to bolster its sustainable fire log production capabilities.
- 2024/04: Flame Group introduces innovative packaging solutions for its fire logs, improving product shelf-life and consumer convenience.
- 2024/07: Royal Oak Enterprises invests heavily in R&D for renewable biomass fiber fire logs, aiming to capture a larger market share in the eco-friendly segment.
- 2024/09: Joseph Enterprises expands its distribution network in emerging markets to cater to increasing demand for residential fire logs.
Strategic Outlook for Fire log Market
The strategic outlook for the fire log market is highly positive, characterized by sustained growth driven by evolving consumer preferences and technological advancements. The increasing emphasis on sustainability will continue to fuel demand for renewable biomass-based fire logs. Companies that invest in innovative product development, focus on eco-friendly manufacturing processes, and effectively leverage digital marketing to reach environmentally conscious consumers will be well-positioned for success. Expansion into developing regions and the exploration of niche applications will further contribute to market expansion. The industry's ability to adapt to regulatory changes and address supply chain challenges will be critical for long-term strategic advantage, promising a vibrant and growing market for years to come.
Fire log Segmentation
-
1. Application
- 1.1. Residential
- 1.2. Commercial
-
2. Types
- 2.1. Compressed Sawdust Made
- 2.2. Sawdust and Paraffin Made
- 2.3. Renewable Biomass Fibers Made
Fire log Segmentation By Geography
-
1. North America
- 1.1. United States
- 1.2. Canada
- 1.3. Mexico
-
2. South America
- 2.1. Brazil
- 2.2. Argentina
- 2.3. Rest of South America
-
3. Europe
- 3.1. United Kingdom
- 3.2. Germany
- 3.3. France
- 3.4. Italy
- 3.5. Spain
- 3.6. Russia
- 3.7. Benelux
- 3.8. Nordics
- 3.9. Rest of Europe
-
4. Middle East & Africa
- 4.1. Turkey
- 4.2. Israel
- 4.3. GCC
- 4.4. North Africa
- 4.5. South Africa
- 4.6. Rest of Middle East & Africa
-
5. Asia Pacific
- 5.1. China
- 5.2. India
- 5.3. Japan
- 5.4. South Korea
- 5.5. ASEAN
- 5.6. Oceania
- 5.7. Rest of Asia Pacific
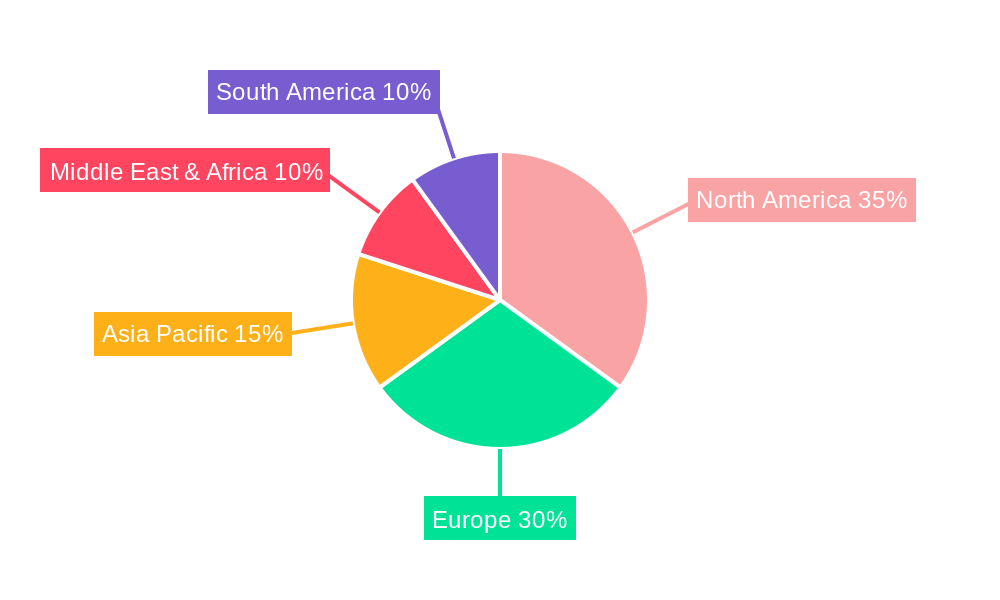
Fire log Regional Market Share
Geographic Coverage of Fire log
Fire log REPORT HIGHLIGHTS
| Aspects | Details |
|---|---|
| Study Period | 2020-2034 |
| Base Year | 2025 |
| Estimated Year | 2026 |
| Forecast Period | 2026-2034 |
| Historical Period | 2020-2025 |
| Growth Rate | CAGR of XX% from 2020-2034 |
| Segmentation |
|
Table of Contents
- 1. Introduction
- 1.1. Research Scope
- 1.2. Market Segmentation
- 1.3. Research Objective
- 1.4. Definitions and Assumptions
- 2. Executive Summary
- 2.1. Market Snapshot
- 3. Market Dynamics
- 3.1. Market Drivers
- 3.2. Market Restrains
- 3.3. Market Trends
- 3.4. Market Opportunities
- 4. Market Factor Analysis
- 4.1. Porters Five Forces
- 4.1.1. Bargaining Power of Suppliers
- 4.1.2. Bargaining Power of Buyers
- 4.1.3. Threat of New Entrants
- 4.1.4. Threat of Substitutes
- 4.1.5. Competitive Rivalry
- 4.2. PESTEL analysis
- 4.3. BCG Analysis
- 4.3.1. Stars (High Growth, High Market Share)
- 4.3.2. Cash Cows (Low Growth, High Market Share)
- 4.3.3. Question Mark (High Growth, Low Market Share)
- 4.3.4. Dogs (Low Growth, Low Market Share)
- 4.4. Ansoff Matrix Analysis
- 4.5. Supply Chain Analysis
- 4.6. Regulatory Landscape
- 4.7. Current Market Potential and Opportunity Assessment (TAM–SAM–SOM Framework)
- 4.8. RAX Analyst Note
- 4.1. Porters Five Forces
- 5. Market Analysis, Insights and Forecast 2021-2033
- 5.1. Market Analysis, Insights and Forecast - by Application
- 5.1.1. Residential
- 5.1.2. Commercial
- 5.2. Market Analysis, Insights and Forecast - by Types
- 5.2.1. Compressed Sawdust Made
- 5.2.2. Sawdust and Paraffin Made
- 5.2.3. Renewable Biomass Fibers Made
- 5.3. Market Analysis, Insights and Forecast - by Region
- 5.3.1. North America
- 5.3.2. South America
- 5.3.3. Europe
- 5.3.4. Middle East & Africa
- 5.3.5. Asia Pacific
- 5.1. Market Analysis, Insights and Forecast - by Application
- 6. Global Fire log Analysis, Insights and Forecast, 2021-2033
- 6.1. Market Analysis, Insights and Forecast - by Application
- 6.1.1. Residential
- 6.1.2. Commercial
- 6.2. Market Analysis, Insights and Forecast - by Types
- 6.2.1. Compressed Sawdust Made
- 6.2.2. Sawdust and Paraffin Made
- 6.2.3. Renewable Biomass Fibers Made
- 6.1. Market Analysis, Insights and Forecast - by Application
- 7. North America Fire log Analysis, Insights and Forecast, 2020-2032
- 7.1. Market Analysis, Insights and Forecast - by Application
- 7.1.1. Residential
- 7.1.2. Commercial
- 7.2. Market Analysis, Insights and Forecast - by Types
- 7.2.1. Compressed Sawdust Made
- 7.2.2. Sawdust and Paraffin Made
- 7.2.3. Renewable Biomass Fibers Made
- 7.1. Market Analysis, Insights and Forecast - by Application
- 8. South America Fire log Analysis, Insights and Forecast, 2020-2032
- 8.1. Market Analysis, Insights and Forecast - by Application
- 8.1.1. Residential
- 8.1.2. Commercial
- 8.2. Market Analysis, Insights and Forecast - by Types
- 8.2.1. Compressed Sawdust Made
- 8.2.2. Sawdust and Paraffin Made
- 8.2.3. Renewable Biomass Fibers Made
- 8.1. Market Analysis, Insights and Forecast - by Application
- 9. Europe Fire log Analysis, Insights and Forecast, 2020-2032
- 9.1. Market Analysis, Insights and Forecast - by Application
- 9.1.1. Residential
- 9.1.2. Commercial
- 9.2. Market Analysis, Insights and Forecast - by Types
- 9.2.1. Compressed Sawdust Made
- 9.2.2. Sawdust and Paraffin Made
- 9.2.3. Renewable Biomass Fibers Made
- 9.1. Market Analysis, Insights and Forecast - by Application
- 10. Middle East & Africa Fire log Analysis, Insights and Forecast, 2020-2032
- 10.1. Market Analysis, Insights and Forecast - by Application
- 10.1.1. Residential
- 10.1.2. Commercial
- 10.2. Market Analysis, Insights and Forecast - by Types
- 10.2.1. Compressed Sawdust Made
- 10.2.2. Sawdust and Paraffin Made
- 10.2.3. Renewable Biomass Fibers Made
- 10.1. Market Analysis, Insights and Forecast - by Application
- 11. Asia Pacific Fire log Analysis, Insights and Forecast, 2020-2032
- 11.1. Market Analysis, Insights and Forecast - by Application
- 11.1.1. Residential
- 11.1.2. Commercial
- 11.2. Market Analysis, Insights and Forecast - by Types
- 11.2.1. Compressed Sawdust Made
- 11.2.2. Sawdust and Paraffin Made
- 11.2.3. Renewable Biomass Fibers Made
- 11.1. Market Analysis, Insights and Forecast - by Application
- 12. Competitive Analysis
- 12.1. Company Profiles
- 12.1.1 Duraflame
- 12.1.1.1. Company Overview
- 12.1.1.2. Products
- 12.1.1.3. Company Financials
- 12.1.1.4. SWOT Analysis
- 12.1.2 SHS Group
- 12.1.2.1. Company Overview
- 12.1.2.2. Products
- 12.1.2.3. Company Financials
- 12.1.2.4. SWOT Analysis
- 12.1.3 Flame Group
- 12.1.3.1. Company Overview
- 12.1.3.2. Products
- 12.1.3.3. Company Financials
- 12.1.3.4. SWOT Analysis
- 12.1.4 Royal Oak Enterprises
- 12.1.4.1. Company Overview
- 12.1.4.2. Products
- 12.1.4.3. Company Financials
- 12.1.4.4. SWOT Analysis
- 12.1.5 Joseph Enterprises
- 12.1.5.1. Company Overview
- 12.1.5.2. Products
- 12.1.5.3. Company Financials
- 12.1.5.4. SWOT Analysis
- 12.1.6 Enviro-Log
- 12.1.6.1. Company Overview
- 12.1.6.2. Products
- 12.1.6.3. Company Financials
- 12.1.6.4. SWOT Analysis
- 12.1.7 CleanFlame
- 12.1.7.1. Company Overview
- 12.1.7.2. Products
- 12.1.7.3. Company Financials
- 12.1.7.4. SWOT Analysis
- 12.1.8 Home Fire Prest Logs
- 12.1.8.1. Company Overview
- 12.1.8.2. Products
- 12.1.8.3. Company Financials
- 12.1.8.4. SWOT Analysis
- 12.1.9 Fred Tebb & Sons
- 12.1.9.1. Company Overview
- 12.1.9.2. Products
- 12.1.9.3. Company Financials
- 12.1.9.4. SWOT Analysis
- 12.1.10 EZ Firelogs
- 12.1.10.1. Company Overview
- 12.1.10.2. Products
- 12.1.10.3. Company Financials
- 12.1.10.4. SWOT Analysis
- 12.1.1 Duraflame
- 12.2. Market Entropy
- 12.2.1 Company's Key Areas Served
- 12.2.2 Recent Developments
- 12.3. Company Market Share Analysis 2025
- 12.3.1 Top 5 Companies Market Share Analysis
- 12.3.2 Top 3 Companies Market Share Analysis
- 12.4. List of Potential Customers
- 13. Research Methodology
List of Figures
- Figure 1: Global Fire log Revenue Breakdown (million, %) by Region 2025 & 2033
- Figure 2: Global Fire log Volume Breakdown (K, %) by Region 2025 & 2033
- Figure 3: North America Fire log Revenue (million), by Application 2025 & 2033
- Figure 4: North America Fire log Volume (K), by Application 2025 & 2033
- Figure 5: North America Fire log Revenue Share (%), by Application 2025 & 2033
- Figure 6: North America Fire log Volume Share (%), by Application 2025 & 2033
- Figure 7: North America Fire log Revenue (million), by Types 2025 & 2033
- Figure 8: North America Fire log Volume (K), by Types 2025 & 2033
- Figure 9: North America Fire log Revenue Share (%), by Types 2025 & 2033
- Figure 10: North America Fire log Volume Share (%), by Types 2025 & 2033
- Figure 11: North America Fire log Revenue (million), by Country 2025 & 2033
- Figure 12: North America Fire log Volume (K), by Country 2025 & 2033
- Figure 13: North America Fire log Revenue Share (%), by Country 2025 & 2033
- Figure 14: North America Fire log Volume Share (%), by Country 2025 & 2033
- Figure 15: South America Fire log Revenue (million), by Application 2025 & 2033
- Figure 16: South America Fire log Volume (K), by Application 2025 & 2033
- Figure 17: South America Fire log Revenue Share (%), by Application 2025 & 2033
- Figure 18: South America Fire log Volume Share (%), by Application 2025 & 2033
- Figure 19: South America Fire log Revenue (million), by Types 2025 & 2033
- Figure 20: South America Fire log Volume (K), by Types 2025 & 2033
- Figure 21: South America Fire log Revenue Share (%), by Types 2025 & 2033
- Figure 22: South America Fire log Volume Share (%), by Types 2025 & 2033
- Figure 23: South America Fire log Revenue (million), by Country 2025 & 2033
- Figure 24: South America Fire log Volume (K), by Country 2025 & 2033
- Figure 25: South America Fire log Revenue Share (%), by Country 2025 & 2033
- Figure 26: South America Fire log Volume Share (%), by Country 2025 & 2033
- Figure 27: Europe Fire log Revenue (million), by Application 2025 & 2033
- Figure 28: Europe Fire log Volume (K), by Application 2025 & 2033
- Figure 29: Europe Fire log Revenue Share (%), by Application 2025 & 2033
- Figure 30: Europe Fire log Volume Share (%), by Application 2025 & 2033
- Figure 31: Europe Fire log Revenue (million), by Types 2025 & 2033
- Figure 32: Europe Fire log Volume (K), by Types 2025 & 2033
- Figure 33: Europe Fire log Revenue Share (%), by Types 2025 & 2033
- Figure 34: Europe Fire log Volume Share (%), by Types 2025 & 2033
- Figure 35: Europe Fire log Revenue (million), by Country 2025 & 2033
- Figure 36: Europe Fire log Volume (K), by Country 2025 & 2033
- Figure 37: Europe Fire log Revenue Share (%), by Country 2025 & 2033
- Figure 38: Europe Fire log Volume Share (%), by Country 2025 & 2033
- Figure 39: Middle East & Africa Fire log Revenue (million), by Application 2025 & 2033
- Figure 40: Middle East & Africa Fire log Volume (K), by Application 2025 & 2033
- Figure 41: Middle East & Africa Fire log Revenue Share (%), by Application 2025 & 2033
- Figure 42: Middle East & Africa Fire log Volume Share (%), by Application 2025 & 2033
- Figure 43: Middle East & Africa Fire log Revenue (million), by Types 2025 & 2033
- Figure 44: Middle East & Africa Fire log Volume (K), by Types 2025 & 2033
- Figure 45: Middle East & Africa Fire log Revenue Share (%), by Types 2025 & 2033
- Figure 46: Middle East & Africa Fire log Volume Share (%), by Types 2025 & 2033
- Figure 47: Middle East & Africa Fire log Revenue (million), by Country 2025 & 2033
- Figure 48: Middle East & Africa Fire log Volume (K), by Country 2025 & 2033
- Figure 49: Middle East & Africa Fire log Revenue Share (%), by Country 2025 & 2033
- Figure 50: Middle East & Africa Fire log Volume Share (%), by Country 2025 & 2033
- Figure 51: Asia Pacific Fire log Revenue (million), by Application 2025 & 2033
- Figure 52: Asia Pacific Fire log Volume (K), by Application 2025 & 2033
- Figure 53: Asia Pacific Fire log Revenue Share (%), by Application 2025 & 2033
- Figure 54: Asia Pacific Fire log Volume Share (%), by Application 2025 & 2033
- Figure 55: Asia Pacific Fire log Revenue (million), by Types 2025 & 2033
- Figure 56: Asia Pacific Fire log Volume (K), by Types 2025 & 2033
- Figure 57: Asia Pacific Fire log Revenue Share (%), by Types 2025 & 2033
- Figure 58: Asia Pacific Fire log Volume Share (%), by Types 2025 & 2033
- Figure 59: Asia Pacific Fire log Revenue (million), by Country 2025 & 2033
- Figure 60: Asia Pacific Fire log Volume (K), by Country 2025 & 2033
- Figure 61: Asia Pacific Fire log Revenue Share (%), by Country 2025 & 2033
- Figure 62: Asia Pacific Fire log Volume Share (%), by Country 2025 & 2033
List of Tables
- Table 1: Global Fire log Revenue million Forecast, by Application 2020 & 2033
- Table 2: Global Fire log Volume K Forecast, by Application 2020 & 2033
- Table 3: Global Fire log Revenue million Forecast, by Types 2020 & 2033
- Table 4: Global Fire log Volume K Forecast, by Types 2020 & 2033
- Table 5: Global Fire log Revenue million Forecast, by Region 2020 & 2033
- Table 6: Global Fire log Volume K Forecast, by Region 2020 & 2033
- Table 7: Global Fire log Revenue million Forecast, by Application 2020 & 2033
- Table 8: Global Fire log Volume K Forecast, by Application 2020 & 2033
- Table 9: Global Fire log Revenue million Forecast, by Types 2020 & 2033
- Table 10: Global Fire log Volume K Forecast, by Types 2020 & 2033
- Table 11: Global Fire log Revenue million Forecast, by Country 2020 & 2033
- Table 12: Global Fire log Volume K Forecast, by Country 2020 & 2033
- Table 13: United States Fire log Revenue (million) Forecast, by Application 2020 & 2033
- Table 14: United States Fire log Volume (K) Forecast, by Application 2020 & 2033
- Table 15: Canada Fire log Revenue (million) Forecast, by Application 2020 & 2033
- Table 16: Canada Fire log Volume (K) Forecast, by Application 2020 & 2033
- Table 17: Mexico Fire log Revenue (million) Forecast, by Application 2020 & 2033
- Table 18: Mexico Fire log Volume (K) Forecast, by Application 2020 & 2033
- Table 19: Global Fire log Revenue million Forecast, by Application 2020 & 2033
- Table 20: Global Fire log Volume K Forecast, by Application 2020 & 2033
- Table 21: Global Fire log Revenue million Forecast, by Types 2020 & 2033
- Table 22: Global Fire log Volume K Forecast, by Types 2020 & 2033
- Table 23: Global Fire log Revenue million Forecast, by Country 2020 & 2033
- Table 24: Global Fire log Volume K Forecast, by Country 2020 & 2033
- Table 25: Brazil Fire log Revenue (million) Forecast, by Application 2020 & 2033
- Table 26: Brazil Fire log Volume (K) Forecast, by Application 2020 & 2033
- Table 27: Argentina Fire log Revenue (million) Forecast, by Application 2020 & 2033
- Table 28: Argentina Fire log Volume (K) Forecast, by Application 2020 & 2033
- Table 29: Rest of South America Fire log Revenue (million) Forecast, by Application 2020 & 2033
- Table 30: Rest of South America Fire log Volume (K) Forecast, by Application 2020 & 2033
- Table 31: Global Fire log Revenue million Forecast, by Application 2020 & 2033
- Table 32: Global Fire log Volume K Forecast, by Application 2020 & 2033
- Table 33: Global Fire log Revenue million Forecast, by Types 2020 & 2033
- Table 34: Global Fire log Volume K Forecast, by Types 2020 & 2033
- Table 35: Global Fire log Revenue million Forecast, by Country 2020 & 2033
- Table 36: Global Fire log Volume K Forecast, by Country 2020 & 2033
- Table 37: United Kingdom Fire log Revenue (million) Forecast, by Application 2020 & 2033
- Table 38: United Kingdom Fire log Volume (K) Forecast, by Application 2020 & 2033
- Table 39: Germany Fire log Revenue (million) Forecast, by Application 2020 & 2033
- Table 40: Germany Fire log Volume (K) Forecast, by Application 2020 & 2033
- Table 41: France Fire log Revenue (million) Forecast, by Application 2020 & 2033
- Table 42: France Fire log Volume (K) Forecast, by Application 2020 & 2033
- Table 43: Italy Fire log Revenue (million) Forecast, by Application 2020 & 2033
- Table 44: Italy Fire log Volume (K) Forecast, by Application 2020 & 2033
- Table 45: Spain Fire log Revenue (million) Forecast, by Application 2020 & 2033
- Table 46: Spain Fire log Volume (K) Forecast, by Application 2020 & 2033
- Table 47: Russia Fire log Revenue (million) Forecast, by Application 2020 & 2033
- Table 48: Russia Fire log Volume (K) Forecast, by Application 2020 & 2033
- Table 49: Benelux Fire log Revenue (million) Forecast, by Application 2020 & 2033
- Table 50: Benelux Fire log Volume (K) Forecast, by Application 2020 & 2033
- Table 51: Nordics Fire log Revenue (million) Forecast, by Application 2020 & 2033
- Table 52: Nordics Fire log Volume (K) Forecast, by Application 2020 & 2033
- Table 53: Rest of Europe Fire log Revenue (million) Forecast, by Application 2020 & 2033
- Table 54: Rest of Europe Fire log Volume (K) Forecast, by Application 2020 & 2033
- Table 55: Global Fire log Revenue million Forecast, by Application 2020 & 2033
- Table 56: Global Fire log Volume K Forecast, by Application 2020 & 2033
- Table 57: Global Fire log Revenue million Forecast, by Types 2020 & 2033
- Table 58: Global Fire log Volume K Forecast, by Types 2020 & 2033
- Table 59: Global Fire log Revenue million Forecast, by Country 2020 & 2033
- Table 60: Global Fire log Volume K Forecast, by Country 2020 & 2033
- Table 61: Turkey Fire log Revenue (million) Forecast, by Application 2020 & 2033
- Table 62: Turkey Fire log Volume (K) Forecast, by Application 2020 & 2033
- Table 63: Israel Fire log Revenue (million) Forecast, by Application 2020 & 2033
- Table 64: Israel Fire log Volume (K) Forecast, by Application 2020 & 2033
- Table 65: GCC Fire log Revenue (million) Forecast, by Application 2020 & 2033
- Table 66: GCC Fire log Volume (K) Forecast, by Application 2020 & 2033
- Table 67: North Africa Fire log Revenue (million) Forecast, by Application 2020 & 2033
- Table 68: North Africa Fire log Volume (K) Forecast, by Application 2020 & 2033
- Table 69: South Africa Fire log Revenue (million) Forecast, by Application 2020 & 2033
- Table 70: South Africa Fire log Volume (K) Forecast, by Application 2020 & 2033
- Table 71: Rest of Middle East & Africa Fire log Revenue (million) Forecast, by Application 2020 & 2033
- Table 72: Rest of Middle East & Africa Fire log Volume (K) Forecast, by Application 2020 & 2033
- Table 73: Global Fire log Revenue million Forecast, by Application 2020 & 2033
- Table 74: Global Fire log Volume K Forecast, by Application 2020 & 2033
- Table 75: Global Fire log Revenue million Forecast, by Types 2020 & 2033
- Table 76: Global Fire log Volume K Forecast, by Types 2020 & 2033
- Table 77: Global Fire log Revenue million Forecast, by Country 2020 & 2033
- Table 78: Global Fire log Volume K Forecast, by Country 2020 & 2033
- Table 79: China Fire log Revenue (million) Forecast, by Application 2020 & 2033
- Table 80: China Fire log Volume (K) Forecast, by Application 2020 & 2033
- Table 81: India Fire log Revenue (million) Forecast, by Application 2020 & 2033
- Table 82: India Fire log Volume (K) Forecast, by Application 2020 & 2033
- Table 83: Japan Fire log Revenue (million) Forecast, by Application 2020 & 2033
- Table 84: Japan Fire log Volume (K) Forecast, by Application 2020 & 2033
- Table 85: South Korea Fire log Revenue (million) Forecast, by Application 2020 & 2033
- Table 86: South Korea Fire log Volume (K) Forecast, by Application 2020 & 2033
- Table 87: ASEAN Fire log Revenue (million) Forecast, by Application 2020 & 2033
- Table 88: ASEAN Fire log Volume (K) Forecast, by Application 2020 & 2033
- Table 89: Oceania Fire log Revenue (million) Forecast, by Application 2020 & 2033
- Table 90: Oceania Fire log Volume (K) Forecast, by Application 2020 & 2033
- Table 91: Rest of Asia Pacific Fire log Revenue (million) Forecast, by Application 2020 & 2033
- Table 92: Rest of Asia Pacific Fire log Volume (K) Forecast, by Application 2020 & 2033
Frequently Asked Questions
1. What is the projected Compound Annual Growth Rate (CAGR) of the Fire log?
The projected CAGR is approximately XX%.
2. Which companies are prominent players in the Fire log?
Key companies in the market include Duraflame, SHS Group, Flame Group, Royal Oak Enterprises, Joseph Enterprises, Enviro-Log, CleanFlame, Home Fire Prest Logs, Fred Tebb & Sons, EZ Firelogs.
3. What are the main segments of the Fire log?
The market segments include Application, Types.
4. Can you provide details about the market size?
The market size is estimated to be USD XXX million as of 2022.
5. What are some drivers contributing to market growth?
N/A
6. What are the notable trends driving market growth?
N/A
7. Are there any restraints impacting market growth?
N/A
8. Can you provide examples of recent developments in the market?
N/A
9. What pricing options are available for accessing the report?
Pricing options include single-user, multi-user, and enterprise licenses priced at USD 3350.00, USD 5025.00, and USD 6700.00 respectively.
10. Is the market size provided in terms of value or volume?
The market size is provided in terms of value, measured in million and volume, measured in K.
11. Are there any specific market keywords associated with the report?
Yes, the market keyword associated with the report is "Fire log," which aids in identifying and referencing the specific market segment covered.
12. How do I determine which pricing option suits my needs best?
The pricing options vary based on user requirements and access needs. Individual users may opt for single-user licenses, while businesses requiring broader access may choose multi-user or enterprise licenses for cost-effective access to the report.
13. Are there any additional resources or data provided in the Fire log report?
While the report offers comprehensive insights, it's advisable to review the specific contents or supplementary materials provided to ascertain if additional resources or data are available.
14. How can I stay updated on further developments or reports in the Fire log?
To stay informed about further developments, trends, and reports in the Fire log, consider subscribing to industry newsletters, following relevant companies and organizations, or regularly checking reputable industry news sources and publications.
Methodology
Step 1 - Identification of Relevant Samples Size from Population Database


Step 2 - Approaches for Defining Global Market Size (Value, Volume* & Price*)

Note*: In applicable scenarios
Step 3 - Data Sources
Primary Research
- Web Analytics
- Survey Reports
- Research Institute
- Latest Research Reports
- Opinion Leaders
Secondary Research
- Annual Reports
- White Paper
- Latest Press Release
- Industry Association
- Paid Database
- Investor Presentations

Step 4 - Data Triangulation
Involves using different sources of information in order to increase the validity of a study
These sources are likely to be stakeholders in a program - participants, other researchers, program staff, other community members, and so on.
Then we put all data in single framework & apply various statistical tools to find out the dynamic on the market.
During the analysis stage, feedback from the stakeholder groups would be compared to determine areas of agreement as well as areas of divergence