

Key Insights
The global fire pit market is experiencing robust growth, projected to reach an estimated market size of USD 2.5 billion by 2025, with a Compound Annual Growth Rate (CAGR) of 6.5% anticipated through 2033. This expansion is primarily fueled by the increasing consumer desire for enhanced outdoor living spaces and the growing popularity of alfresco dining and entertainment. The residential sector represents the largest application segment, driven by homeowners investing in backyard renovations and seeking to create cozy, inviting atmospheres for relaxation and social gatherings. Wood-burning fire pits continue to hold a significant market share due to their traditional appeal and ambiance, while gas fire pits are gaining traction rapidly due to their convenience, ease of use, and safety features. The "Other" category, encompassing propane and electric fire pits, also contributes to market diversity, catering to a broader range of consumer preferences and installation requirements.
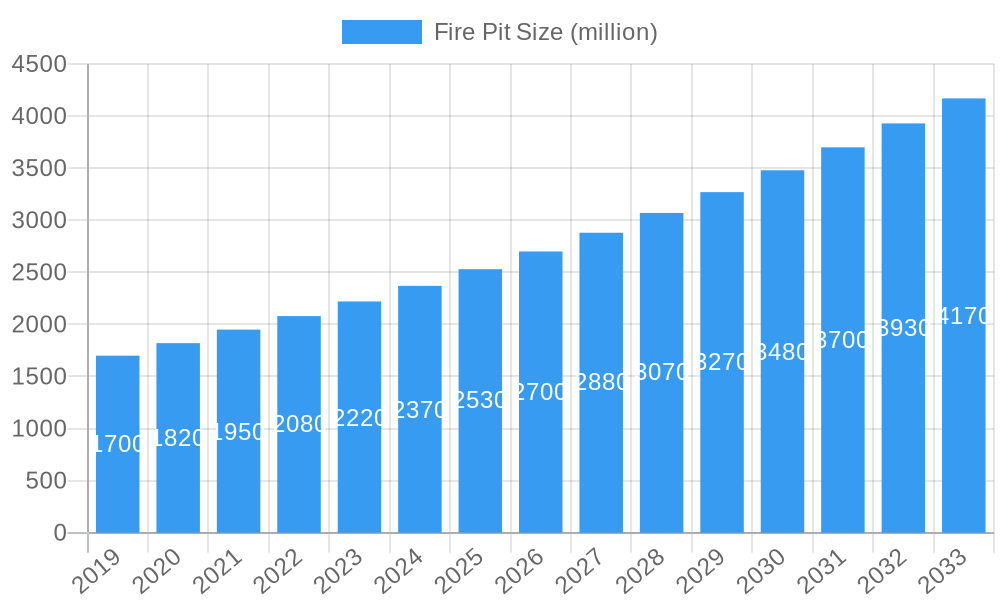
Fire Pit Market Size (In Billion)
The market is further propelled by evolving lifestyle trends, with a greater emphasis on home-based leisure and outdoor activities. The COVID-19 pandemic, in particular, accelerated this trend as individuals sought to maximize their home environments. Key drivers include rising disposable incomes, increasing urbanization leading to smaller living spaces that benefit from optimized outdoor areas, and a growing awareness of the aesthetic and functional benefits of fire pits. However, the market also faces certain restraints, such as fluctuating raw material costs and increasing regulatory scrutiny regarding emissions and safety standards, particularly for wood-burning models. Geographically, North America, with its strong culture of outdoor living and established market for patio accessories, is expected to dominate, followed by Europe. The Asia Pacific region presents significant growth potential, driven by rising living standards and a burgeoning middle class eager to adopt Western lifestyle trends.
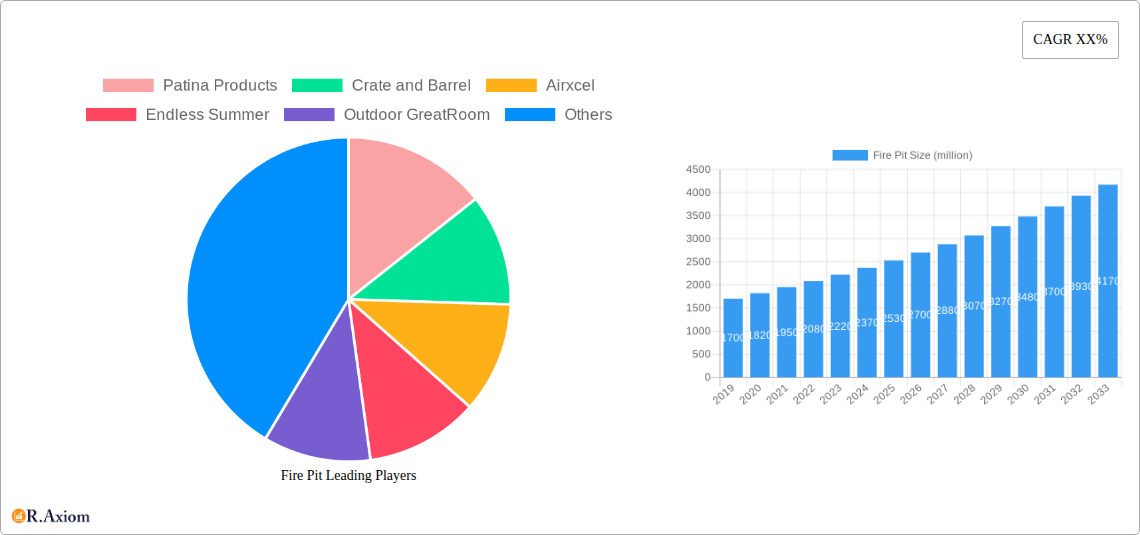
Fire Pit Company Market Share
Fire Pit Market Concentration & Innovation
The global fire pit market exhibits a moderate level of concentration, with several key players vying for market share. Major companies like Patina Products, Crate and Barrel, Airxcel, and Endless Summer are prominent. Innovation in the fire pit industry is primarily driven by advancements in fuel efficiency, safety features, and aesthetic designs. The integration of smart technology, such as remote ignition and adjustable flame control, is a significant innovation driver, projected to reach a market value of $800 million by 2028. Regulatory frameworks, particularly concerning emissions and outdoor fire safety, are also shaping product development, with a growing emphasis on eco-friendly and compliant designs. Product substitutes, including patio heaters and outdoor fireplaces, present a moderate competitive threat, with an estimated 15% of the outdoor heating market share held by these alternatives. End-user trends lean towards convenience, durability, and aesthetic appeal, with a rising demand for portable and multi-functional fire pits. Mergers and acquisitions (M&A) activity within the sector is expected to increase, driven by consolidation and the pursuit of market expansion. The estimated M&A deal value in the last two years has been approximately $120 million.
Fire Pit Industry Trends & Insights
The global fire pit industry is poised for robust growth, fueled by several interconnected trends. The increasing popularity of outdoor living spaces, amplified by a growing desire for home-based entertainment and relaxation, serves as a primary market growth driver. This trend is particularly evident in urban and suburban areas where individuals are investing heavily in their backyards, transforming them into functional and aesthetically pleasing extensions of their homes. The market penetration of fire pits has steadily increased, reaching an estimated 30% of households with outdoor spaces in developed economies. Technological disruptions are playing a crucial role, with the development of advanced ignition systems, remote controls, and the integration of smart home functionalities. Gas fire pits, in particular, are experiencing a surge in demand due to their convenience, ease of use, and consistent heat output, projected to capture 65% of the market by 2030. Consumer preferences are shifting towards sustainable and energy-efficient models, with a growing awareness of environmental impact influencing purchasing decisions. Furthermore, the demand for aesthetically diverse designs, ranging from minimalist modern to rustic traditional, is driving product innovation. The competitive dynamics within the industry are characterized by a blend of established brands and emerging players, with new entrants often focusing on niche markets or innovative product offerings. The Compound Annual Growth Rate (CAGR) for the global fire pit market is estimated to be 7.5% over the forecast period. The increasing availability of online retail channels has also democratized access, allowing consumers to easily compare prices and features, thereby intensifying competition. Outdoor GreatRoom and Bond Manufacturing are at the forefront of offering integrated solutions that combine fire pits with other outdoor furniture elements, enhancing their market appeal. The estimated market size for fire pits in the historical period (2019-2024) was approximately $3.5 billion.
Dominant Markets & Segments in Fire Pit
The fire pit market is experiencing significant growth across various regions and segments, driven by diverse economic, social, and environmental factors.
Leading Region: North America
North America currently dominates the global fire pit market, with the United States and Canada being the primary contributors. This dominance is attributed to several key drivers:
- Strong Outdoor Living Culture: A deeply ingrained culture of outdoor entertaining and a widespread availability of spacious backyards in North America create a substantial demand for fire pits. The average household expenditure on outdoor living spaces in the U.S. has risen by an estimated 20% since 2020.
- Favorable Economic Conditions: Robust disposable incomes and a strong housing market in these regions enable consumers to invest in premium outdoor amenities like fire pits. The median home price in key U.S. metropolitan areas has seen an appreciation of approximately 10% annually.
- Mild to Moderate Climates: Many parts of North America enjoy extended periods of pleasant weather, conducive to year-round or near year-round use of outdoor heating solutions. Cities like Los Angeles and Phoenix see an average of 300 sunny days per year.
- Effective Marketing and Retail Presence: Leading companies like Crate and Barrel, Outdoor GreatRoom, and AmazonBasics have established strong brand presence and extensive distribution networks across North America, making fire pits readily accessible to consumers.
Dominant Segment: Residential Application
Within the application segment, the residential sector overwhelmingly dominates the fire pit market.
- Growth Drivers: The primary driver is the escalating trend of homeowners investing in creating comfortable and engaging outdoor living spaces. This includes patios, decks, and gardens, where fire pits serve as a focal point for social gatherings and relaxation. The spending on home improvement and backyard enhancements in the residential sector has been growing at a rate of 8% per annum.
- Consumer Preferences: Homeowners prioritize aesthetics, functionality, and ease of use. Portable and gas-powered fire pits are particularly popular due to their versatility and convenience for everyday use and entertaining. The adoption rate of gas fire pits in new home constructions has seen a 15% increase over the past three years.
- Market Penetration: The penetration of fire pits in the residential sector continues to rise, with an estimated 40% of new homes featuring some form of outdoor heating element.
Dominant Segment: Gas Fire Pits
In terms of product types, gas fire pits are leading the market and are projected to maintain their dominance.
- Growth Drivers: The convenience of instant ignition, adjustable heat settings, and minimal cleanup associated with gas fire pits makes them highly attractive to consumers. The rise in natural gas infrastructure and the availability of propane tanks further support their widespread adoption. The market share of gas fire pits is expected to reach 65% by 2030.
- Technological Advancements: Innovations in burner technology, safety features, and remote control systems are enhancing the appeal of gas fire pits. Companies like Airxcel and Fire Sense are investing in R&D to offer more sophisticated and efficient models.
- Regulatory Compliance: Gas fire pits often comply with stricter environmental regulations regarding emissions and smoke compared to traditional wood-burning alternatives, making them a preferred choice in many urban and suburban areas.
Fire Pit Product Developments
The fire pit sector is witnessing a wave of product innovations focused on enhancing user experience and market appeal. Key developments include the introduction of smart fire pits with app-controlled ignition and flame adjustment, offering unparalleled convenience. There's a significant trend towards durable, weather-resistant materials and modular designs that allow for customization and easy integration into diverse outdoor aesthetics. Increased emphasis on energy efficiency and eco-friendly fuel sources, such as natural gas and propane, is also evident. These advancements cater to growing consumer demand for convenience, sustainability, and personalized outdoor living solutions, giving manufacturers like Designing Fire and American Fyre Designs a competitive edge.
Report Scope & Segmentation Analysis
This report provides a comprehensive analysis of the global fire pit market, encompassing key segments and their projected growth trajectories.
Application Segmentation:
- Residential: This segment is anticipated to continue its dominance, driven by the persistent trend of outdoor living and home enhancement. Market size for residential applications is projected to reach $5.2 billion by 2030, with a CAGR of 8.0%. Competitive dynamics involve a mix of premium brands and budget-friendly options.
- Commercial: This segment, including hospitality, restaurants, and public spaces, is expected to experience steady growth, driven by the desire to enhance customer experience and ambiance. Projected market size for commercial applications is $1.8 billion by 2030, with a CAGR of 6.5%.
Type Segmentation:
- Wood Burning Fire Pits: While traditional, this segment is expected to see moderate growth, appealing to consumers seeking the authentic fire experience. Market size projected at $1.5 billion by 2030, with a CAGR of 4.0%. Competitive landscape features established manufacturers and DIY enthusiasts.
- Gas Fire Pits: This segment is projected for significant expansion due to convenience, ease of use, and cleaner burning. Market size anticipated at $4.8 billion by 2030, with a CAGR of 9.0%. Competition is intense, with innovation in burner technology and safety features.
- Other: This category includes propane fire pits, electric fire pits, and hybrid models. This segment is expected to show dynamic growth as new technologies emerge. Projected market size at $0.7 billion by 2030, with a CAGR of 7.0%.
Key Drivers of Fire Pit Growth
Several interconnected factors are propelling the growth of the fire pit market. The escalating desire for enhanced outdoor living spaces, driven by a post-pandemic focus on home as a sanctuary, is a primary catalyst. Technological advancements in ignition systems, smart features, and energy efficiency are making fire pits more convenient and appealing. Economic factors, including rising disposable incomes and a robust housing market, enable greater consumer spending on home improvements and leisure products. Furthermore, an increasing awareness of sustainability is driving demand for eco-friendlier fuel options and efficient designs. The regulatory landscape, which sometimes favors cleaner burning options like gas, also plays a role in segment growth.
Challenges in the Fire Pit Sector
Despite its promising growth, the fire pit sector faces several challenges. Stringent and varying environmental regulations regarding emissions and safety can hinder product development and market entry in certain regions. Fluctuations in raw material costs, such as steel and propane, can impact manufacturing profitability and pricing. Intense competition from established brands and new entrants, coupled with price sensitivity among some consumer segments, exerts downward pressure on margins. Furthermore, supply chain disruptions, as experienced in recent years, can affect production timelines and product availability, impacting sales volumes. The estimated annual impact of supply chain disruptions on the market is approximately $50 million in lost revenue.
Emerging Opportunities in Fire Pit
Emerging opportunities within the fire pit market are ripe for exploration. The growing trend of smart home integration presents a significant avenue for innovation, allowing for app-controlled and voice-activated fire pits. The expansion into emerging markets in Asia and Latin America, where outdoor living is gaining traction, offers substantial untapped potential. The development of aesthetically versatile and customizable fire pit designs to cater to diverse interior and exterior décor trends is another key opportunity. Furthermore, the increasing consumer interest in sustainable and portable fire pit solutions, particularly for smaller urban spaces, presents a niche market poised for growth.
Leading Players in the Fire Pit Market
- Patina Products
- Crate and Barrel
- Airxcel
- Endless Summer
- Outdoor GreatRoom
- Bond Manufacturing
- GHP Group
- Landmann
- AmazonBasics
- Frepits UK
- American Fyre Designs
- Fire Sense
- Designing Fire
- ZheJiang Yayi
- Shinerich Industrial
- Jiangsu Gardensun
- Camplux Machinery and Electric
- Best Choice Products
- TACKLIFE
- YAHEETECH
- KINGSO
Key Developments in Fire Pit Industry
- 2023 Q4: Launch of smart gas fire pits with integrated Bluetooth connectivity and mobile app control, enhancing user convenience and safety.
- 2023 Q3: Introduction of portable, lightweight fire pits made from recycled materials, catering to the eco-conscious consumer.
- 2022 Q4: Major manufacturers invest in enhancing burner efficiency for gas fire pits, aiming for reduced fuel consumption and cost savings for consumers.
- 2022 Q2: Increased focus on modular fire pit designs, allowing for customization and integration with outdoor furniture sets.
- 2021 Q4: Expansion of product lines to include electric fire pits with realistic flame effects, targeting indoor and balcony use.
- 2020 Q3: Several companies report a significant surge in demand for outdoor heating solutions due to increased home-based activities.
Strategic Outlook for Fire Pit Market
The strategic outlook for the fire pit market remains exceptionally positive, driven by enduring trends in outdoor living and continuous product innovation. The market is poised for sustained growth as consumers increasingly prioritize creating comfortable and aesthetically pleasing outdoor spaces. The integration of smart technology and a focus on sustainability will be key differentiators for manufacturers. Expansion into developing regions and the catering to niche demands for portable and electric solutions represent significant growth catalysts, ensuring a dynamic and evolving market landscape.
Fire Pit Segmentation
-
1. Application
- 1.1. Residential
- 1.2. Commercial
-
2. Types
- 2.1. Wood Burning Fire Pits
- 2.2. Gas Fire Pits
- 2.3. Other
Fire Pit Segmentation By Geography
-
1. North America
- 1.1. United States
- 1.2. Canada
- 1.3. Mexico
-
2. South America
- 2.1. Brazil
- 2.2. Argentina
- 2.3. Rest of South America
-
3. Europe
- 3.1. United Kingdom
- 3.2. Germany
- 3.3. France
- 3.4. Italy
- 3.5. Spain
- 3.6. Russia
- 3.7. Benelux
- 3.8. Nordics
- 3.9. Rest of Europe
-
4. Middle East & Africa
- 4.1. Turkey
- 4.2. Israel
- 4.3. GCC
- 4.4. North Africa
- 4.5. South Africa
- 4.6. Rest of Middle East & Africa
-
5. Asia Pacific
- 5.1. China
- 5.2. India
- 5.3. Japan
- 5.4. South Korea
- 5.5. ASEAN
- 5.6. Oceania
- 5.7. Rest of Asia Pacific
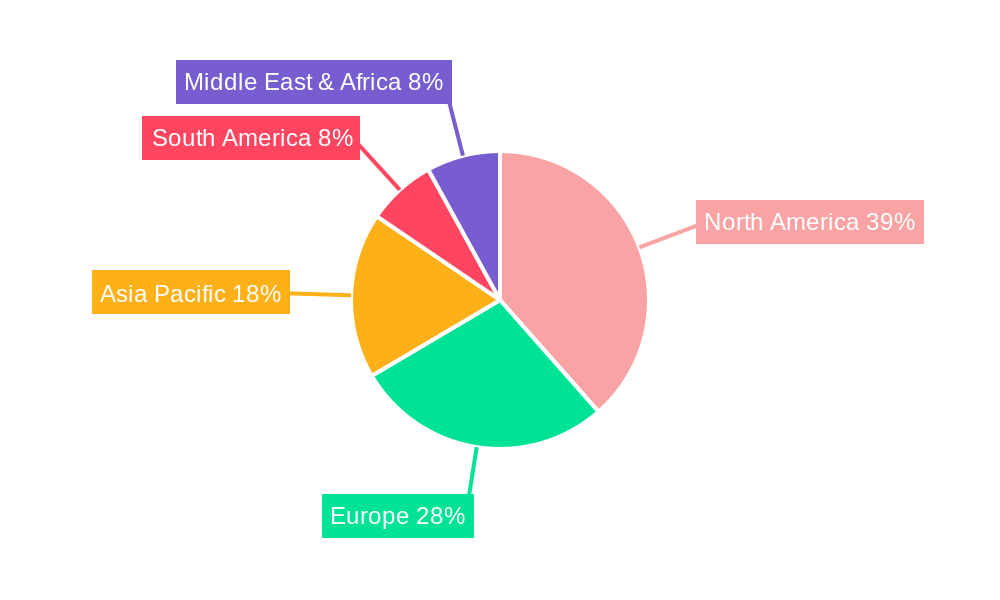
Fire Pit Regional Market Share
Geographic Coverage of Fire Pit
Fire Pit REPORT HIGHLIGHTS
| Aspects | Details |
|---|---|
| Study Period | 2020-2034 |
| Base Year | 2025 |
| Estimated Year | 2026 |
| Forecast Period | 2026-2034 |
| Historical Period | 2020-2025 |
| Growth Rate | CAGR of XX% from 2020-2034 |
| Segmentation |
|
Table of Contents
- 1. Introduction
- 1.1. Research Scope
- 1.2. Market Segmentation
- 1.3. Research Objective
- 1.4. Definitions and Assumptions
- 2. Executive Summary
- 2.1. Market Snapshot
- 3. Market Dynamics
- 3.1. Market Drivers
- 3.2. Market Restrains
- 3.3. Market Trends
- 3.4. Market Opportunities
- 4. Market Factor Analysis
- 4.1. Porters Five Forces
- 4.1.1. Bargaining Power of Suppliers
- 4.1.2. Bargaining Power of Buyers
- 4.1.3. Threat of New Entrants
- 4.1.4. Threat of Substitutes
- 4.1.5. Competitive Rivalry
- 4.2. PESTEL analysis
- 4.3. BCG Analysis
- 4.3.1. Stars (High Growth, High Market Share)
- 4.3.2. Cash Cows (Low Growth, High Market Share)
- 4.3.3. Question Mark (High Growth, Low Market Share)
- 4.3.4. Dogs (Low Growth, Low Market Share)
- 4.4. Ansoff Matrix Analysis
- 4.5. Supply Chain Analysis
- 4.6. Regulatory Landscape
- 4.7. Current Market Potential and Opportunity Assessment (TAM–SAM–SOM Framework)
- 4.8. RAX Analyst Note
- 4.1. Porters Five Forces
- 5. Market Analysis, Insights and Forecast 2021-2033
- 5.1. Market Analysis, Insights and Forecast - by Application
- 5.1.1. Residential
- 5.1.2. Commercial
- 5.2. Market Analysis, Insights and Forecast - by Types
- 5.2.1. Wood Burning Fire Pits
- 5.2.2. Gas Fire Pits
- 5.2.3. Other
- 5.3. Market Analysis, Insights and Forecast - by Region
- 5.3.1. North America
- 5.3.2. South America
- 5.3.3. Europe
- 5.3.4. Middle East & Africa
- 5.3.5. Asia Pacific
- 5.1. Market Analysis, Insights and Forecast - by Application
- 6. Global Fire Pit Analysis, Insights and Forecast, 2021-2033
- 6.1. Market Analysis, Insights and Forecast - by Application
- 6.1.1. Residential
- 6.1.2. Commercial
- 6.2. Market Analysis, Insights and Forecast - by Types
- 6.2.1. Wood Burning Fire Pits
- 6.2.2. Gas Fire Pits
- 6.2.3. Other
- 6.1. Market Analysis, Insights and Forecast - by Application
- 7. North America Fire Pit Analysis, Insights and Forecast, 2020-2032
- 7.1. Market Analysis, Insights and Forecast - by Application
- 7.1.1. Residential
- 7.1.2. Commercial
- 7.2. Market Analysis, Insights and Forecast - by Types
- 7.2.1. Wood Burning Fire Pits
- 7.2.2. Gas Fire Pits
- 7.2.3. Other
- 7.1. Market Analysis, Insights and Forecast - by Application
- 8. South America Fire Pit Analysis, Insights and Forecast, 2020-2032
- 8.1. Market Analysis, Insights and Forecast - by Application
- 8.1.1. Residential
- 8.1.2. Commercial
- 8.2. Market Analysis, Insights and Forecast - by Types
- 8.2.1. Wood Burning Fire Pits
- 8.2.2. Gas Fire Pits
- 8.2.3. Other
- 8.1. Market Analysis, Insights and Forecast - by Application
- 9. Europe Fire Pit Analysis, Insights and Forecast, 2020-2032
- 9.1. Market Analysis, Insights and Forecast - by Application
- 9.1.1. Residential
- 9.1.2. Commercial
- 9.2. Market Analysis, Insights and Forecast - by Types
- 9.2.1. Wood Burning Fire Pits
- 9.2.2. Gas Fire Pits
- 9.2.3. Other
- 9.1. Market Analysis, Insights and Forecast - by Application
- 10. Middle East & Africa Fire Pit Analysis, Insights and Forecast, 2020-2032
- 10.1. Market Analysis, Insights and Forecast - by Application
- 10.1.1. Residential
- 10.1.2. Commercial
- 10.2. Market Analysis, Insights and Forecast - by Types
- 10.2.1. Wood Burning Fire Pits
- 10.2.2. Gas Fire Pits
- 10.2.3. Other
- 10.1. Market Analysis, Insights and Forecast - by Application
- 11. Asia Pacific Fire Pit Analysis, Insights and Forecast, 2020-2032
- 11.1. Market Analysis, Insights and Forecast - by Application
- 11.1.1. Residential
- 11.1.2. Commercial
- 11.2. Market Analysis, Insights and Forecast - by Types
- 11.2.1. Wood Burning Fire Pits
- 11.2.2. Gas Fire Pits
- 11.2.3. Other
- 11.1. Market Analysis, Insights and Forecast - by Application
- 12. Competitive Analysis
- 12.1. Company Profiles
- 12.1.1 Patina Products
- 12.1.1.1. Company Overview
- 12.1.1.2. Products
- 12.1.1.3. Company Financials
- 12.1.1.4. SWOT Analysis
- 12.1.2 Crate and Barrel
- 12.1.2.1. Company Overview
- 12.1.2.2. Products
- 12.1.2.3. Company Financials
- 12.1.2.4. SWOT Analysis
- 12.1.3 Airxcel
- 12.1.3.1. Company Overview
- 12.1.3.2. Products
- 12.1.3.3. Company Financials
- 12.1.3.4. SWOT Analysis
- 12.1.4 Endless Summer
- 12.1.4.1. Company Overview
- 12.1.4.2. Products
- 12.1.4.3. Company Financials
- 12.1.4.4. SWOT Analysis
- 12.1.5 Outdoor GreatRoom
- 12.1.5.1. Company Overview
- 12.1.5.2. Products
- 12.1.5.3. Company Financials
- 12.1.5.4. SWOT Analysis
- 12.1.6 Bond Manufacturing
- 12.1.6.1. Company Overview
- 12.1.6.2. Products
- 12.1.6.3. Company Financials
- 12.1.6.4. SWOT Analysis
- 12.1.7 GHP Group
- 12.1.7.1. Company Overview
- 12.1.7.2. Products
- 12.1.7.3. Company Financials
- 12.1.7.4. SWOT Analysis
- 12.1.8 Landmann
- 12.1.8.1. Company Overview
- 12.1.8.2. Products
- 12.1.8.3. Company Financials
- 12.1.8.4. SWOT Analysis
- 12.1.9 AmazonBasics
- 12.1.9.1. Company Overview
- 12.1.9.2. Products
- 12.1.9.3. Company Financials
- 12.1.9.4. SWOT Analysis
- 12.1.10 Frepits UK
- 12.1.10.1. Company Overview
- 12.1.10.2. Products
- 12.1.10.3. Company Financials
- 12.1.10.4. SWOT Analysis
- 12.1.11 American Fyre Designs
- 12.1.11.1. Company Overview
- 12.1.11.2. Products
- 12.1.11.3. Company Financials
- 12.1.11.4. SWOT Analysis
- 12.1.12 Fire Sense
- 12.1.12.1. Company Overview
- 12.1.12.2. Products
- 12.1.12.3. Company Financials
- 12.1.12.4. SWOT Analysis
- 12.1.13 Designing Fire
- 12.1.13.1. Company Overview
- 12.1.13.2. Products
- 12.1.13.3. Company Financials
- 12.1.13.4. SWOT Analysis
- 12.1.14 ZheJiang Yayi
- 12.1.14.1. Company Overview
- 12.1.14.2. Products
- 12.1.14.3. Company Financials
- 12.1.14.4. SWOT Analysis
- 12.1.15 Shinerich Industrial
- 12.1.15.1. Company Overview
- 12.1.15.2. Products
- 12.1.15.3. Company Financials
- 12.1.15.4. SWOT Analysis
- 12.1.16 Jiangsu Gardensun
- 12.1.16.1. Company Overview
- 12.1.16.2. Products
- 12.1.16.3. Company Financials
- 12.1.16.4. SWOT Analysis
- 12.1.17 Camplux Machinery and Electric
- 12.1.17.1. Company Overview
- 12.1.17.2. Products
- 12.1.17.3. Company Financials
- 12.1.17.4. SWOT Analysis
- 12.1.18 Best Choice Products
- 12.1.18.1. Company Overview
- 12.1.18.2. Products
- 12.1.18.3. Company Financials
- 12.1.18.4. SWOT Analysis
- 12.1.19 TACKLIFE
- 12.1.19.1. Company Overview
- 12.1.19.2. Products
- 12.1.19.3. Company Financials
- 12.1.19.4. SWOT Analysis
- 12.1.20 YAHEETECH
- 12.1.20.1. Company Overview
- 12.1.20.2. Products
- 12.1.20.3. Company Financials
- 12.1.20.4. SWOT Analysis
- 12.1.21 KINGSO
- 12.1.21.1. Company Overview
- 12.1.21.2. Products
- 12.1.21.3. Company Financials
- 12.1.21.4. SWOT Analysis
- 12.1.1 Patina Products
- 12.2. Market Entropy
- 12.2.1 Company's Key Areas Served
- 12.2.2 Recent Developments
- 12.3. Company Market Share Analysis 2025
- 12.3.1 Top 5 Companies Market Share Analysis
- 12.3.2 Top 3 Companies Market Share Analysis
- 12.4. List of Potential Customers
- 13. Research Methodology
List of Figures
- Figure 1: Global Fire Pit Revenue Breakdown (million, %) by Region 2025 & 2033
- Figure 2: Global Fire Pit Volume Breakdown (K, %) by Region 2025 & 2033
- Figure 3: North America Fire Pit Revenue (million), by Application 2025 & 2033
- Figure 4: North America Fire Pit Volume (K), by Application 2025 & 2033
- Figure 5: North America Fire Pit Revenue Share (%), by Application 2025 & 2033
- Figure 6: North America Fire Pit Volume Share (%), by Application 2025 & 2033
- Figure 7: North America Fire Pit Revenue (million), by Types 2025 & 2033
- Figure 8: North America Fire Pit Volume (K), by Types 2025 & 2033
- Figure 9: North America Fire Pit Revenue Share (%), by Types 2025 & 2033
- Figure 10: North America Fire Pit Volume Share (%), by Types 2025 & 2033
- Figure 11: North America Fire Pit Revenue (million), by Country 2025 & 2033
- Figure 12: North America Fire Pit Volume (K), by Country 2025 & 2033
- Figure 13: North America Fire Pit Revenue Share (%), by Country 2025 & 2033
- Figure 14: North America Fire Pit Volume Share (%), by Country 2025 & 2033
- Figure 15: South America Fire Pit Revenue (million), by Application 2025 & 2033
- Figure 16: South America Fire Pit Volume (K), by Application 2025 & 2033
- Figure 17: South America Fire Pit Revenue Share (%), by Application 2025 & 2033
- Figure 18: South America Fire Pit Volume Share (%), by Application 2025 & 2033
- Figure 19: South America Fire Pit Revenue (million), by Types 2025 & 2033
- Figure 20: South America Fire Pit Volume (K), by Types 2025 & 2033
- Figure 21: South America Fire Pit Revenue Share (%), by Types 2025 & 2033
- Figure 22: South America Fire Pit Volume Share (%), by Types 2025 & 2033
- Figure 23: South America Fire Pit Revenue (million), by Country 2025 & 2033
- Figure 24: South America Fire Pit Volume (K), by Country 2025 & 2033
- Figure 25: South America Fire Pit Revenue Share (%), by Country 2025 & 2033
- Figure 26: South America Fire Pit Volume Share (%), by Country 2025 & 2033
- Figure 27: Europe Fire Pit Revenue (million), by Application 2025 & 2033
- Figure 28: Europe Fire Pit Volume (K), by Application 2025 & 2033
- Figure 29: Europe Fire Pit Revenue Share (%), by Application 2025 & 2033
- Figure 30: Europe Fire Pit Volume Share (%), by Application 2025 & 2033
- Figure 31: Europe Fire Pit Revenue (million), by Types 2025 & 2033
- Figure 32: Europe Fire Pit Volume (K), by Types 2025 & 2033
- Figure 33: Europe Fire Pit Revenue Share (%), by Types 2025 & 2033
- Figure 34: Europe Fire Pit Volume Share (%), by Types 2025 & 2033
- Figure 35: Europe Fire Pit Revenue (million), by Country 2025 & 2033
- Figure 36: Europe Fire Pit Volume (K), by Country 2025 & 2033
- Figure 37: Europe Fire Pit Revenue Share (%), by Country 2025 & 2033
- Figure 38: Europe Fire Pit Volume Share (%), by Country 2025 & 2033
- Figure 39: Middle East & Africa Fire Pit Revenue (million), by Application 2025 & 2033
- Figure 40: Middle East & Africa Fire Pit Volume (K), by Application 2025 & 2033
- Figure 41: Middle East & Africa Fire Pit Revenue Share (%), by Application 2025 & 2033
- Figure 42: Middle East & Africa Fire Pit Volume Share (%), by Application 2025 & 2033
- Figure 43: Middle East & Africa Fire Pit Revenue (million), by Types 2025 & 2033
- Figure 44: Middle East & Africa Fire Pit Volume (K), by Types 2025 & 2033
- Figure 45: Middle East & Africa Fire Pit Revenue Share (%), by Types 2025 & 2033
- Figure 46: Middle East & Africa Fire Pit Volume Share (%), by Types 2025 & 2033
- Figure 47: Middle East & Africa Fire Pit Revenue (million), by Country 2025 & 2033
- Figure 48: Middle East & Africa Fire Pit Volume (K), by Country 2025 & 2033
- Figure 49: Middle East & Africa Fire Pit Revenue Share (%), by Country 2025 & 2033
- Figure 50: Middle East & Africa Fire Pit Volume Share (%), by Country 2025 & 2033
- Figure 51: Asia Pacific Fire Pit Revenue (million), by Application 2025 & 2033
- Figure 52: Asia Pacific Fire Pit Volume (K), by Application 2025 & 2033
- Figure 53: Asia Pacific Fire Pit Revenue Share (%), by Application 2025 & 2033
- Figure 54: Asia Pacific Fire Pit Volume Share (%), by Application 2025 & 2033
- Figure 55: Asia Pacific Fire Pit Revenue (million), by Types 2025 & 2033
- Figure 56: Asia Pacific Fire Pit Volume (K), by Types 2025 & 2033
- Figure 57: Asia Pacific Fire Pit Revenue Share (%), by Types 2025 & 2033
- Figure 58: Asia Pacific Fire Pit Volume Share (%), by Types 2025 & 2033
- Figure 59: Asia Pacific Fire Pit Revenue (million), by Country 2025 & 2033
- Figure 60: Asia Pacific Fire Pit Volume (K), by Country 2025 & 2033
- Figure 61: Asia Pacific Fire Pit Revenue Share (%), by Country 2025 & 2033
- Figure 62: Asia Pacific Fire Pit Volume Share (%), by Country 2025 & 2033
List of Tables
- Table 1: Global Fire Pit Revenue million Forecast, by Application 2020 & 2033
- Table 2: Global Fire Pit Volume K Forecast, by Application 2020 & 2033
- Table 3: Global Fire Pit Revenue million Forecast, by Types 2020 & 2033
- Table 4: Global Fire Pit Volume K Forecast, by Types 2020 & 2033
- Table 5: Global Fire Pit Revenue million Forecast, by Region 2020 & 2033
- Table 6: Global Fire Pit Volume K Forecast, by Region 2020 & 2033
- Table 7: Global Fire Pit Revenue million Forecast, by Application 2020 & 2033
- Table 8: Global Fire Pit Volume K Forecast, by Application 2020 & 2033
- Table 9: Global Fire Pit Revenue million Forecast, by Types 2020 & 2033
- Table 10: Global Fire Pit Volume K Forecast, by Types 2020 & 2033
- Table 11: Global Fire Pit Revenue million Forecast, by Country 2020 & 2033
- Table 12: Global Fire Pit Volume K Forecast, by Country 2020 & 2033
- Table 13: United States Fire Pit Revenue (million) Forecast, by Application 2020 & 2033
- Table 14: United States Fire Pit Volume (K) Forecast, by Application 2020 & 2033
- Table 15: Canada Fire Pit Revenue (million) Forecast, by Application 2020 & 2033
- Table 16: Canada Fire Pit Volume (K) Forecast, by Application 2020 & 2033
- Table 17: Mexico Fire Pit Revenue (million) Forecast, by Application 2020 & 2033
- Table 18: Mexico Fire Pit Volume (K) Forecast, by Application 2020 & 2033
- Table 19: Global Fire Pit Revenue million Forecast, by Application 2020 & 2033
- Table 20: Global Fire Pit Volume K Forecast, by Application 2020 & 2033
- Table 21: Global Fire Pit Revenue million Forecast, by Types 2020 & 2033
- Table 22: Global Fire Pit Volume K Forecast, by Types 2020 & 2033
- Table 23: Global Fire Pit Revenue million Forecast, by Country 2020 & 2033
- Table 24: Global Fire Pit Volume K Forecast, by Country 2020 & 2033
- Table 25: Brazil Fire Pit Revenue (million) Forecast, by Application 2020 & 2033
- Table 26: Brazil Fire Pit Volume (K) Forecast, by Application 2020 & 2033
- Table 27: Argentina Fire Pit Revenue (million) Forecast, by Application 2020 & 2033
- Table 28: Argentina Fire Pit Volume (K) Forecast, by Application 2020 & 2033
- Table 29: Rest of South America Fire Pit Revenue (million) Forecast, by Application 2020 & 2033
- Table 30: Rest of South America Fire Pit Volume (K) Forecast, by Application 2020 & 2033
- Table 31: Global Fire Pit Revenue million Forecast, by Application 2020 & 2033
- Table 32: Global Fire Pit Volume K Forecast, by Application 2020 & 2033
- Table 33: Global Fire Pit Revenue million Forecast, by Types 2020 & 2033
- Table 34: Global Fire Pit Volume K Forecast, by Types 2020 & 2033
- Table 35: Global Fire Pit Revenue million Forecast, by Country 2020 & 2033
- Table 36: Global Fire Pit Volume K Forecast, by Country 2020 & 2033
- Table 37: United Kingdom Fire Pit Revenue (million) Forecast, by Application 2020 & 2033
- Table 38: United Kingdom Fire Pit Volume (K) Forecast, by Application 2020 & 2033
- Table 39: Germany Fire Pit Revenue (million) Forecast, by Application 2020 & 2033
- Table 40: Germany Fire Pit Volume (K) Forecast, by Application 2020 & 2033
- Table 41: France Fire Pit Revenue (million) Forecast, by Application 2020 & 2033
- Table 42: France Fire Pit Volume (K) Forecast, by Application 2020 & 2033
- Table 43: Italy Fire Pit Revenue (million) Forecast, by Application 2020 & 2033
- Table 44: Italy Fire Pit Volume (K) Forecast, by Application 2020 & 2033
- Table 45: Spain Fire Pit Revenue (million) Forecast, by Application 2020 & 2033
- Table 46: Spain Fire Pit Volume (K) Forecast, by Application 2020 & 2033
- Table 47: Russia Fire Pit Revenue (million) Forecast, by Application 2020 & 2033
- Table 48: Russia Fire Pit Volume (K) Forecast, by Application 2020 & 2033
- Table 49: Benelux Fire Pit Revenue (million) Forecast, by Application 2020 & 2033
- Table 50: Benelux Fire Pit Volume (K) Forecast, by Application 2020 & 2033
- Table 51: Nordics Fire Pit Revenue (million) Forecast, by Application 2020 & 2033
- Table 52: Nordics Fire Pit Volume (K) Forecast, by Application 2020 & 2033
- Table 53: Rest of Europe Fire Pit Revenue (million) Forecast, by Application 2020 & 2033
- Table 54: Rest of Europe Fire Pit Volume (K) Forecast, by Application 2020 & 2033
- Table 55: Global Fire Pit Revenue million Forecast, by Application 2020 & 2033
- Table 56: Global Fire Pit Volume K Forecast, by Application 2020 & 2033
- Table 57: Global Fire Pit Revenue million Forecast, by Types 2020 & 2033
- Table 58: Global Fire Pit Volume K Forecast, by Types 2020 & 2033
- Table 59: Global Fire Pit Revenue million Forecast, by Country 2020 & 2033
- Table 60: Global Fire Pit Volume K Forecast, by Country 2020 & 2033
- Table 61: Turkey Fire Pit Revenue (million) Forecast, by Application 2020 & 2033
- Table 62: Turkey Fire Pit Volume (K) Forecast, by Application 2020 & 2033
- Table 63: Israel Fire Pit Revenue (million) Forecast, by Application 2020 & 2033
- Table 64: Israel Fire Pit Volume (K) Forecast, by Application 2020 & 2033
- Table 65: GCC Fire Pit Revenue (million) Forecast, by Application 2020 & 2033
- Table 66: GCC Fire Pit Volume (K) Forecast, by Application 2020 & 2033
- Table 67: North Africa Fire Pit Revenue (million) Forecast, by Application 2020 & 2033
- Table 68: North Africa Fire Pit Volume (K) Forecast, by Application 2020 & 2033
- Table 69: South Africa Fire Pit Revenue (million) Forecast, by Application 2020 & 2033
- Table 70: South Africa Fire Pit Volume (K) Forecast, by Application 2020 & 2033
- Table 71: Rest of Middle East & Africa Fire Pit Revenue (million) Forecast, by Application 2020 & 2033
- Table 72: Rest of Middle East & Africa Fire Pit Volume (K) Forecast, by Application 2020 & 2033
- Table 73: Global Fire Pit Revenue million Forecast, by Application 2020 & 2033
- Table 74: Global Fire Pit Volume K Forecast, by Application 2020 & 2033
- Table 75: Global Fire Pit Revenue million Forecast, by Types 2020 & 2033
- Table 76: Global Fire Pit Volume K Forecast, by Types 2020 & 2033
- Table 77: Global Fire Pit Revenue million Forecast, by Country 2020 & 2033
- Table 78: Global Fire Pit Volume K Forecast, by Country 2020 & 2033
- Table 79: China Fire Pit Revenue (million) Forecast, by Application 2020 & 2033
- Table 80: China Fire Pit Volume (K) Forecast, by Application 2020 & 2033
- Table 81: India Fire Pit Revenue (million) Forecast, by Application 2020 & 2033
- Table 82: India Fire Pit Volume (K) Forecast, by Application 2020 & 2033
- Table 83: Japan Fire Pit Revenue (million) Forecast, by Application 2020 & 2033
- Table 84: Japan Fire Pit Volume (K) Forecast, by Application 2020 & 2033
- Table 85: South Korea Fire Pit Revenue (million) Forecast, by Application 2020 & 2033
- Table 86: South Korea Fire Pit Volume (K) Forecast, by Application 2020 & 2033
- Table 87: ASEAN Fire Pit Revenue (million) Forecast, by Application 2020 & 2033
- Table 88: ASEAN Fire Pit Volume (K) Forecast, by Application 2020 & 2033
- Table 89: Oceania Fire Pit Revenue (million) Forecast, by Application 2020 & 2033
- Table 90: Oceania Fire Pit Volume (K) Forecast, by Application 2020 & 2033
- Table 91: Rest of Asia Pacific Fire Pit Revenue (million) Forecast, by Application 2020 & 2033
- Table 92: Rest of Asia Pacific Fire Pit Volume (K) Forecast, by Application 2020 & 2033
Frequently Asked Questions
1. What is the projected Compound Annual Growth Rate (CAGR) of the Fire Pit?
The projected CAGR is approximately XX%.
2. Which companies are prominent players in the Fire Pit?
Key companies in the market include Patina Products, Crate and Barrel, Airxcel, Endless Summer, Outdoor GreatRoom, Bond Manufacturing, GHP Group, Landmann, AmazonBasics, Frepits UK, American Fyre Designs, Fire Sense, Designing Fire, ZheJiang Yayi, Shinerich Industrial, Jiangsu Gardensun, Camplux Machinery and Electric, Best Choice Products, TACKLIFE, YAHEETECH, KINGSO.
3. What are the main segments of the Fire Pit?
The market segments include Application, Types.
4. Can you provide details about the market size?
The market size is estimated to be USD XXX million as of 2022.
5. What are some drivers contributing to market growth?
N/A
6. What are the notable trends driving market growth?
N/A
7. Are there any restraints impacting market growth?
N/A
8. Can you provide examples of recent developments in the market?
N/A
9. What pricing options are available for accessing the report?
Pricing options include single-user, multi-user, and enterprise licenses priced at USD 3350.00, USD 5025.00, and USD 6700.00 respectively.
10. Is the market size provided in terms of value or volume?
The market size is provided in terms of value, measured in million and volume, measured in K.
11. Are there any specific market keywords associated with the report?
Yes, the market keyword associated with the report is "Fire Pit," which aids in identifying and referencing the specific market segment covered.
12. How do I determine which pricing option suits my needs best?
The pricing options vary based on user requirements and access needs. Individual users may opt for single-user licenses, while businesses requiring broader access may choose multi-user or enterprise licenses for cost-effective access to the report.
13. Are there any additional resources or data provided in the Fire Pit report?
While the report offers comprehensive insights, it's advisable to review the specific contents or supplementary materials provided to ascertain if additional resources or data are available.
14. How can I stay updated on further developments or reports in the Fire Pit?
To stay informed about further developments, trends, and reports in the Fire Pit, consider subscribing to industry newsletters, following relevant companies and organizations, or regularly checking reputable industry news sources and publications.
Methodology
Step 1 - Identification of Relevant Samples Size from Population Database


Step 2 - Approaches for Defining Global Market Size (Value, Volume* & Price*)

Note*: In applicable scenarios
Step 3 - Data Sources
Primary Research
- Web Analytics
- Survey Reports
- Research Institute
- Latest Research Reports
- Opinion Leaders
Secondary Research
- Annual Reports
- White Paper
- Latest Press Release
- Industry Association
- Paid Database
- Investor Presentations

Step 4 - Data Triangulation
Involves using different sources of information in order to increase the validity of a study
These sources are likely to be stakeholders in a program - participants, other researchers, program staff, other community members, and so on.
Then we put all data in single framework & apply various statistical tools to find out the dynamic on the market.
During the analysis stage, feedback from the stakeholder groups would be compared to determine areas of agreement as well as areas of divergence