
Key Insights
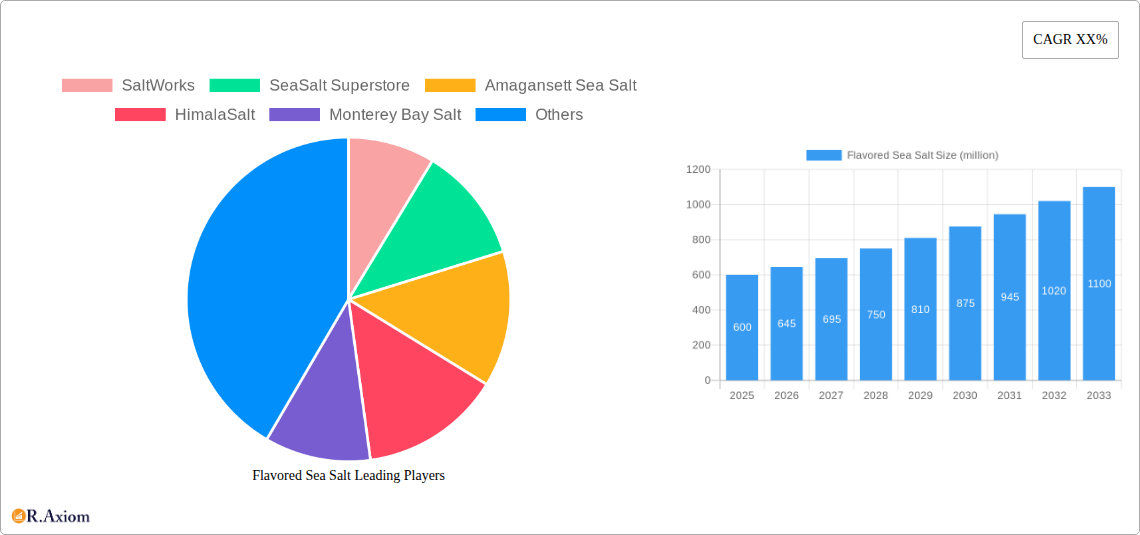
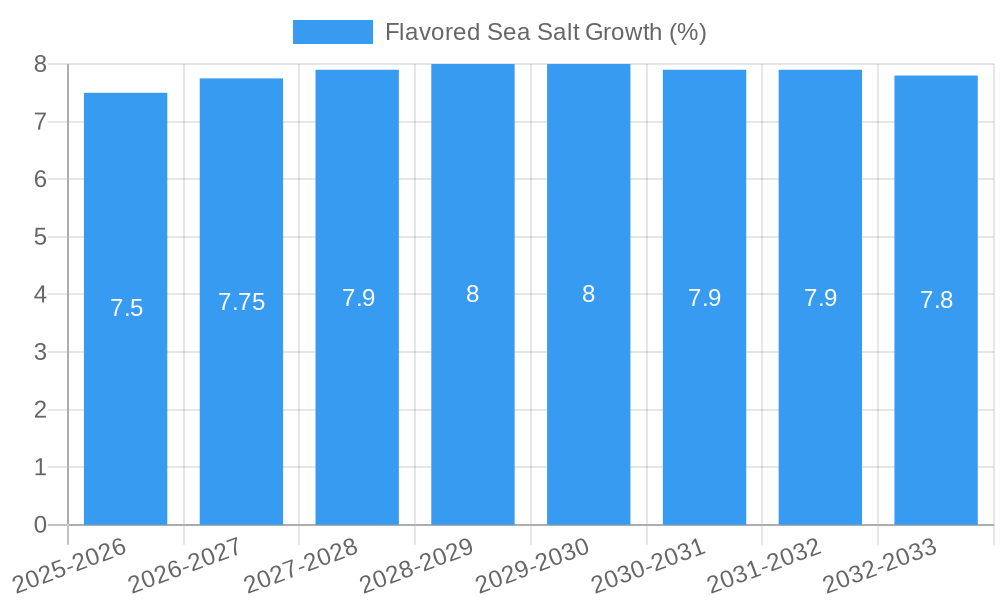
The global flavored sea salt market is experiencing robust growth, poised to reach an estimated market size of approximately $600 million by 2025. This surge is driven by increasing consumer demand for artisanal, premium food ingredients that elevate culinary experiences. The market is expected to witness a Compound Annual Growth Rate (CAGR) of around 7.5% over the forecast period of 2025-2033, reflecting a sustained upward trajectory. Key drivers include the growing popularity of gourmet cooking, the rise of home dining, and a heightened awareness of the nuanced flavors and health benefits associated with sea salt. Culinary professionals and home cooks alike are increasingly seeking out flavored sea salts to add complexity and distinction to a wide range of dishes, from simple grilled meats to intricate desserts. The "Spices Flavored" segment is anticipated to lead market share, owing to the broad appeal and versatility of spice blends, followed closely by "Herbs Flavored" variants.
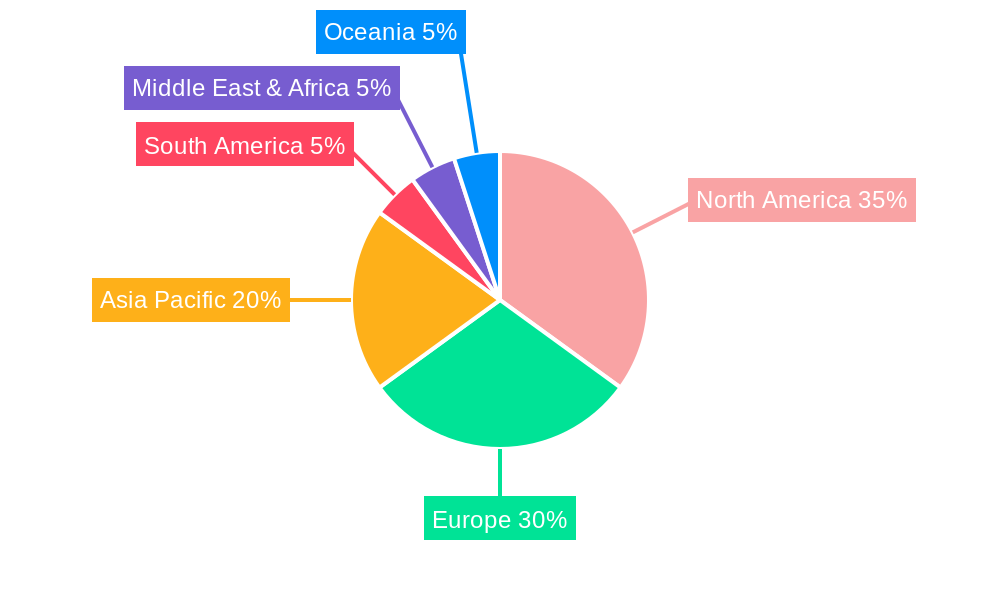
The market landscape is characterized by strong competition among established players and emerging artisanal brands, fostering innovation in product development and marketing. Companies like SaltWorks, SeaSalt Superstore, and Amagansett Sea Salt are at the forefront, offering diverse portfolios that cater to evolving consumer preferences. However, potential restraints such as the fluctuating costs of raw materials and the perceived premium pricing compared to standard table salt could temper growth. Geographically, North America and Europe are projected to be the dominant regions, driven by high disposable incomes and a well-developed culinary culture. The Asia Pacific region, particularly China and India, presents significant untapped potential due to rapidly growing economies and an increasing interest in international culinary trends. The trend towards natural and minimally processed ingredients further bolsters the appeal of flavored sea salts, positioning them as a desirable alternative to synthetic flavorings.
This in-depth market research report offers a granular examination of the global Flavored Sea Salt market, providing invaluable insights for industry stakeholders, manufacturers, suppliers, and investors. Spanning a comprehensive Study Period from 2019 to 2033, with a Base Year of 2025 and a Forecast Period of 2025–2033, this report meticulously analyzes historical trends, current market dynamics, and future growth trajectories. The report focuses on crucial segments including Household and Commercial applications, and Types such as Spices Flavored, Herbs Flavored, and Others.
Flavored Sea Salt Market Concentration & Innovation
The global flavored sea salt market exhibits a moderate level of concentration, with key players like SaltWorks, SeaSalt Superstore, and Amagansett Sea Salt holding significant market share valued in the hundreds of millions. Innovation is a primary driver, fueled by evolving consumer demand for gourmet, artisanal, and health-conscious food products. R&D investments are directed towards novel flavor combinations, sustainable sourcing practices, and enhanced preservation techniques. Regulatory frameworks, particularly around food safety and labeling, are becoming more stringent but generally support market growth. Product substitutes, such as other specialty salts and seasoning blends, pose a competitive challenge, although the unique appeal and perceived health benefits of flavored sea salt continue to drive adoption. End-user trends overwhelmingly favor premium ingredients and culinary exploration. Mergers and acquisitions (M&A) activity, with deal values reaching tens of millions, is on the rise as larger companies seek to expand their portfolios and gain market share in this burgeoning sector.
Flavored Sea Salt Industry Trends & Insights
The flavored sea salt industry is experiencing robust growth, projected to expand at a Compound Annual Growth Rate (CAGR) of approximately 7.5% during the forecast period. This growth is underpinned by several key drivers. A significant trend is the increasing consumer preference for culinary exploration and the desire for elevated home cooking experiences. The "foodie" culture, amplified by social media and cooking shows, has made consumers more adventurous in their flavor choices. Furthermore, the perceived health benefits of sea salt over refined table salt, coupled with the added appeal of natural flavor infusions, are driving market penetration. Technological advancements in salt processing and flavor extraction are enabling a wider array of unique and high-quality flavored sea salt products. The commercial segment, particularly in the food service industry (restaurants, catering), is a major growth engine, with chefs utilizing flavored sea salts to add depth and complexity to dishes. The market penetration of flavored sea salt within the broader seasoning market is steadily increasing, demonstrating its growing acceptance and integration into everyday culinary practices. Competition is intense, with both established players and emerging artisanal brands vying for market dominance, often differentiating through unique flavor profiles, origin stories, and packaging.
Dominant Markets & Segments in Flavored Sea Salt
The North American region, particularly the United States, stands out as the dominant market for flavored sea salts, driven by a strong consumer demand for premium food products and a well-developed culinary landscape. Within North America, the Household segment accounts for over 60% of market consumption, with consumers actively seeking to enhance their home-cooked meals. This dominance is supported by robust economic policies that encourage small business innovation and readily available distribution channels.
- Key Drivers of Household Segment Dominance:
- Rising Disposable Income: Increased consumer spending power allows for the purchase of premium ingredients like flavored sea salts.
- Health and Wellness Trends: Growing awareness of the perceived health benefits of sea salt fuels demand.
- Culinary Influence: Social media, cooking shows, and celebrity chefs inspire home cooks to experiment with exotic flavors.
- E-commerce Growth: Online platforms provide easy access to a wide variety of flavored sea salt options from different brands.
The Spices Flavored segment leads within the types of flavored sea salt, representing an estimated 50% of the market share. This is attributed to the versatility of spice-infused salts in a multitude of cuisines and cooking applications, from grilling and roasting to finishing dishes.
- Key Drivers of Spices Flavored Dominance:
- Versatility: Spice blends can complement a vast array of ingredients and dishes.
- Flavor Complexity: Spices offer a wide spectrum of tastes, from smoky and savory to sweet and spicy.
- Global Cuisines: Increasing interest in international flavors drives demand for regionally inspired spice blends.
- Innovation in Spice Combinations: Manufacturers continuously introduce novel and exciting spice profiles.
The Commercial application segment, while currently smaller than Household, is exhibiting a higher CAGR, indicating significant future growth potential. Restaurants, hotels, and food manufacturers are increasingly incorporating flavored sea salts to create signature dishes and enhance product appeal, contributing to market penetration and revenue growth in the tens of millions.
Flavored Sea Salt Product Developments
Product innovation in the flavored sea salt market is characterized by a focus on unique flavor profiles, ethical sourcing, and specialized applications. Companies are developing salts infused with exotic spices, premium herbs, and even nuanced ingredients like truffle or smoke. Technological advancements in flavor encapsulation and sustainable harvesting techniques are crucial, enabling the creation of high-quality, long-lasting products. The competitive advantage for brands lies in their ability to offer distinctive taste experiences and cater to niche culinary trends, driving market fit and consumer loyalty, with new product launches valued in the millions annually.
Flavored Sea Salt Report Scope & Segmentation Analysis
This report provides a comprehensive analysis of the Flavored Sea Salt market, segmented by application and type.
- Household Application: This segment, valued at over $500 million, caters to individual consumers seeking to enhance their home cooking. Growth is projected at a CAGR of 7% due to rising disposable incomes and a focus on culinary experimentation.
- Commercial Application: This segment, valued at over $300 million, includes usage in food service and food manufacturing. It is expected to grow at a CAGR of 8.5% driven by increasing demand for gourmet ingredients in restaurants and processed foods.
- Spices Flavored Type: Accounting for approximately 50% of the market share, this segment is valued at over $400 million and is characterized by diverse flavor profiles. Future growth is robust, projected at a CAGR of 8%.
- Herbs Flavored Type: This segment, valued at over $300 million, offers a range of aromatic options. It is expected to grow at a CAGR of 7%, driven by demand for natural and healthy seasonings.
- Others Type: This residual category, valued at over $100 million, includes unique infusions and blends. It shows promising growth at a CAGR of 7.5%, fueled by niche market demand and innovation.
Key Drivers of Flavored Sea Salt Growth
The flavored sea salt market is propelled by several key drivers. Consumer demand for premium and artisanal food products is a primary catalyst, encouraging culinary exploration and a desire for enhanced flavor profiles. Growing awareness of the perceived health benefits of sea salt compared to refined salt, coupled with natural flavor infusions, appeals to health-conscious consumers. Technological advancements in flavor extraction and salt processing enable the creation of unique and high-quality products. Furthermore, the expansion of the food service industry and increased focus on culinary innovation by chefs and restaurateurs contribute significantly. E-commerce platforms have also played a crucial role in broadening market access and consumer reach, with global sales reaching hundreds of millions.
Challenges in the Flavored Sea Salt Sector
Despite its growth, the flavored sea salt sector faces several challenges. Intense competition from both established brands and emerging artisanal producers can lead to price pressures and impact profit margins, with market saturation in certain sub-segments. Fluctuations in raw material costs, particularly for specialty herbs and spices, can affect production expenses, with potential impacts in the tens of millions of dollars. Navigating complex and evolving global food safety regulations and labeling requirements can pose compliance hurdles for manufacturers. Supply chain disruptions, exacerbated by geopolitical events or climate change, can impact the availability and cost of key ingredients and finished products.
Emerging Opportunities in Flavored Sea Salt
Emerging opportunities in the flavored sea salt market lie in several key areas. The growing demand for plant-based and vegan culinary options presents an avenue for developing innovative, herb and spice-infused sea salts that complement these diets. The expansion of e-commerce and direct-to-consumer (DTC) sales channels offers significant potential for brands to reach wider audiences and build direct customer relationships. The increasing global interest in functional foods and ingredients could lead to the development of flavored sea salts fortified with beneficial minerals or infused with ingredients known for their health properties. Furthermore, partnerships with food bloggers, chefs, and influencers can be leveraged to create buzz and drive product adoption.
Leading Players in the Flavored Sea Salt Market
- SaltWorks
- SeaSalt Superstore
- Amagansett Sea Salt
- HimalaSalt
- Monterey Bay Salt
- Cornish Sea Salt
- Jacobsen Salt
- Maine Sea Salt
- Salt Traders
- Saltbird
- Bitterman and Sons
Key Developments in Flavored Sea Salt Industry
- 2023/08: SaltWorks launched a new line of smoky chipotle infused sea salt, expanding its gourmet offerings.
- 2022/11: Amagansett Sea Salt partnered with a renowned chef to create a signature blend, targeting premium culinary markets.
- 2022/05: SeaSalt Superstore invested in new processing technology to enhance the purity and flavor of its infused salts, with investment in the millions.
- 2021/09: Cornish Sea Salt introduced sustainable packaging initiatives, aligning with growing environmental consciousness among consumers.
- 2020/04: Jacobsen Salt expanded its distribution network into Asia, tapping into new international markets.
Strategic Outlook for Flavored Sea Salt Market
The strategic outlook for the flavored sea salt market remains highly optimistic. Continued innovation in flavor profiles, a focus on health and wellness benefits, and expanding distribution channels, particularly through e-commerce, will be key growth catalysts. The increasing adoption by the commercial food service sector, coupled with evolving consumer preferences for premium and globally inspired ingredients, will drive significant market expansion. Strategic partnerships and a commitment to sustainable practices will further solidify market positions, ensuring sustained growth in the coming years, with total market value projected to reach billions.
Flavored Sea Salt Segmentation
-
1. Application
- 1.1. Household
- 1.2. Commercial
-
2. Types
- 2.1. Spices Flavored
- 2.2. Herbs Flavored
- 2.3. Others
Flavored Sea Salt Segmentation By Geography
-
1. North America
- 1.1. United States
- 1.2. Canada
- 1.3. Mexico
-
2. South America
- 2.1. Brazil
- 2.2. Argentina
- 2.3. Rest of South America
-
3. Europe
- 3.1. United Kingdom
- 3.2. Germany
- 3.3. France
- 3.4. Italy
- 3.5. Spain
- 3.6. Russia
- 3.7. Benelux
- 3.8. Nordics
- 3.9. Rest of Europe
-
4. Middle East & Africa
- 4.1. Turkey
- 4.2. Israel
- 4.3. GCC
- 4.4. North Africa
- 4.5. South Africa
- 4.6. Rest of Middle East & Africa
-
5. Asia Pacific
- 5.1. China
- 5.2. India
- 5.3. Japan
- 5.4. South Korea
- 5.5. ASEAN
- 5.6. Oceania
- 5.7. Rest of Asia Pacific
Flavored Sea Salt REPORT HIGHLIGHTS
| Aspects | Details |
|---|---|
| Study Period | 2019-2033 |
| Base Year | 2024 |
| Estimated Year | 2025 |
| Forecast Period | 2025-2033 |
| Historical Period | 2019-2024 |
| Growth Rate | CAGR of XX% from 2019-2033 |
| Segmentation |
|
Table of Contents
- 1. Introduction
- 1.1. Research Scope
- 1.2. Market Segmentation
- 1.3. Research Methodology
- 1.4. Definitions and Assumptions
- 2. Executive Summary
- 2.1. Introduction
- 3. Market Dynamics
- 3.1. Introduction
- 3.2. Market Drivers
- 3.3. Market Restrains
- 3.4. Market Trends
- 4. Market Factor Analysis
- 4.1. Porters Five Forces
- 4.2. Supply/Value Chain
- 4.3. PESTEL analysis
- 4.4. Market Entropy
- 4.5. Patent/Trademark Analysis
- 5. Global Flavored Sea Salt Analysis, Insights and Forecast, 2019-2031
- 5.1. Market Analysis, Insights and Forecast - by Application
- 5.1.1. Household
- 5.1.2. Commercial
- 5.2. Market Analysis, Insights and Forecast - by Types
- 5.2.1. Spices Flavored
- 5.2.2. Herbs Flavored
- 5.2.3. Others
- 5.3. Market Analysis, Insights and Forecast - by Region
- 5.3.1. North America
- 5.3.2. South America
- 5.3.3. Europe
- 5.3.4. Middle East & Africa
- 5.3.5. Asia Pacific
- 5.1. Market Analysis, Insights and Forecast - by Application
- 6. North America Flavored Sea Salt Analysis, Insights and Forecast, 2019-2031
- 6.1. Market Analysis, Insights and Forecast - by Application
- 6.1.1. Household
- 6.1.2. Commercial
- 6.2. Market Analysis, Insights and Forecast - by Types
- 6.2.1. Spices Flavored
- 6.2.2. Herbs Flavored
- 6.2.3. Others
- 6.1. Market Analysis, Insights and Forecast - by Application
- 7. South America Flavored Sea Salt Analysis, Insights and Forecast, 2019-2031
- 7.1. Market Analysis, Insights and Forecast - by Application
- 7.1.1. Household
- 7.1.2. Commercial
- 7.2. Market Analysis, Insights and Forecast - by Types
- 7.2.1. Spices Flavored
- 7.2.2. Herbs Flavored
- 7.2.3. Others
- 7.1. Market Analysis, Insights and Forecast - by Application
- 8. Europe Flavored Sea Salt Analysis, Insights and Forecast, 2019-2031
- 8.1. Market Analysis, Insights and Forecast - by Application
- 8.1.1. Household
- 8.1.2. Commercial
- 8.2. Market Analysis, Insights and Forecast - by Types
- 8.2.1. Spices Flavored
- 8.2.2. Herbs Flavored
- 8.2.3. Others
- 8.1. Market Analysis, Insights and Forecast - by Application
- 9. Middle East & Africa Flavored Sea Salt Analysis, Insights and Forecast, 2019-2031
- 9.1. Market Analysis, Insights and Forecast - by Application
- 9.1.1. Household
- 9.1.2. Commercial
- 9.2. Market Analysis, Insights and Forecast - by Types
- 9.2.1. Spices Flavored
- 9.2.2. Herbs Flavored
- 9.2.3. Others
- 9.1. Market Analysis, Insights and Forecast - by Application
- 10. Asia Pacific Flavored Sea Salt Analysis, Insights and Forecast, 2019-2031
- 10.1. Market Analysis, Insights and Forecast - by Application
- 10.1.1. Household
- 10.1.2. Commercial
- 10.2. Market Analysis, Insights and Forecast - by Types
- 10.2.1. Spices Flavored
- 10.2.2. Herbs Flavored
- 10.2.3. Others
- 10.1. Market Analysis, Insights and Forecast - by Application
- 11. Competitive Analysis
- 11.1. Global Market Share Analysis 2024
- 11.2. Company Profiles
- 11.2.1 SaltWorks
- 11.2.1.1. Overview
- 11.2.1.2. Products
- 11.2.1.3. SWOT Analysis
- 11.2.1.4. Recent Developments
- 11.2.1.5. Financials (Based on Availability)
- 11.2.2 SeaSalt Superstore
- 11.2.2.1. Overview
- 11.2.2.2. Products
- 11.2.2.3. SWOT Analysis
- 11.2.2.4. Recent Developments
- 11.2.2.5. Financials (Based on Availability)
- 11.2.3 Amagansett Sea Salt
- 11.2.3.1. Overview
- 11.2.3.2. Products
- 11.2.3.3. SWOT Analysis
- 11.2.3.4. Recent Developments
- 11.2.3.5. Financials (Based on Availability)
- 11.2.4 HimalaSalt
- 11.2.4.1. Overview
- 11.2.4.2. Products
- 11.2.4.3. SWOT Analysis
- 11.2.4.4. Recent Developments
- 11.2.4.5. Financials (Based on Availability)
- 11.2.5 Monterey Bay Salt
- 11.2.5.1. Overview
- 11.2.5.2. Products
- 11.2.5.3. SWOT Analysis
- 11.2.5.4. Recent Developments
- 11.2.5.5. Financials (Based on Availability)
- 11.2.6 Cornish Sea Salt
- 11.2.6.1. Overview
- 11.2.6.2. Products
- 11.2.6.3. SWOT Analysis
- 11.2.6.4. Recent Developments
- 11.2.6.5. Financials (Based on Availability)
- 11.2.7 Jacobsen Salt
- 11.2.7.1. Overview
- 11.2.7.2. Products
- 11.2.7.3. SWOT Analysis
- 11.2.7.4. Recent Developments
- 11.2.7.5. Financials (Based on Availability)
- 11.2.8 Maine Sea Salt
- 11.2.8.1. Overview
- 11.2.8.2. Products
- 11.2.8.3. SWOT Analysis
- 11.2.8.4. Recent Developments
- 11.2.8.5. Financials (Based on Availability)
- 11.2.9 Salt Traders
- 11.2.9.1. Overview
- 11.2.9.2. Products
- 11.2.9.3. SWOT Analysis
- 11.2.9.4. Recent Developments
- 11.2.9.5. Financials (Based on Availability)
- 11.2.10 Saltbird
- 11.2.10.1. Overview
- 11.2.10.2. Products
- 11.2.10.3. SWOT Analysis
- 11.2.10.4. Recent Developments
- 11.2.10.5. Financials (Based on Availability)
- 11.2.11 Bitterman and Sons
- 11.2.11.1. Overview
- 11.2.11.2. Products
- 11.2.11.3. SWOT Analysis
- 11.2.11.4. Recent Developments
- 11.2.11.5. Financials (Based on Availability)
- 11.2.1 SaltWorks
List of Figures
- Figure 1: Global Flavored Sea Salt Revenue Breakdown (million, %) by Region 2024 & 2032
- Figure 2: North America Flavored Sea Salt Revenue (million), by Application 2024 & 2032
- Figure 3: North America Flavored Sea Salt Revenue Share (%), by Application 2024 & 2032
- Figure 4: North America Flavored Sea Salt Revenue (million), by Types 2024 & 2032
- Figure 5: North America Flavored Sea Salt Revenue Share (%), by Types 2024 & 2032
- Figure 6: North America Flavored Sea Salt Revenue (million), by Country 2024 & 2032
- Figure 7: North America Flavored Sea Salt Revenue Share (%), by Country 2024 & 2032
- Figure 8: South America Flavored Sea Salt Revenue (million), by Application 2024 & 2032
- Figure 9: South America Flavored Sea Salt Revenue Share (%), by Application 2024 & 2032
- Figure 10: South America Flavored Sea Salt Revenue (million), by Types 2024 & 2032
- Figure 11: South America Flavored Sea Salt Revenue Share (%), by Types 2024 & 2032
- Figure 12: South America Flavored Sea Salt Revenue (million), by Country 2024 & 2032
- Figure 13: South America Flavored Sea Salt Revenue Share (%), by Country 2024 & 2032
- Figure 14: Europe Flavored Sea Salt Revenue (million), by Application 2024 & 2032
- Figure 15: Europe Flavored Sea Salt Revenue Share (%), by Application 2024 & 2032
- Figure 16: Europe Flavored Sea Salt Revenue (million), by Types 2024 & 2032
- Figure 17: Europe Flavored Sea Salt Revenue Share (%), by Types 2024 & 2032
- Figure 18: Europe Flavored Sea Salt Revenue (million), by Country 2024 & 2032
- Figure 19: Europe Flavored Sea Salt Revenue Share (%), by Country 2024 & 2032
- Figure 20: Middle East & Africa Flavored Sea Salt Revenue (million), by Application 2024 & 2032
- Figure 21: Middle East & Africa Flavored Sea Salt Revenue Share (%), by Application 2024 & 2032
- Figure 22: Middle East & Africa Flavored Sea Salt Revenue (million), by Types 2024 & 2032
- Figure 23: Middle East & Africa Flavored Sea Salt Revenue Share (%), by Types 2024 & 2032
- Figure 24: Middle East & Africa Flavored Sea Salt Revenue (million), by Country 2024 & 2032
- Figure 25: Middle East & Africa Flavored Sea Salt Revenue Share (%), by Country 2024 & 2032
- Figure 26: Asia Pacific Flavored Sea Salt Revenue (million), by Application 2024 & 2032
- Figure 27: Asia Pacific Flavored Sea Salt Revenue Share (%), by Application 2024 & 2032
- Figure 28: Asia Pacific Flavored Sea Salt Revenue (million), by Types 2024 & 2032
- Figure 29: Asia Pacific Flavored Sea Salt Revenue Share (%), by Types 2024 & 2032
- Figure 30: Asia Pacific Flavored Sea Salt Revenue (million), by Country 2024 & 2032
- Figure 31: Asia Pacific Flavored Sea Salt Revenue Share (%), by Country 2024 & 2032
List of Tables
- Table 1: Global Flavored Sea Salt Revenue million Forecast, by Region 2019 & 2032
- Table 2: Global Flavored Sea Salt Revenue million Forecast, by Application 2019 & 2032
- Table 3: Global Flavored Sea Salt Revenue million Forecast, by Types 2019 & 2032
- Table 4: Global Flavored Sea Salt Revenue million Forecast, by Region 2019 & 2032
- Table 5: Global Flavored Sea Salt Revenue million Forecast, by Application 2019 & 2032
- Table 6: Global Flavored Sea Salt Revenue million Forecast, by Types 2019 & 2032
- Table 7: Global Flavored Sea Salt Revenue million Forecast, by Country 2019 & 2032
- Table 8: United States Flavored Sea Salt Revenue (million) Forecast, by Application 2019 & 2032
- Table 9: Canada Flavored Sea Salt Revenue (million) Forecast, by Application 2019 & 2032
- Table 10: Mexico Flavored Sea Salt Revenue (million) Forecast, by Application 2019 & 2032
- Table 11: Global Flavored Sea Salt Revenue million Forecast, by Application 2019 & 2032
- Table 12: Global Flavored Sea Salt Revenue million Forecast, by Types 2019 & 2032
- Table 13: Global Flavored Sea Salt Revenue million Forecast, by Country 2019 & 2032
- Table 14: Brazil Flavored Sea Salt Revenue (million) Forecast, by Application 2019 & 2032
- Table 15: Argentina Flavored Sea Salt Revenue (million) Forecast, by Application 2019 & 2032
- Table 16: Rest of South America Flavored Sea Salt Revenue (million) Forecast, by Application 2019 & 2032
- Table 17: Global Flavored Sea Salt Revenue million Forecast, by Application 2019 & 2032
- Table 18: Global Flavored Sea Salt Revenue million Forecast, by Types 2019 & 2032
- Table 19: Global Flavored Sea Salt Revenue million Forecast, by Country 2019 & 2032
- Table 20: United Kingdom Flavored Sea Salt Revenue (million) Forecast, by Application 2019 & 2032
- Table 21: Germany Flavored Sea Salt Revenue (million) Forecast, by Application 2019 & 2032
- Table 22: France Flavored Sea Salt Revenue (million) Forecast, by Application 2019 & 2032
- Table 23: Italy Flavored Sea Salt Revenue (million) Forecast, by Application 2019 & 2032
- Table 24: Spain Flavored Sea Salt Revenue (million) Forecast, by Application 2019 & 2032
- Table 25: Russia Flavored Sea Salt Revenue (million) Forecast, by Application 2019 & 2032
- Table 26: Benelux Flavored Sea Salt Revenue (million) Forecast, by Application 2019 & 2032
- Table 27: Nordics Flavored Sea Salt Revenue (million) Forecast, by Application 2019 & 2032
- Table 28: Rest of Europe Flavored Sea Salt Revenue (million) Forecast, by Application 2019 & 2032
- Table 29: Global Flavored Sea Salt Revenue million Forecast, by Application 2019 & 2032
- Table 30: Global Flavored Sea Salt Revenue million Forecast, by Types 2019 & 2032
- Table 31: Global Flavored Sea Salt Revenue million Forecast, by Country 2019 & 2032
- Table 32: Turkey Flavored Sea Salt Revenue (million) Forecast, by Application 2019 & 2032
- Table 33: Israel Flavored Sea Salt Revenue (million) Forecast, by Application 2019 & 2032
- Table 34: GCC Flavored Sea Salt Revenue (million) Forecast, by Application 2019 & 2032
- Table 35: North Africa Flavored Sea Salt Revenue (million) Forecast, by Application 2019 & 2032
- Table 36: South Africa Flavored Sea Salt Revenue (million) Forecast, by Application 2019 & 2032
- Table 37: Rest of Middle East & Africa Flavored Sea Salt Revenue (million) Forecast, by Application 2019 & 2032
- Table 38: Global Flavored Sea Salt Revenue million Forecast, by Application 2019 & 2032
- Table 39: Global Flavored Sea Salt Revenue million Forecast, by Types 2019 & 2032
- Table 40: Global Flavored Sea Salt Revenue million Forecast, by Country 2019 & 2032
- Table 41: China Flavored Sea Salt Revenue (million) Forecast, by Application 2019 & 2032
- Table 42: India Flavored Sea Salt Revenue (million) Forecast, by Application 2019 & 2032
- Table 43: Japan Flavored Sea Salt Revenue (million) Forecast, by Application 2019 & 2032
- Table 44: South Korea Flavored Sea Salt Revenue (million) Forecast, by Application 2019 & 2032
- Table 45: ASEAN Flavored Sea Salt Revenue (million) Forecast, by Application 2019 & 2032
- Table 46: Oceania Flavored Sea Salt Revenue (million) Forecast, by Application 2019 & 2032
- Table 47: Rest of Asia Pacific Flavored Sea Salt Revenue (million) Forecast, by Application 2019 & 2032
Frequently Asked Questions
1. What is the projected Compound Annual Growth Rate (CAGR) of the Flavored Sea Salt?
The projected CAGR is approximately XX%.
2. Which companies are prominent players in the Flavored Sea Salt?
Key companies in the market include SaltWorks, SeaSalt Superstore, Amagansett Sea Salt, HimalaSalt, Monterey Bay Salt, Cornish Sea Salt, Jacobsen Salt, Maine Sea Salt, Salt Traders, Saltbird, Bitterman and Sons.
3. What are the main segments of the Flavored Sea Salt?
The market segments include Application, Types.
4. Can you provide details about the market size?
The market size is estimated to be USD XXX million as of 2022.
5. What are some drivers contributing to market growth?
N/A
6. What are the notable trends driving market growth?
N/A
7. Are there any restraints impacting market growth?
N/A
8. Can you provide examples of recent developments in the market?
N/A
9. What pricing options are available for accessing the report?
Pricing options include single-user, multi-user, and enterprise licenses priced at USD 2900.00, USD 4350.00, and USD 5800.00 respectively.
10. Is the market size provided in terms of value or volume?
The market size is provided in terms of value, measured in million.
11. Are there any specific market keywords associated with the report?
Yes, the market keyword associated with the report is "Flavored Sea Salt," which aids in identifying and referencing the specific market segment covered.
12. How do I determine which pricing option suits my needs best?
The pricing options vary based on user requirements and access needs. Individual users may opt for single-user licenses, while businesses requiring broader access may choose multi-user or enterprise licenses for cost-effective access to the report.
13. Are there any additional resources or data provided in the Flavored Sea Salt report?
While the report offers comprehensive insights, it's advisable to review the specific contents or supplementary materials provided to ascertain if additional resources or data are available.
14. How can I stay updated on further developments or reports in the Flavored Sea Salt?
To stay informed about further developments, trends, and reports in the Flavored Sea Salt, consider subscribing to industry newsletters, following relevant companies and organizations, or regularly checking reputable industry news sources and publications.
Methodology
Step 1 - Identification of Relevant Samples Size from Population Database


Step 2 - Approaches for Defining Global Market Size (Value, Volume* & Price*)

Note*: In applicable scenarios
Step 3 - Data Sources
Primary Research
- Web Analytics
- Survey Reports
- Research Institute
- Latest Research Reports
- Opinion Leaders
Secondary Research
- Annual Reports
- White Paper
- Latest Press Release
- Industry Association
- Paid Database
- Investor Presentations

Step 4 - Data Triangulation
Involves using different sources of information in order to increase the validity of a study
These sources are likely to be stakeholders in a program - participants, other researchers, program staff, other community members, and so on.
Then we put all data in single framework & apply various statistical tools to find out the dynamic on the market.
During the analysis stage, feedback from the stakeholder groups would be compared to determine areas of agreement as well as areas of divergence


