

Key Insights
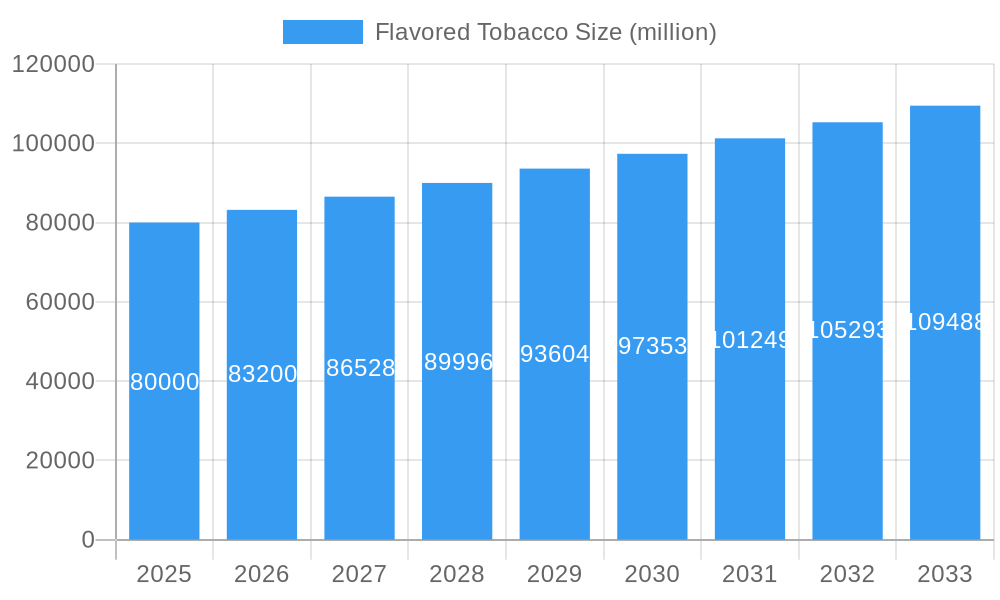
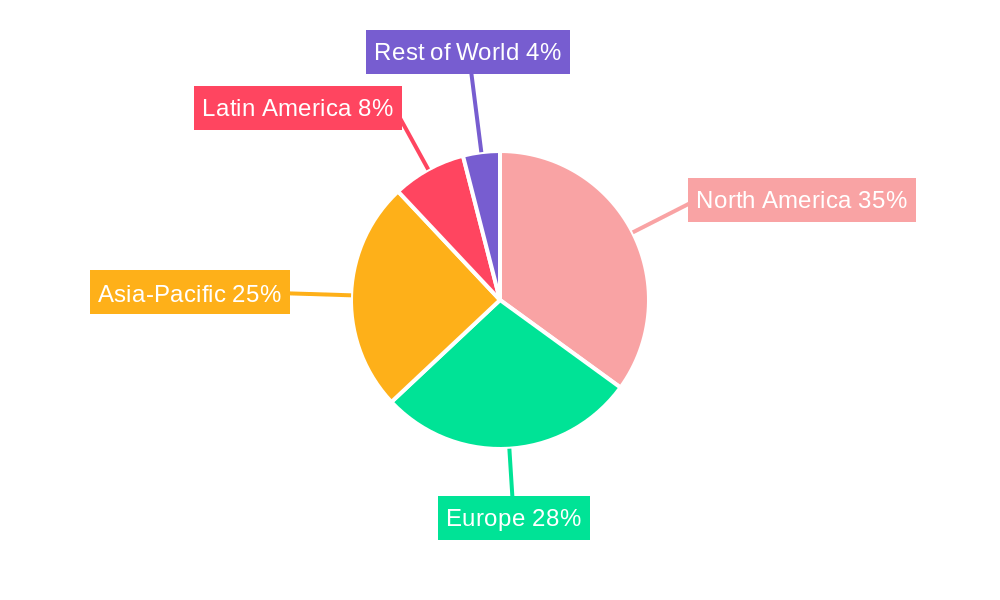
The global flavored tobacco market is a dynamic sector experiencing significant growth, driven by evolving consumer preferences and innovative product development. While precise market sizing data is unavailable, a reasonable estimation based on industry reports and publicly available financial information from major players like Altria Group and British American Tobacco suggests a current market size (2025) in the range of $80 billion USD. This substantial value reflects the enduring appeal of flavored tobacco products, despite increasing regulatory scrutiny and public health concerns. The Compound Annual Growth Rate (CAGR) is estimated at approximately 3-5% over the forecast period (2025-2033). Key drivers include the ongoing development of novel flavor profiles catering to evolving consumer tastes, aggressive marketing campaigns targeting younger demographics, and the relative affordability compared to other nicotine delivery systems. However, the market faces considerable headwinds. Stricter regulations concerning flavor additives and restrictions on marketing are key restraints. Moreover, growing awareness of the severe health consequences associated with tobacco use is leading to a shift in consumer behavior, with increased adoption of cessation products and alternative nicotine sources. The market is segmented by product type (e.g., menthol cigarettes, flavored cigars, smokeless tobacco with flavorings), geographic region (with North America, Europe, and Asia-Pacific representing significant shares), and distribution channels (retail, online). The competitive landscape is dominated by major multinational tobacco companies, such as Philip Morris International, British American Tobacco, and Imperial Brands, each employing diverse strategies to maintain market share and navigate regulatory changes. The forecast suggests a continued, albeit moderated, expansion of the flavored tobacco market, largely influenced by the complex interplay between consumer demand, regulatory pressures, and public health initiatives.
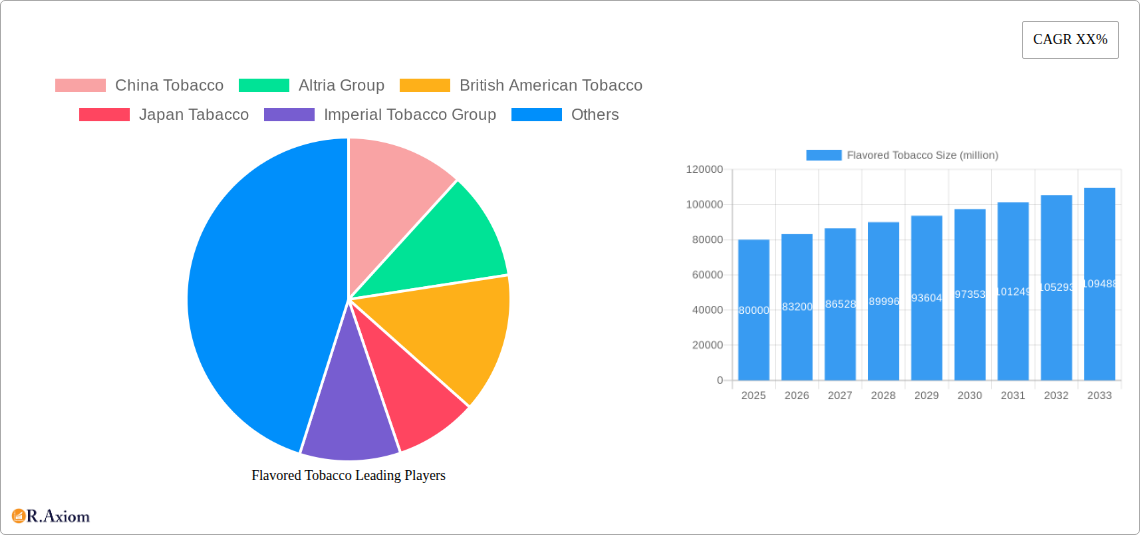
Flavored Tobacco Market Size (In Billion)
The long-term outlook for the flavored tobacco market depends heavily on future regulatory actions. The increasing prevalence of e-cigarettes and heated tobacco products adds complexity to the market, posing both threats and opportunities. Successful players will need to adapt to changing consumer preferences, innovate in product development to meet evolving tastes, and navigate the complex legal and ethical considerations associated with marketing and distribution. Geographic variations in regulatory frameworks will continue to shape the market landscape, with some regions experiencing faster growth than others. The emerging popularity of vaping, while offering a potentially less harmful alternative, also presents a competitive challenge, compelling tobacco companies to reassess their strategies and portfolios. The ongoing evolution of this market demands rigorous monitoring of regulatory changes and a keen understanding of evolving consumer behavior to accurately predict future trends and market performance.
Flavored Tobacco Company Market Share
This comprehensive report provides an in-depth analysis of the global flavored tobacco market, offering invaluable insights for industry stakeholders, investors, and researchers. The study period spans from 2019 to 2033, with 2025 serving as both the base and estimated year. The forecast period covers 2025-2033, and the historical period encompasses 2019-2024. This report utilizes millions (M) for all value representations. We project xx M for values that aren't readily available.
Flavored Tobacco Market Concentration & Innovation
This section analyzes the market concentration, focusing on key players like China Tobacco, Altria Group (Altria Group), British American Tobacco (British American Tobacco), Japan Tobacco, Imperial Tobacco Group, KT&G, Universal, Alliance One International (Alliance One International), R.J. Reynolds (R.J. Reynolds), PT Gudang Garam Tbk, Donskoy Tabak, Taiwan Tobacco & Liquor, and Thailand Tobacco Monopoly. We examine their market share and analyze the impact of mergers and acquisitions (M&A) activities, with estimated deal values reaching xx M in the period under review.
- Market Concentration: The market exhibits a high degree of concentration, with the top five players holding approximately xx% of the global market share in 2024.
- Innovation Drivers: Innovation is driven by consumer demand for novel flavors, reduced-risk products, and technological advancements in flavor delivery systems.
- Regulatory Frameworks: Stringent regulations regarding flavored tobacco products significantly impact market dynamics and vary across different regions.
- Product Substitutes: The rise of vaping and other nicotine alternatives presents a significant competitive challenge.
- End-User Trends: Consumer preferences for specific flavors and product formats are constantly evolving, influencing product development and marketing strategies.
- M&A Activities: Strategic acquisitions and mergers are reshaping the market landscape, leading to increased consolidation.
Flavored Tobacco Industry Trends & Insights
This section delves into the key trends shaping the flavored tobacco market. We examine market growth drivers, highlighting a Compound Annual Growth Rate (CAGR) of xx% during the forecast period (2025-2033). Technological disruptions, such as the emergence of heated tobacco products, are analyzed alongside evolving consumer preferences for specific flavors and product formats. Market penetration is projected to reach xx% by 2033, driven by increased demand in developing economies. Competitive dynamics, including pricing strategies, branding, and distribution channels, are also explored in detail.
Dominant Markets & Segments in Flavored Tobacco
This section identifies the leading regions, countries, and segments within the flavored tobacco market. We analyze the dominance of specific geographic areas, pinpointing factors contributing to this leadership.
- Key Drivers (Leading Region/Country):
- Favorable economic policies and strong disposable income.
- Robust infrastructure supporting distribution networks.
- High prevalence of smoking and established tobacco consumption culture.
- Dominance Analysis: The region's dominance is primarily attributed to its large consumer base, established distribution networks, and relatively less stringent regulations compared to other regions. This region also demonstrates a higher rate of adoption for new flavored tobacco products and related technology.
Flavored Tobacco Product Developments
Recent product innovations focus on technological advancements to enhance flavor delivery, such as heated tobacco products and improved flavor encapsulation techniques. These innovations aim to improve the consumer experience and cater to diverse preferences, offering a competitive advantage in the market.
Report Scope & Segmentation Analysis
This report segments the flavored tobacco market based on product type (e.g., cigarettes, cigars, smokeless tobacco), flavor type (e.g., menthol, fruit, spice), and geographic region. Each segment's growth projections, market size, and competitive dynamics are analyzed separately, providing a comprehensive overview of the market landscape. For example, the menthol segment is projected to witness a CAGR of xx% during the forecast period, driven by strong demand, particularly in certain regions.
Key Drivers of Flavored Tobacco Growth
Several factors contribute to the growth of the flavored tobacco market. These include technological advancements in flavor delivery and product design, expanding consumer bases in emerging economies, and evolving consumer preferences for new and diverse flavors. Additionally, relatively lower prices in some markets compared to non-flavored products also contribute to market growth.
Challenges in the Flavored Tobacco Sector
The flavored tobacco sector faces several challenges, including stringent regulations globally, leading to market restrictions and impacting sales volumes. Supply chain disruptions due to geopolitical factors and unforeseen events, cause market fluctuations. Intense competition among established players also poses a significant challenge. These factors negatively impact market growth and profitability, with estimates suggesting a xx M reduction in revenue during the period.
Emerging Opportunities in Flavored Tobacco
Emerging opportunities lie in exploring new markets in developing economies, introducing innovative product formats, and catering to evolving consumer preferences toward reduced-risk products. This includes capitalizing on the potential for growth in heated tobacco products and other novel nicotine delivery systems.
Leading Players in the Flavored Tobacco Market
- China Tobacco
- Altria Group
- British American Tobacco
- Japan Tobacco
- Imperial Tobacco Group
- KT&G
- Universal
- Alliance One International
- R.J. Reynolds
- PT Gudang Garam Tbk
- Donskoy Tabak
- Taiwan Tobacco & Liquor
- Thailand Tobacco Monopoly
Key Developments in Flavored Tobacco Industry
- 2022 Q3: Increased regulatory scrutiny on menthol cigarettes in several key markets.
- 2023 Q1: Launch of a new heated tobacco product by a major player.
- 2024 Q2: Significant M&A activity involving two key players, resulting in a xx M deal.
Strategic Outlook for Flavored Tobacco Market
The flavored tobacco market is expected to experience continued growth, driven by factors such as increasing consumer demand in emerging markets and ongoing innovation in product development. However, regulatory changes and competition from alternative nicotine products will continue to shape market dynamics. The market presents opportunities for strategic players to capitalize on evolving consumer preferences and technological advancements.
Flavored Tobacco Segmentation
-
1. Application
- 1.1. Male Smokers
- 1.2. Female Smokers
-
2. Types
- 2.1. Menthol Cigarette
- 2.2. Chocolate Cigarette
- 2.3. Others
Flavored Tobacco Segmentation By Geography
-
1. North America
- 1.1. United States
- 1.2. Canada
- 1.3. Mexico
-
2. South America
- 2.1. Brazil
- 2.2. Argentina
- 2.3. Rest of South America
-
3. Europe
- 3.1. United Kingdom
- 3.2. Germany
- 3.3. France
- 3.4. Italy
- 3.5. Spain
- 3.6. Russia
- 3.7. Benelux
- 3.8. Nordics
- 3.9. Rest of Europe
-
4. Middle East & Africa
- 4.1. Turkey
- 4.2. Israel
- 4.3. GCC
- 4.4. North Africa
- 4.5. South Africa
- 4.6. Rest of Middle East & Africa
-
5. Asia Pacific
- 5.1. China
- 5.2. India
- 5.3. Japan
- 5.4. South Korea
- 5.5. ASEAN
- 5.6. Oceania
- 5.7. Rest of Asia Pacific
Flavored Tobacco Regional Market Share
Geographic Coverage of Flavored Tobacco
Flavored Tobacco REPORT HIGHLIGHTS
| Aspects | Details |
|---|---|
| Study Period | 2020-2034 |
| Base Year | 2025 |
| Estimated Year | 2026 |
| Forecast Period | 2026-2034 |
| Historical Period | 2020-2025 |
| Growth Rate | CAGR of 3.2% from 2020-2034 |
| Segmentation |
|
Table of Contents
- 1. Introduction
- 1.1. Research Scope
- 1.2. Market Segmentation
- 1.3. Research Methodology
- 1.4. Definitions and Assumptions
- 2. Executive Summary
- 2.1. Introduction
- 3. Market Dynamics
- 3.1. Introduction
- 3.2. Market Drivers
- 3.3. Market Restrains
- 3.4. Market Trends
- 4. Market Factor Analysis
- 4.1. Porters Five Forces
- 4.2. Supply/Value Chain
- 4.3. PESTEL analysis
- 4.4. Market Entropy
- 4.5. Patent/Trademark Analysis
- 5. Global Flavored Tobacco Analysis, Insights and Forecast, 2020-2032
- 5.1. Market Analysis, Insights and Forecast - by Application
- 5.1.1. Male Smokers
- 5.1.2. Female Smokers
- 5.2. Market Analysis, Insights and Forecast - by Types
- 5.2.1. Menthol Cigarette
- 5.2.2. Chocolate Cigarette
- 5.2.3. Others
- 5.3. Market Analysis, Insights and Forecast - by Region
- 5.3.1. North America
- 5.3.2. South America
- 5.3.3. Europe
- 5.3.4. Middle East & Africa
- 5.3.5. Asia Pacific
- 5.1. Market Analysis, Insights and Forecast - by Application
- 6. North America Flavored Tobacco Analysis, Insights and Forecast, 2020-2032
- 6.1. Market Analysis, Insights and Forecast - by Application
- 6.1.1. Male Smokers
- 6.1.2. Female Smokers
- 6.2. Market Analysis, Insights and Forecast - by Types
- 6.2.1. Menthol Cigarette
- 6.2.2. Chocolate Cigarette
- 6.2.3. Others
- 6.1. Market Analysis, Insights and Forecast - by Application
- 7. South America Flavored Tobacco Analysis, Insights and Forecast, 2020-2032
- 7.1. Market Analysis, Insights and Forecast - by Application
- 7.1.1. Male Smokers
- 7.1.2. Female Smokers
- 7.2. Market Analysis, Insights and Forecast - by Types
- 7.2.1. Menthol Cigarette
- 7.2.2. Chocolate Cigarette
- 7.2.3. Others
- 7.1. Market Analysis, Insights and Forecast - by Application
- 8. Europe Flavored Tobacco Analysis, Insights and Forecast, 2020-2032
- 8.1. Market Analysis, Insights and Forecast - by Application
- 8.1.1. Male Smokers
- 8.1.2. Female Smokers
- 8.2. Market Analysis, Insights and Forecast - by Types
- 8.2.1. Menthol Cigarette
- 8.2.2. Chocolate Cigarette
- 8.2.3. Others
- 8.1. Market Analysis, Insights and Forecast - by Application
- 9. Middle East & Africa Flavored Tobacco Analysis, Insights and Forecast, 2020-2032
- 9.1. Market Analysis, Insights and Forecast - by Application
- 9.1.1. Male Smokers
- 9.1.2. Female Smokers
- 9.2. Market Analysis, Insights and Forecast - by Types
- 9.2.1. Menthol Cigarette
- 9.2.2. Chocolate Cigarette
- 9.2.3. Others
- 9.1. Market Analysis, Insights and Forecast - by Application
- 10. Asia Pacific Flavored Tobacco Analysis, Insights and Forecast, 2020-2032
- 10.1. Market Analysis, Insights and Forecast - by Application
- 10.1.1. Male Smokers
- 10.1.2. Female Smokers
- 10.2. Market Analysis, Insights and Forecast - by Types
- 10.2.1. Menthol Cigarette
- 10.2.2. Chocolate Cigarette
- 10.2.3. Others
- 10.1. Market Analysis, Insights and Forecast - by Application
- 11. Competitive Analysis
- 11.1. Global Market Share Analysis 2025
- 11.2. Company Profiles
- 11.2.1 China Tobacco
- 11.2.1.1. Overview
- 11.2.1.2. Products
- 11.2.1.3. SWOT Analysis
- 11.2.1.4. Recent Developments
- 11.2.1.5. Financials (Based on Availability)
- 11.2.2 Altria Group
- 11.2.2.1. Overview
- 11.2.2.2. Products
- 11.2.2.3. SWOT Analysis
- 11.2.2.4. Recent Developments
- 11.2.2.5. Financials (Based on Availability)
- 11.2.3 British American Tobacco
- 11.2.3.1. Overview
- 11.2.3.2. Products
- 11.2.3.3. SWOT Analysis
- 11.2.3.4. Recent Developments
- 11.2.3.5. Financials (Based on Availability)
- 11.2.4 Japan Tabacco
- 11.2.4.1. Overview
- 11.2.4.2. Products
- 11.2.4.3. SWOT Analysis
- 11.2.4.4. Recent Developments
- 11.2.4.5. Financials (Based on Availability)
- 11.2.5 Imperial Tobacco Group
- 11.2.5.1. Overview
- 11.2.5.2. Products
- 11.2.5.3. SWOT Analysis
- 11.2.5.4. Recent Developments
- 11.2.5.5. Financials (Based on Availability)
- 11.2.6 KT&G
- 11.2.6.1. Overview
- 11.2.6.2. Products
- 11.2.6.3. SWOT Analysis
- 11.2.6.4. Recent Developments
- 11.2.6.5. Financials (Based on Availability)
- 11.2.7 Universal
- 11.2.7.1. Overview
- 11.2.7.2. Products
- 11.2.7.3. SWOT Analysis
- 11.2.7.4. Recent Developments
- 11.2.7.5. Financials (Based on Availability)
- 11.2.8 Alliance One International
- 11.2.8.1. Overview
- 11.2.8.2. Products
- 11.2.8.3. SWOT Analysis
- 11.2.8.4. Recent Developments
- 11.2.8.5. Financials (Based on Availability)
- 11.2.9 R.J. Reynolds
- 11.2.9.1. Overview
- 11.2.9.2. Products
- 11.2.9.3. SWOT Analysis
- 11.2.9.4. Recent Developments
- 11.2.9.5. Financials (Based on Availability)
- 11.2.10 PT Gudang Garam Tbk
- 11.2.10.1. Overview
- 11.2.10.2. Products
- 11.2.10.3. SWOT Analysis
- 11.2.10.4. Recent Developments
- 11.2.10.5. Financials (Based on Availability)
- 11.2.11 Donskoy Tabak
- 11.2.11.1. Overview
- 11.2.11.2. Products
- 11.2.11.3. SWOT Analysis
- 11.2.11.4. Recent Developments
- 11.2.11.5. Financials (Based on Availability)
- 11.2.12 Taiwan Tobacco & Liquor
- 11.2.12.1. Overview
- 11.2.12.2. Products
- 11.2.12.3. SWOT Analysis
- 11.2.12.4. Recent Developments
- 11.2.12.5. Financials (Based on Availability)
- 11.2.13 Thailand Tobacco Monopoly
- 11.2.13.1. Overview
- 11.2.13.2. Products
- 11.2.13.3. SWOT Analysis
- 11.2.13.4. Recent Developments
- 11.2.13.5. Financials (Based on Availability)
- 11.2.14 Competitive Landscape
- 11.2.14.1. Overview
- 11.2.14.2. Products
- 11.2.14.3. SWOT Analysis
- 11.2.14.4. Recent Developments
- 11.2.14.5. Financials (Based on Availability)
- 11.2.1 China Tobacco
List of Figures
- Figure 1: Global Flavored Tobacco Revenue Breakdown (undefined, %) by Region 2025 & 2033
- Figure 2: Global Flavored Tobacco Volume Breakdown (K, %) by Region 2025 & 2033
- Figure 3: North America Flavored Tobacco Revenue (undefined), by Application 2025 & 2033
- Figure 4: North America Flavored Tobacco Volume (K), by Application 2025 & 2033
- Figure 5: North America Flavored Tobacco Revenue Share (%), by Application 2025 & 2033
- Figure 6: North America Flavored Tobacco Volume Share (%), by Application 2025 & 2033
- Figure 7: North America Flavored Tobacco Revenue (undefined), by Types 2025 & 2033
- Figure 8: North America Flavored Tobacco Volume (K), by Types 2025 & 2033
- Figure 9: North America Flavored Tobacco Revenue Share (%), by Types 2025 & 2033
- Figure 10: North America Flavored Tobacco Volume Share (%), by Types 2025 & 2033
- Figure 11: North America Flavored Tobacco Revenue (undefined), by Country 2025 & 2033
- Figure 12: North America Flavored Tobacco Volume (K), by Country 2025 & 2033
- Figure 13: North America Flavored Tobacco Revenue Share (%), by Country 2025 & 2033
- Figure 14: North America Flavored Tobacco Volume Share (%), by Country 2025 & 2033
- Figure 15: South America Flavored Tobacco Revenue (undefined), by Application 2025 & 2033
- Figure 16: South America Flavored Tobacco Volume (K), by Application 2025 & 2033
- Figure 17: South America Flavored Tobacco Revenue Share (%), by Application 2025 & 2033
- Figure 18: South America Flavored Tobacco Volume Share (%), by Application 2025 & 2033
- Figure 19: South America Flavored Tobacco Revenue (undefined), by Types 2025 & 2033
- Figure 20: South America Flavored Tobacco Volume (K), by Types 2025 & 2033
- Figure 21: South America Flavored Tobacco Revenue Share (%), by Types 2025 & 2033
- Figure 22: South America Flavored Tobacco Volume Share (%), by Types 2025 & 2033
- Figure 23: South America Flavored Tobacco Revenue (undefined), by Country 2025 & 2033
- Figure 24: South America Flavored Tobacco Volume (K), by Country 2025 & 2033
- Figure 25: South America Flavored Tobacco Revenue Share (%), by Country 2025 & 2033
- Figure 26: South America Flavored Tobacco Volume Share (%), by Country 2025 & 2033
- Figure 27: Europe Flavored Tobacco Revenue (undefined), by Application 2025 & 2033
- Figure 28: Europe Flavored Tobacco Volume (K), by Application 2025 & 2033
- Figure 29: Europe Flavored Tobacco Revenue Share (%), by Application 2025 & 2033
- Figure 30: Europe Flavored Tobacco Volume Share (%), by Application 2025 & 2033
- Figure 31: Europe Flavored Tobacco Revenue (undefined), by Types 2025 & 2033
- Figure 32: Europe Flavored Tobacco Volume (K), by Types 2025 & 2033
- Figure 33: Europe Flavored Tobacco Revenue Share (%), by Types 2025 & 2033
- Figure 34: Europe Flavored Tobacco Volume Share (%), by Types 2025 & 2033
- Figure 35: Europe Flavored Tobacco Revenue (undefined), by Country 2025 & 2033
- Figure 36: Europe Flavored Tobacco Volume (K), by Country 2025 & 2033
- Figure 37: Europe Flavored Tobacco Revenue Share (%), by Country 2025 & 2033
- Figure 38: Europe Flavored Tobacco Volume Share (%), by Country 2025 & 2033
- Figure 39: Middle East & Africa Flavored Tobacco Revenue (undefined), by Application 2025 & 2033
- Figure 40: Middle East & Africa Flavored Tobacco Volume (K), by Application 2025 & 2033
- Figure 41: Middle East & Africa Flavored Tobacco Revenue Share (%), by Application 2025 & 2033
- Figure 42: Middle East & Africa Flavored Tobacco Volume Share (%), by Application 2025 & 2033
- Figure 43: Middle East & Africa Flavored Tobacco Revenue (undefined), by Types 2025 & 2033
- Figure 44: Middle East & Africa Flavored Tobacco Volume (K), by Types 2025 & 2033
- Figure 45: Middle East & Africa Flavored Tobacco Revenue Share (%), by Types 2025 & 2033
- Figure 46: Middle East & Africa Flavored Tobacco Volume Share (%), by Types 2025 & 2033
- Figure 47: Middle East & Africa Flavored Tobacco Revenue (undefined), by Country 2025 & 2033
- Figure 48: Middle East & Africa Flavored Tobacco Volume (K), by Country 2025 & 2033
- Figure 49: Middle East & Africa Flavored Tobacco Revenue Share (%), by Country 2025 & 2033
- Figure 50: Middle East & Africa Flavored Tobacco Volume Share (%), by Country 2025 & 2033
- Figure 51: Asia Pacific Flavored Tobacco Revenue (undefined), by Application 2025 & 2033
- Figure 52: Asia Pacific Flavored Tobacco Volume (K), by Application 2025 & 2033
- Figure 53: Asia Pacific Flavored Tobacco Revenue Share (%), by Application 2025 & 2033
- Figure 54: Asia Pacific Flavored Tobacco Volume Share (%), by Application 2025 & 2033
- Figure 55: Asia Pacific Flavored Tobacco Revenue (undefined), by Types 2025 & 2033
- Figure 56: Asia Pacific Flavored Tobacco Volume (K), by Types 2025 & 2033
- Figure 57: Asia Pacific Flavored Tobacco Revenue Share (%), by Types 2025 & 2033
- Figure 58: Asia Pacific Flavored Tobacco Volume Share (%), by Types 2025 & 2033
- Figure 59: Asia Pacific Flavored Tobacco Revenue (undefined), by Country 2025 & 2033
- Figure 60: Asia Pacific Flavored Tobacco Volume (K), by Country 2025 & 2033
- Figure 61: Asia Pacific Flavored Tobacco Revenue Share (%), by Country 2025 & 2033
- Figure 62: Asia Pacific Flavored Tobacco Volume Share (%), by Country 2025 & 2033
List of Tables
- Table 1: Global Flavored Tobacco Revenue undefined Forecast, by Application 2020 & 2033
- Table 2: Global Flavored Tobacco Volume K Forecast, by Application 2020 & 2033
- Table 3: Global Flavored Tobacco Revenue undefined Forecast, by Types 2020 & 2033
- Table 4: Global Flavored Tobacco Volume K Forecast, by Types 2020 & 2033
- Table 5: Global Flavored Tobacco Revenue undefined Forecast, by Region 2020 & 2033
- Table 6: Global Flavored Tobacco Volume K Forecast, by Region 2020 & 2033
- Table 7: Global Flavored Tobacco Revenue undefined Forecast, by Application 2020 & 2033
- Table 8: Global Flavored Tobacco Volume K Forecast, by Application 2020 & 2033
- Table 9: Global Flavored Tobacco Revenue undefined Forecast, by Types 2020 & 2033
- Table 10: Global Flavored Tobacco Volume K Forecast, by Types 2020 & 2033
- Table 11: Global Flavored Tobacco Revenue undefined Forecast, by Country 2020 & 2033
- Table 12: Global Flavored Tobacco Volume K Forecast, by Country 2020 & 2033
- Table 13: United States Flavored Tobacco Revenue (undefined) Forecast, by Application 2020 & 2033
- Table 14: United States Flavored Tobacco Volume (K) Forecast, by Application 2020 & 2033
- Table 15: Canada Flavored Tobacco Revenue (undefined) Forecast, by Application 2020 & 2033
- Table 16: Canada Flavored Tobacco Volume (K) Forecast, by Application 2020 & 2033
- Table 17: Mexico Flavored Tobacco Revenue (undefined) Forecast, by Application 2020 & 2033
- Table 18: Mexico Flavored Tobacco Volume (K) Forecast, by Application 2020 & 2033
- Table 19: Global Flavored Tobacco Revenue undefined Forecast, by Application 2020 & 2033
- Table 20: Global Flavored Tobacco Volume K Forecast, by Application 2020 & 2033
- Table 21: Global Flavored Tobacco Revenue undefined Forecast, by Types 2020 & 2033
- Table 22: Global Flavored Tobacco Volume K Forecast, by Types 2020 & 2033
- Table 23: Global Flavored Tobacco Revenue undefined Forecast, by Country 2020 & 2033
- Table 24: Global Flavored Tobacco Volume K Forecast, by Country 2020 & 2033
- Table 25: Brazil Flavored Tobacco Revenue (undefined) Forecast, by Application 2020 & 2033
- Table 26: Brazil Flavored Tobacco Volume (K) Forecast, by Application 2020 & 2033
- Table 27: Argentina Flavored Tobacco Revenue (undefined) Forecast, by Application 2020 & 2033
- Table 28: Argentina Flavored Tobacco Volume (K) Forecast, by Application 2020 & 2033
- Table 29: Rest of South America Flavored Tobacco Revenue (undefined) Forecast, by Application 2020 & 2033
- Table 30: Rest of South America Flavored Tobacco Volume (K) Forecast, by Application 2020 & 2033
- Table 31: Global Flavored Tobacco Revenue undefined Forecast, by Application 2020 & 2033
- Table 32: Global Flavored Tobacco Volume K Forecast, by Application 2020 & 2033
- Table 33: Global Flavored Tobacco Revenue undefined Forecast, by Types 2020 & 2033
- Table 34: Global Flavored Tobacco Volume K Forecast, by Types 2020 & 2033
- Table 35: Global Flavored Tobacco Revenue undefined Forecast, by Country 2020 & 2033
- Table 36: Global Flavored Tobacco Volume K Forecast, by Country 2020 & 2033
- Table 37: United Kingdom Flavored Tobacco Revenue (undefined) Forecast, by Application 2020 & 2033
- Table 38: United Kingdom Flavored Tobacco Volume (K) Forecast, by Application 2020 & 2033
- Table 39: Germany Flavored Tobacco Revenue (undefined) Forecast, by Application 2020 & 2033
- Table 40: Germany Flavored Tobacco Volume (K) Forecast, by Application 2020 & 2033
- Table 41: France Flavored Tobacco Revenue (undefined) Forecast, by Application 2020 & 2033
- Table 42: France Flavored Tobacco Volume (K) Forecast, by Application 2020 & 2033
- Table 43: Italy Flavored Tobacco Revenue (undefined) Forecast, by Application 2020 & 2033
- Table 44: Italy Flavored Tobacco Volume (K) Forecast, by Application 2020 & 2033
- Table 45: Spain Flavored Tobacco Revenue (undefined) Forecast, by Application 2020 & 2033
- Table 46: Spain Flavored Tobacco Volume (K) Forecast, by Application 2020 & 2033
- Table 47: Russia Flavored Tobacco Revenue (undefined) Forecast, by Application 2020 & 2033
- Table 48: Russia Flavored Tobacco Volume (K) Forecast, by Application 2020 & 2033
- Table 49: Benelux Flavored Tobacco Revenue (undefined) Forecast, by Application 2020 & 2033
- Table 50: Benelux Flavored Tobacco Volume (K) Forecast, by Application 2020 & 2033
- Table 51: Nordics Flavored Tobacco Revenue (undefined) Forecast, by Application 2020 & 2033
- Table 52: Nordics Flavored Tobacco Volume (K) Forecast, by Application 2020 & 2033
- Table 53: Rest of Europe Flavored Tobacco Revenue (undefined) Forecast, by Application 2020 & 2033
- Table 54: Rest of Europe Flavored Tobacco Volume (K) Forecast, by Application 2020 & 2033
- Table 55: Global Flavored Tobacco Revenue undefined Forecast, by Application 2020 & 2033
- Table 56: Global Flavored Tobacco Volume K Forecast, by Application 2020 & 2033
- Table 57: Global Flavored Tobacco Revenue undefined Forecast, by Types 2020 & 2033
- Table 58: Global Flavored Tobacco Volume K Forecast, by Types 2020 & 2033
- Table 59: Global Flavored Tobacco Revenue undefined Forecast, by Country 2020 & 2033
- Table 60: Global Flavored Tobacco Volume K Forecast, by Country 2020 & 2033
- Table 61: Turkey Flavored Tobacco Revenue (undefined) Forecast, by Application 2020 & 2033
- Table 62: Turkey Flavored Tobacco Volume (K) Forecast, by Application 2020 & 2033
- Table 63: Israel Flavored Tobacco Revenue (undefined) Forecast, by Application 2020 & 2033
- Table 64: Israel Flavored Tobacco Volume (K) Forecast, by Application 2020 & 2033
- Table 65: GCC Flavored Tobacco Revenue (undefined) Forecast, by Application 2020 & 2033
- Table 66: GCC Flavored Tobacco Volume (K) Forecast, by Application 2020 & 2033
- Table 67: North Africa Flavored Tobacco Revenue (undefined) Forecast, by Application 2020 & 2033
- Table 68: North Africa Flavored Tobacco Volume (K) Forecast, by Application 2020 & 2033
- Table 69: South Africa Flavored Tobacco Revenue (undefined) Forecast, by Application 2020 & 2033
- Table 70: South Africa Flavored Tobacco Volume (K) Forecast, by Application 2020 & 2033
- Table 71: Rest of Middle East & Africa Flavored Tobacco Revenue (undefined) Forecast, by Application 2020 & 2033
- Table 72: Rest of Middle East & Africa Flavored Tobacco Volume (K) Forecast, by Application 2020 & 2033
- Table 73: Global Flavored Tobacco Revenue undefined Forecast, by Application 2020 & 2033
- Table 74: Global Flavored Tobacco Volume K Forecast, by Application 2020 & 2033
- Table 75: Global Flavored Tobacco Revenue undefined Forecast, by Types 2020 & 2033
- Table 76: Global Flavored Tobacco Volume K Forecast, by Types 2020 & 2033
- Table 77: Global Flavored Tobacco Revenue undefined Forecast, by Country 2020 & 2033
- Table 78: Global Flavored Tobacco Volume K Forecast, by Country 2020 & 2033
- Table 79: China Flavored Tobacco Revenue (undefined) Forecast, by Application 2020 & 2033
- Table 80: China Flavored Tobacco Volume (K) Forecast, by Application 2020 & 2033
- Table 81: India Flavored Tobacco Revenue (undefined) Forecast, by Application 2020 & 2033
- Table 82: India Flavored Tobacco Volume (K) Forecast, by Application 2020 & 2033
- Table 83: Japan Flavored Tobacco Revenue (undefined) Forecast, by Application 2020 & 2033
- Table 84: Japan Flavored Tobacco Volume (K) Forecast, by Application 2020 & 2033
- Table 85: South Korea Flavored Tobacco Revenue (undefined) Forecast, by Application 2020 & 2033
- Table 86: South Korea Flavored Tobacco Volume (K) Forecast, by Application 2020 & 2033
- Table 87: ASEAN Flavored Tobacco Revenue (undefined) Forecast, by Application 2020 & 2033
- Table 88: ASEAN Flavored Tobacco Volume (K) Forecast, by Application 2020 & 2033
- Table 89: Oceania Flavored Tobacco Revenue (undefined) Forecast, by Application 2020 & 2033
- Table 90: Oceania Flavored Tobacco Volume (K) Forecast, by Application 2020 & 2033
- Table 91: Rest of Asia Pacific Flavored Tobacco Revenue (undefined) Forecast, by Application 2020 & 2033
- Table 92: Rest of Asia Pacific Flavored Tobacco Volume (K) Forecast, by Application 2020 & 2033
Frequently Asked Questions
1. What is the projected Compound Annual Growth Rate (CAGR) of the Flavored Tobacco?
The projected CAGR is approximately 3.2%.
2. Which companies are prominent players in the Flavored Tobacco?
Key companies in the market include China Tobacco, Altria Group, British American Tobacco, Japan Tabacco, Imperial Tobacco Group, KT&G, Universal, Alliance One International, R.J. Reynolds, PT Gudang Garam Tbk, Donskoy Tabak, Taiwan Tobacco & Liquor, Thailand Tobacco Monopoly, Competitive Landscape.
3. What are the main segments of the Flavored Tobacco?
The market segments include Application, Types.
4. Can you provide details about the market size?
The market size is estimated to be USD XXX N/A as of 2022.
5. What are some drivers contributing to market growth?
N/A
6. What are the notable trends driving market growth?
N/A
7. Are there any restraints impacting market growth?
N/A
8. Can you provide examples of recent developments in the market?
N/A
9. What pricing options are available for accessing the report?
Pricing options include single-user, multi-user, and enterprise licenses priced at USD 3350.00, USD 5025.00, and USD 6700.00 respectively.
10. Is the market size provided in terms of value or volume?
The market size is provided in terms of value, measured in N/A and volume, measured in K.
11. Are there any specific market keywords associated with the report?
Yes, the market keyword associated with the report is "Flavored Tobacco," which aids in identifying and referencing the specific market segment covered.
12. How do I determine which pricing option suits my needs best?
The pricing options vary based on user requirements and access needs. Individual users may opt for single-user licenses, while businesses requiring broader access may choose multi-user or enterprise licenses for cost-effective access to the report.
13. Are there any additional resources or data provided in the Flavored Tobacco report?
While the report offers comprehensive insights, it's advisable to review the specific contents or supplementary materials provided to ascertain if additional resources or data are available.
14. How can I stay updated on further developments or reports in the Flavored Tobacco?
To stay informed about further developments, trends, and reports in the Flavored Tobacco, consider subscribing to industry newsletters, following relevant companies and organizations, or regularly checking reputable industry news sources and publications.
Methodology
Step 1 - Identification of Relevant Samples Size from Population Database


Step 2 - Approaches for Defining Global Market Size (Value, Volume* & Price*)

Note*: In applicable scenarios
Step 3 - Data Sources
Primary Research
- Web Analytics
- Survey Reports
- Research Institute
- Latest Research Reports
- Opinion Leaders
Secondary Research
- Annual Reports
- White Paper
- Latest Press Release
- Industry Association
- Paid Database
- Investor Presentations

Step 4 - Data Triangulation
Involves using different sources of information in order to increase the validity of a study
These sources are likely to be stakeholders in a program - participants, other researchers, program staff, other community members, and so on.
Then we put all data in single framework & apply various statistical tools to find out the dynamic on the market.
During the analysis stage, feedback from the stakeholder groups would be compared to determine areas of agreement as well as areas of divergence