

Key Insights
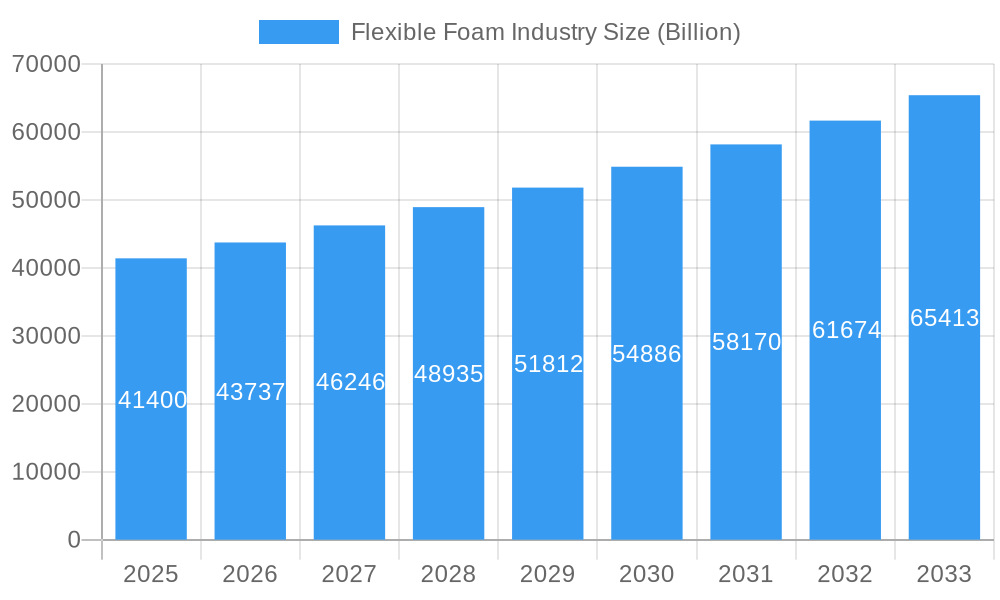
The global flexible foam market, projected to reach $52.19 billion by 2025, is anticipated to grow at a robust CAGR of 7.14% from 2025 to 2033. This expansion is driven by increasing demand from the construction, furniture, automotive, and consumer goods industries. Advancements in foam technology, focusing on enhanced durability, comfort, and eco-friendliness, are further stimulating market growth. Polyurethane foams and applications in the rapidly industrializing Asia-Pacific region are identified as key growth segments. Challenges include volatile raw material prices and environmental concerns, prompting a shift towards sustainable and recycled foam solutions.
Flexible Foam Industry Market Size (In Billion)
The competitive environment features major global players such as BASF, Dow, and Huntsman, alongside regional manufacturers. These companies are focusing on R&D, distribution networks, niche applications, and localized demand. Future market dynamics will be influenced by evolving consumer preferences for sustainable products, stringent environmental regulations, and technological innovations in high-performance foams. Strategic collaborations, M&A, and R&D investments will be critical for maintaining a competitive advantage in this evolving market.
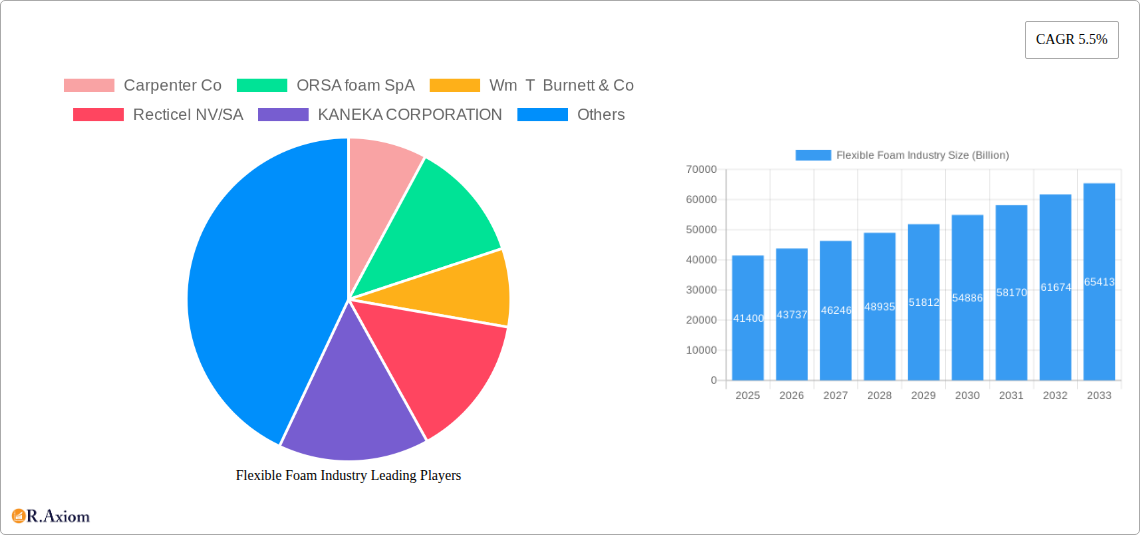
Flexible Foam Industry Company Market Share
Flexible Foam Industry: A Comprehensive Market Report (2019-2033)
This detailed report provides a comprehensive analysis of the flexible foam industry, encompassing market size, segmentation, key players, growth drivers, challenges, and future outlook. The study period covers 2019-2033, with 2025 as the base and estimated year. The report leverages a Billion-dollar valuation for all market figures, offering actionable insights for industry stakeholders. It analyzes market dynamics, competitive landscapes, and emerging trends across various applications and foam types, offering a thorough understanding of this dynamic sector.
Flexible Foam Industry Market Concentration & Innovation
The flexible foam industry exhibits a moderately concentrated market structure, with a handful of major players controlling a significant market share. While precise figures for market share are proprietary data, we estimate that the top ten companies control approximately 70% of the global Billion dollar market. Innovation is driven by several factors, including the development of sustainable materials, advancements in foam processing techniques, and the increasing demand for high-performance foams across diverse applications. The regulatory landscape plays a significant role, particularly concerning environmental regulations related to VOC emissions and material safety. Product substitutes like alternative insulation materials and recycled foams exert competitive pressure. End-user trends towards lightweight, energy-efficient, and sustainable products influence product development strategies.
M&A activity significantly impacts market consolidation. Recent deals, such as the Carpenter Co. acquisition of Recticel N.V.'s Engineered Foams Division (valued at xx Billion dollars) in March 2022 and William T. Burnett & Co.'s acquisition of Flex Foam in July 2022 (valued at xx Billion dollars), demonstrate the industry's inclination towards strategic mergers and acquisitions aimed at expanding geographic reach, product portfolios, and manufacturing capabilities. These transactions highlight the pursuit of economies of scale and vertical integration within the industry.
Flexible Foam Industry Industry Trends & Insights
The flexible foam market exhibits robust growth, projected to achieve a CAGR of xx% during the forecast period (2025-2033). This growth is fueled by rising demand across diverse end-use sectors, including construction, furniture, automotive, and consumer goods. Technological disruptions, such as the development of advanced foam formulations with enhanced properties like improved thermal insulation, increased durability, and lighter weight, are reshaping the competitive landscape. Consumer preferences are shifting toward eco-friendly, recyclable, and sustainable foam products, prompting manufacturers to invest in research and development of bio-based and recycled materials. The competitive dynamics are characterized by intense rivalry among established players and the emergence of innovative startups, leading to continuous product improvements and price competitiveness. Market penetration of new foam types, such as those with enhanced fire retardant properties or improved acoustic insulation, is driving growth.
Dominant Markets & Segments in Flexible Foam Industry
The global flexible foam market is geographically diverse, with North America and Europe representing major regions. However, Asia-Pacific is experiencing rapid growth driven by increasing industrialization and construction activities. Within the application segments, the construction sector exhibits high demand for flexible foams due to its use in insulation, soundproofing, and other applications. The furniture industry also utilizes significant quantities of flexible foam for cushioning and padding, while the automotive and transportation sectors utilize foams extensively in seats, interior components, and packaging.
- Key Drivers for Dominant Segments:
- Construction: Government initiatives promoting energy efficiency in buildings, rising construction spending, and growing urbanization.
- Furniture: Increased disposable incomes, changing lifestyles, and a preference for comfortable and ergonomic furniture.
- Transportation: Stringent safety regulations, lightweighting trends in vehicle manufacturing, and increasing demand for comfortable seating.
- Polyurethane Foam: This segment dominates due to its versatility, cost-effectiveness, and diverse applications.
- Polyethylene: This segment exhibits increasing demand due to its recyclable nature and cost efficiency.
Flexible Foam Industry Product Developments
Significant advancements in flexible foam technology include the introduction of bio-based foams, improved fire-retardant formulations, and foams with enhanced thermal insulation properties. These innovations cater to the increasing demand for sustainable, safe, and high-performance materials. Competition focuses on offering differentiated products with improved properties, addressing specific application requirements, and enhancing value for end-users. Manufacturers are integrating advanced technologies and focusing on customized solutions to meet individual customer needs.
Report Scope & Segmentation Analysis
This report segments the flexible foam market by application (Construction, Consumer Goods, Furniture, Transportation, Other Applications), type (Polyurethane, Polyether, Polyethylene, Non-cross linked Polypropylene), and region. Each segment's growth projections, market sizes, and competitive dynamics are comprehensively analyzed. The market size for each segment is presented for the historical period (2019-2024), base year (2025), and forecast period (2025-2033), providing a comprehensive understanding of market trends and future potential. Competition within each segment is influenced by factors such as product differentiation, pricing strategies, and geographic reach.
Key Drivers of Flexible Foam Industry Growth
Several factors drive the flexible foam industry's growth. These include rising construction activity globally, increasing demand for comfortable and ergonomic furniture, stringent safety regulations in the automotive industry, and continuous technological advancements in foam formulations leading to improved product performance and sustainability. Economic growth in developing economies boosts demand across several applications. Government regulations favoring energy efficiency and sustainable building materials propel the adoption of energy-efficient flexible foams.
Challenges in the Flexible Foam Industry Sector
The flexible foam industry faces challenges such as fluctuations in raw material prices, stringent environmental regulations leading to increased production costs, and intense competition among established players. Supply chain disruptions can impact production schedules and cost-effectiveness. The increasing adoption of alternative materials also presents competitive pressures. These factors influence profitability and necessitate strategic approaches to overcome these limitations.
Emerging Opportunities in Flexible Foam Industry
Emerging opportunities are driven by advancements in bio-based and recycled foams, increasing demand for lightweight and high-performance materials in various industries, and growth in specific applications like renewable energy (e.g., wind energy) and advanced packaging. The focus on sustainability and energy efficiency across industries opens new avenues for flexible foams with enhanced properties, contributing to market expansion.
Leading Players in the Flexible Foam Industry Market
- Carpenter Co
- ORSA foam SpA
- Wm T Burnett & Co
- Recticel NV/SA
- KANEKA CORPORATION
- Rogers Corporation
- BASF SE
- Huntsman International LLC
- Dow
- Inoac Corporation
- Woodbridge
- Greiner AG
- SEKISUI CHEMICAL CO LTD
- Sheela Foam Ltd
- American Excelsior Company
- Covestro AG
- Changzhou Xingang Plastic Products Co Ltd
Key Developments in Flexible Foam Industry Industry
- July 2022: William T. Burnett & Co. acquired Flex Foam, expanding its specialty urethane foam production capabilities.
- May 2022: Huntsman International LLC collaborated with BRUGG pipes to develop a next-generation polyurethane foam system for pre-insulated pipes.
- March 2022: Carpenter Co. acquired Recticel N.V.'s Engineered Foams Division, creating a globally leading polyurethane foam manufacturer.
Strategic Outlook for Flexible Foam Industry Market
The flexible foam market is poised for sustained growth driven by technological advancements, increasing demand across diverse sectors, and a focus on sustainability. Opportunities lie in developing innovative foam formulations with enhanced properties, expanding into new applications, and capitalizing on the growing demand for eco-friendly solutions. Companies that invest in R&D, embrace sustainable practices, and adapt to evolving market trends are well-positioned for success in this dynamic industry.
Flexible Foam Industry Segmentation
-
1. Type
-
1.1. Polyurethane
- 1.1.1. Polyester
- 1.1.2. Polyether
-
1.2. Polyethylene
- 1.2.1. Cross linked
- 1.2.2. Non-cross linked
- 1.3. Polypropylene
-
1.1. Polyurethane
-
2. Application
- 2.1. Construction
- 2.2. Consumer Goods
- 2.3. Furniture
- 2.4. Transportation
- 2.5. Other Applications
Flexible Foam Industry Segmentation By Geography
-
1. Asia Pacific
- 1.1. China
- 1.2. India
- 1.3. Japan
- 1.4. South Korea
- 1.5. Rest of Asia Pacific
-
2. North America
- 2.1. United States
- 2.2. Canada
- 2.3. Mexico
-
3. Europe
- 3.1. Germany
- 3.2. United Kingdom
- 3.3. Italy
- 3.4. France
- 3.5. Rest of Europe
-
4. South America
- 4.1. Brazil
- 4.2. Argentina
- 4.3. Rest of South America
-
5. Middle East and Africa
- 5.1. Saudi Arabia
- 5.2. South Africa
- 5.3. Rest of Middle East and Africa
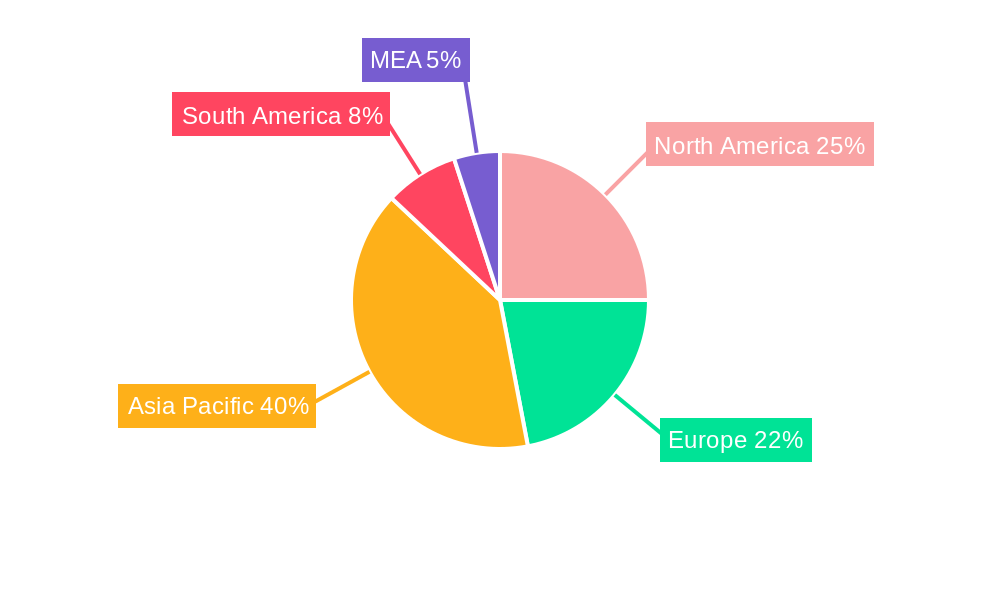
Flexible Foam Industry Regional Market Share
Geographic Coverage of Flexible Foam Industry
Flexible Foam Industry REPORT HIGHLIGHTS
| Aspects | Details |
|---|---|
| Study Period | 2020-2034 |
| Base Year | 2025 |
| Estimated Year | 2026 |
| Forecast Period | 2026-2034 |
| Historical Period | 2020-2025 |
| Growth Rate | CAGR of 7.14% from 2020-2034 |
| Segmentation |
|
Table of Contents
- 1. Introduction
- 1.1. Research Scope
- 1.2. Market Segmentation
- 1.3. Research Objective
- 1.4. Definitions and Assumptions
- 2. Executive Summary
- 2.1. Market Snapshot
- 3. Market Dynamics
- 3.1. Market Drivers
- 3.2. Market Restrains
- 3.3. Market Trends
- 3.4. Market Opportunities
- 4. Market Factor Analysis
- 4.1. Porters Five Forces
- 4.1.1. Bargaining Power of Suppliers
- 4.1.2. Bargaining Power of Buyers
- 4.1.3. Threat of New Entrants
- 4.1.4. Threat of Substitutes
- 4.1.5. Competitive Rivalry
- 4.2. PESTEL analysis
- 4.3. BCG Analysis
- 4.3.1. Stars (High Growth, High Market Share)
- 4.3.2. Cash Cows (Low Growth, High Market Share)
- 4.3.3. Question Mark (High Growth, Low Market Share)
- 4.3.4. Dogs (Low Growth, Low Market Share)
- 4.4. Ansoff Matrix Analysis
- 4.5. Supply Chain Analysis
- 4.6. Regulatory Landscape
- 4.7. Current Market Potential and Opportunity Assessment (TAM–SAM–SOM Framework)
- 4.8. RAX Analyst Note
- 4.1. Porters Five Forces
- 5. Market Analysis, Insights and Forecast 2021-2033
- 5.1. Market Analysis, Insights and Forecast - by Type
- 5.1.1. Polyurethane
- 5.1.1.1. Polyester
- 5.1.1.2. Polyether
- 5.1.2. Polyethylene
- 5.1.2.1. Cross linked
- 5.1.2.2. Non-cross linked
- 5.1.3. Polypropylene
- 5.1.1. Polyurethane
- 5.2. Market Analysis, Insights and Forecast - by Application
- 5.2.1. Construction
- 5.2.2. Consumer Goods
- 5.2.3. Furniture
- 5.2.4. Transportation
- 5.2.5. Other Applications
- 5.3. Market Analysis, Insights and Forecast - by Region
- 5.3.1. Asia Pacific
- 5.3.2. North America
- 5.3.3. Europe
- 5.3.4. South America
- 5.3.5. Middle East and Africa
- 5.1. Market Analysis, Insights and Forecast - by Type
- 6. Global Flexible Foam Industry Analysis, Insights and Forecast, 2021-2033
- 6.1. Market Analysis, Insights and Forecast - by Type
- 6.1.1. Polyurethane
- 6.1.1.1. Polyester
- 6.1.1.2. Polyether
- 6.1.2. Polyethylene
- 6.1.2.1. Cross linked
- 6.1.2.2. Non-cross linked
- 6.1.3. Polypropylene
- 6.1.1. Polyurethane
- 6.2. Market Analysis, Insights and Forecast - by Application
- 6.2.1. Construction
- 6.2.2. Consumer Goods
- 6.2.3. Furniture
- 6.2.4. Transportation
- 6.2.5. Other Applications
- 6.1. Market Analysis, Insights and Forecast - by Type
- 7. Asia Pacific Flexible Foam Industry Analysis, Insights and Forecast, 2020-2032
- 7.1. Market Analysis, Insights and Forecast - by Type
- 7.1.1. Polyurethane
- 7.1.1.1. Polyester
- 7.1.1.2. Polyether
- 7.1.2. Polyethylene
- 7.1.2.1. Cross linked
- 7.1.2.2. Non-cross linked
- 7.1.3. Polypropylene
- 7.1.1. Polyurethane
- 7.2. Market Analysis, Insights and Forecast - by Application
- 7.2.1. Construction
- 7.2.2. Consumer Goods
- 7.2.3. Furniture
- 7.2.4. Transportation
- 7.2.5. Other Applications
- 7.1. Market Analysis, Insights and Forecast - by Type
- 8. North America Flexible Foam Industry Analysis, Insights and Forecast, 2020-2032
- 8.1. Market Analysis, Insights and Forecast - by Type
- 8.1.1. Polyurethane
- 8.1.1.1. Polyester
- 8.1.1.2. Polyether
- 8.1.2. Polyethylene
- 8.1.2.1. Cross linked
- 8.1.2.2. Non-cross linked
- 8.1.3. Polypropylene
- 8.1.1. Polyurethane
- 8.2. Market Analysis, Insights and Forecast - by Application
- 8.2.1. Construction
- 8.2.2. Consumer Goods
- 8.2.3. Furniture
- 8.2.4. Transportation
- 8.2.5. Other Applications
- 8.1. Market Analysis, Insights and Forecast - by Type
- 9. Europe Flexible Foam Industry Analysis, Insights and Forecast, 2020-2032
- 9.1. Market Analysis, Insights and Forecast - by Type
- 9.1.1. Polyurethane
- 9.1.1.1. Polyester
- 9.1.1.2. Polyether
- 9.1.2. Polyethylene
- 9.1.2.1. Cross linked
- 9.1.2.2. Non-cross linked
- 9.1.3. Polypropylene
- 9.1.1. Polyurethane
- 9.2. Market Analysis, Insights and Forecast - by Application
- 9.2.1. Construction
- 9.2.2. Consumer Goods
- 9.2.3. Furniture
- 9.2.4. Transportation
- 9.2.5. Other Applications
- 9.1. Market Analysis, Insights and Forecast - by Type
- 10. South America Flexible Foam Industry Analysis, Insights and Forecast, 2020-2032
- 10.1. Market Analysis, Insights and Forecast - by Type
- 10.1.1. Polyurethane
- 10.1.1.1. Polyester
- 10.1.1.2. Polyether
- 10.1.2. Polyethylene
- 10.1.2.1. Cross linked
- 10.1.2.2. Non-cross linked
- 10.1.3. Polypropylene
- 10.1.1. Polyurethane
- 10.2. Market Analysis, Insights and Forecast - by Application
- 10.2.1. Construction
- 10.2.2. Consumer Goods
- 10.2.3. Furniture
- 10.2.4. Transportation
- 10.2.5. Other Applications
- 10.1. Market Analysis, Insights and Forecast - by Type
- 11. Middle East and Africa Flexible Foam Industry Analysis, Insights and Forecast, 2020-2032
- 11.1. Market Analysis, Insights and Forecast - by Type
- 11.1.1. Polyurethane
- 11.1.1.1. Polyester
- 11.1.1.2. Polyether
- 11.1.2. Polyethylene
- 11.1.2.1. Cross linked
- 11.1.2.2. Non-cross linked
- 11.1.3. Polypropylene
- 11.1.1. Polyurethane
- 11.2. Market Analysis, Insights and Forecast - by Application
- 11.2.1. Construction
- 11.2.2. Consumer Goods
- 11.2.3. Furniture
- 11.2.4. Transportation
- 11.2.5. Other Applications
- 11.1. Market Analysis, Insights and Forecast - by Type
- 12. Competitive Analysis
- 12.1. Company Profiles
- 12.1.1 Carpenter Co
- 12.1.1.1. Company Overview
- 12.1.1.2. Products
- 12.1.1.3. Company Financials
- 12.1.1.4. SWOT Analysis
- 12.1.2 ORSA foam SpA
- 12.1.2.1. Company Overview
- 12.1.2.2. Products
- 12.1.2.3. Company Financials
- 12.1.2.4. SWOT Analysis
- 12.1.3 Wm T Burnett & Co
- 12.1.3.1. Company Overview
- 12.1.3.2. Products
- 12.1.3.3. Company Financials
- 12.1.3.4. SWOT Analysis
- 12.1.4 Recticel NV/SA
- 12.1.4.1. Company Overview
- 12.1.4.2. Products
- 12.1.4.3. Company Financials
- 12.1.4.4. SWOT Analysis
- 12.1.5 KANEKA CORPORATION
- 12.1.5.1. Company Overview
- 12.1.5.2. Products
- 12.1.5.3. Company Financials
- 12.1.5.4. SWOT Analysis
- 12.1.6 Rogers Corporation
- 12.1.6.1. Company Overview
- 12.1.6.2. Products
- 12.1.6.3. Company Financials
- 12.1.6.4. SWOT Analysis
- 12.1.7 BASF SE
- 12.1.7.1. Company Overview
- 12.1.7.2. Products
- 12.1.7.3. Company Financials
- 12.1.7.4. SWOT Analysis
- 12.1.8 Huntsman International LLC
- 12.1.8.1. Company Overview
- 12.1.8.2. Products
- 12.1.8.3. Company Financials
- 12.1.8.4. SWOT Analysis
- 12.1.9 Dow
- 12.1.9.1. Company Overview
- 12.1.9.2. Products
- 12.1.9.3. Company Financials
- 12.1.9.4. SWOT Analysis
- 12.1.10 Inoac Corporation
- 12.1.10.1. Company Overview
- 12.1.10.2. Products
- 12.1.10.3. Company Financials
- 12.1.10.4. SWOT Analysis
- 12.1.11 Woodbridge
- 12.1.11.1. Company Overview
- 12.1.11.2. Products
- 12.1.11.3. Company Financials
- 12.1.11.4. SWOT Analysis
- 12.1.12 Greiner AG
- 12.1.12.1. Company Overview
- 12.1.12.2. Products
- 12.1.12.3. Company Financials
- 12.1.12.4. SWOT Analysis
- 12.1.13 SEKISUI CHEMICAL CO LTD
- 12.1.13.1. Company Overview
- 12.1.13.2. Products
- 12.1.13.3. Company Financials
- 12.1.13.4. SWOT Analysis
- 12.1.14 Sheela Foam Ltd
- 12.1.14.1. Company Overview
- 12.1.14.2. Products
- 12.1.14.3. Company Financials
- 12.1.14.4. SWOT Analysis
- 12.1.15 American Excelsior Company
- 12.1.15.1. Company Overview
- 12.1.15.2. Products
- 12.1.15.3. Company Financials
- 12.1.15.4. SWOT Analysis
- 12.1.16 Covestro AG
- 12.1.16.1. Company Overview
- 12.1.16.2. Products
- 12.1.16.3. Company Financials
- 12.1.16.4. SWOT Analysis
- 12.1.17 Changzhou Xingang Plastic Products Co Ltd
- 12.1.17.1. Company Overview
- 12.1.17.2. Products
- 12.1.17.3. Company Financials
- 12.1.17.4. SWOT Analysis
- 12.1.1 Carpenter Co
- 12.2. Market Entropy
- 12.2.1 Company's Key Areas Served
- 12.2.2 Recent Developments
- 12.3. Company Market Share Analysis 2025
- 12.3.1 Top 5 Companies Market Share Analysis
- 12.3.2 Top 3 Companies Market Share Analysis
- 12.4. List of Potential Customers
- 13. Research Methodology
List of Figures
- Figure 1: Global Flexible Foam Industry Revenue Breakdown (billion, %) by Region 2025 & 2033
- Figure 2: Global Flexible Foam Industry Volume Breakdown (K Tons, %) by Region 2025 & 2033
- Figure 3: Asia Pacific Flexible Foam Industry Revenue (billion), by Type 2025 & 2033
- Figure 4: Asia Pacific Flexible Foam Industry Volume (K Tons), by Type 2025 & 2033
- Figure 5: Asia Pacific Flexible Foam Industry Revenue Share (%), by Type 2025 & 2033
- Figure 6: Asia Pacific Flexible Foam Industry Volume Share (%), by Type 2025 & 2033
- Figure 7: Asia Pacific Flexible Foam Industry Revenue (billion), by Application 2025 & 2033
- Figure 8: Asia Pacific Flexible Foam Industry Volume (K Tons), by Application 2025 & 2033
- Figure 9: Asia Pacific Flexible Foam Industry Revenue Share (%), by Application 2025 & 2033
- Figure 10: Asia Pacific Flexible Foam Industry Volume Share (%), by Application 2025 & 2033
- Figure 11: Asia Pacific Flexible Foam Industry Revenue (billion), by Country 2025 & 2033
- Figure 12: Asia Pacific Flexible Foam Industry Volume (K Tons), by Country 2025 & 2033
- Figure 13: Asia Pacific Flexible Foam Industry Revenue Share (%), by Country 2025 & 2033
- Figure 14: Asia Pacific Flexible Foam Industry Volume Share (%), by Country 2025 & 2033
- Figure 15: North America Flexible Foam Industry Revenue (billion), by Type 2025 & 2033
- Figure 16: North America Flexible Foam Industry Volume (K Tons), by Type 2025 & 2033
- Figure 17: North America Flexible Foam Industry Revenue Share (%), by Type 2025 & 2033
- Figure 18: North America Flexible Foam Industry Volume Share (%), by Type 2025 & 2033
- Figure 19: North America Flexible Foam Industry Revenue (billion), by Application 2025 & 2033
- Figure 20: North America Flexible Foam Industry Volume (K Tons), by Application 2025 & 2033
- Figure 21: North America Flexible Foam Industry Revenue Share (%), by Application 2025 & 2033
- Figure 22: North America Flexible Foam Industry Volume Share (%), by Application 2025 & 2033
- Figure 23: North America Flexible Foam Industry Revenue (billion), by Country 2025 & 2033
- Figure 24: North America Flexible Foam Industry Volume (K Tons), by Country 2025 & 2033
- Figure 25: North America Flexible Foam Industry Revenue Share (%), by Country 2025 & 2033
- Figure 26: North America Flexible Foam Industry Volume Share (%), by Country 2025 & 2033
- Figure 27: Europe Flexible Foam Industry Revenue (billion), by Type 2025 & 2033
- Figure 28: Europe Flexible Foam Industry Volume (K Tons), by Type 2025 & 2033
- Figure 29: Europe Flexible Foam Industry Revenue Share (%), by Type 2025 & 2033
- Figure 30: Europe Flexible Foam Industry Volume Share (%), by Type 2025 & 2033
- Figure 31: Europe Flexible Foam Industry Revenue (billion), by Application 2025 & 2033
- Figure 32: Europe Flexible Foam Industry Volume (K Tons), by Application 2025 & 2033
- Figure 33: Europe Flexible Foam Industry Revenue Share (%), by Application 2025 & 2033
- Figure 34: Europe Flexible Foam Industry Volume Share (%), by Application 2025 & 2033
- Figure 35: Europe Flexible Foam Industry Revenue (billion), by Country 2025 & 2033
- Figure 36: Europe Flexible Foam Industry Volume (K Tons), by Country 2025 & 2033
- Figure 37: Europe Flexible Foam Industry Revenue Share (%), by Country 2025 & 2033
- Figure 38: Europe Flexible Foam Industry Volume Share (%), by Country 2025 & 2033
- Figure 39: South America Flexible Foam Industry Revenue (billion), by Type 2025 & 2033
- Figure 40: South America Flexible Foam Industry Volume (K Tons), by Type 2025 & 2033
- Figure 41: South America Flexible Foam Industry Revenue Share (%), by Type 2025 & 2033
- Figure 42: South America Flexible Foam Industry Volume Share (%), by Type 2025 & 2033
- Figure 43: South America Flexible Foam Industry Revenue (billion), by Application 2025 & 2033
- Figure 44: South America Flexible Foam Industry Volume (K Tons), by Application 2025 & 2033
- Figure 45: South America Flexible Foam Industry Revenue Share (%), by Application 2025 & 2033
- Figure 46: South America Flexible Foam Industry Volume Share (%), by Application 2025 & 2033
- Figure 47: South America Flexible Foam Industry Revenue (billion), by Country 2025 & 2033
- Figure 48: South America Flexible Foam Industry Volume (K Tons), by Country 2025 & 2033
- Figure 49: South America Flexible Foam Industry Revenue Share (%), by Country 2025 & 2033
- Figure 50: South America Flexible Foam Industry Volume Share (%), by Country 2025 & 2033
- Figure 51: Middle East and Africa Flexible Foam Industry Revenue (billion), by Type 2025 & 2033
- Figure 52: Middle East and Africa Flexible Foam Industry Volume (K Tons), by Type 2025 & 2033
- Figure 53: Middle East and Africa Flexible Foam Industry Revenue Share (%), by Type 2025 & 2033
- Figure 54: Middle East and Africa Flexible Foam Industry Volume Share (%), by Type 2025 & 2033
- Figure 55: Middle East and Africa Flexible Foam Industry Revenue (billion), by Application 2025 & 2033
- Figure 56: Middle East and Africa Flexible Foam Industry Volume (K Tons), by Application 2025 & 2033
- Figure 57: Middle East and Africa Flexible Foam Industry Revenue Share (%), by Application 2025 & 2033
- Figure 58: Middle East and Africa Flexible Foam Industry Volume Share (%), by Application 2025 & 2033
- Figure 59: Middle East and Africa Flexible Foam Industry Revenue (billion), by Country 2025 & 2033
- Figure 60: Middle East and Africa Flexible Foam Industry Volume (K Tons), by Country 2025 & 2033
- Figure 61: Middle East and Africa Flexible Foam Industry Revenue Share (%), by Country 2025 & 2033
- Figure 62: Middle East and Africa Flexible Foam Industry Volume Share (%), by Country 2025 & 2033
List of Tables
- Table 1: Global Flexible Foam Industry Revenue billion Forecast, by Type 2020 & 2033
- Table 2: Global Flexible Foam Industry Volume K Tons Forecast, by Type 2020 & 2033
- Table 3: Global Flexible Foam Industry Revenue billion Forecast, by Application 2020 & 2033
- Table 4: Global Flexible Foam Industry Volume K Tons Forecast, by Application 2020 & 2033
- Table 5: Global Flexible Foam Industry Revenue billion Forecast, by Region 2020 & 2033
- Table 6: Global Flexible Foam Industry Volume K Tons Forecast, by Region 2020 & 2033
- Table 7: Global Flexible Foam Industry Revenue billion Forecast, by Type 2020 & 2033
- Table 8: Global Flexible Foam Industry Volume K Tons Forecast, by Type 2020 & 2033
- Table 9: Global Flexible Foam Industry Revenue billion Forecast, by Application 2020 & 2033
- Table 10: Global Flexible Foam Industry Volume K Tons Forecast, by Application 2020 & 2033
- Table 11: Global Flexible Foam Industry Revenue billion Forecast, by Country 2020 & 2033
- Table 12: Global Flexible Foam Industry Volume K Tons Forecast, by Country 2020 & 2033
- Table 13: China Flexible Foam Industry Revenue (billion) Forecast, by Application 2020 & 2033
- Table 14: China Flexible Foam Industry Volume (K Tons) Forecast, by Application 2020 & 2033
- Table 15: India Flexible Foam Industry Revenue (billion) Forecast, by Application 2020 & 2033
- Table 16: India Flexible Foam Industry Volume (K Tons) Forecast, by Application 2020 & 2033
- Table 17: Japan Flexible Foam Industry Revenue (billion) Forecast, by Application 2020 & 2033
- Table 18: Japan Flexible Foam Industry Volume (K Tons) Forecast, by Application 2020 & 2033
- Table 19: South Korea Flexible Foam Industry Revenue (billion) Forecast, by Application 2020 & 2033
- Table 20: South Korea Flexible Foam Industry Volume (K Tons) Forecast, by Application 2020 & 2033
- Table 21: Rest of Asia Pacific Flexible Foam Industry Revenue (billion) Forecast, by Application 2020 & 2033
- Table 22: Rest of Asia Pacific Flexible Foam Industry Volume (K Tons) Forecast, by Application 2020 & 2033
- Table 23: Global Flexible Foam Industry Revenue billion Forecast, by Type 2020 & 2033
- Table 24: Global Flexible Foam Industry Volume K Tons Forecast, by Type 2020 & 2033
- Table 25: Global Flexible Foam Industry Revenue billion Forecast, by Application 2020 & 2033
- Table 26: Global Flexible Foam Industry Volume K Tons Forecast, by Application 2020 & 2033
- Table 27: Global Flexible Foam Industry Revenue billion Forecast, by Country 2020 & 2033
- Table 28: Global Flexible Foam Industry Volume K Tons Forecast, by Country 2020 & 2033
- Table 29: United States Flexible Foam Industry Revenue (billion) Forecast, by Application 2020 & 2033
- Table 30: United States Flexible Foam Industry Volume (K Tons) Forecast, by Application 2020 & 2033
- Table 31: Canada Flexible Foam Industry Revenue (billion) Forecast, by Application 2020 & 2033
- Table 32: Canada Flexible Foam Industry Volume (K Tons) Forecast, by Application 2020 & 2033
- Table 33: Mexico Flexible Foam Industry Revenue (billion) Forecast, by Application 2020 & 2033
- Table 34: Mexico Flexible Foam Industry Volume (K Tons) Forecast, by Application 2020 & 2033
- Table 35: Global Flexible Foam Industry Revenue billion Forecast, by Type 2020 & 2033
- Table 36: Global Flexible Foam Industry Volume K Tons Forecast, by Type 2020 & 2033
- Table 37: Global Flexible Foam Industry Revenue billion Forecast, by Application 2020 & 2033
- Table 38: Global Flexible Foam Industry Volume K Tons Forecast, by Application 2020 & 2033
- Table 39: Global Flexible Foam Industry Revenue billion Forecast, by Country 2020 & 2033
- Table 40: Global Flexible Foam Industry Volume K Tons Forecast, by Country 2020 & 2033
- Table 41: Germany Flexible Foam Industry Revenue (billion) Forecast, by Application 2020 & 2033
- Table 42: Germany Flexible Foam Industry Volume (K Tons) Forecast, by Application 2020 & 2033
- Table 43: United Kingdom Flexible Foam Industry Revenue (billion) Forecast, by Application 2020 & 2033
- Table 44: United Kingdom Flexible Foam Industry Volume (K Tons) Forecast, by Application 2020 & 2033
- Table 45: Italy Flexible Foam Industry Revenue (billion) Forecast, by Application 2020 & 2033
- Table 46: Italy Flexible Foam Industry Volume (K Tons) Forecast, by Application 2020 & 2033
- Table 47: France Flexible Foam Industry Revenue (billion) Forecast, by Application 2020 & 2033
- Table 48: France Flexible Foam Industry Volume (K Tons) Forecast, by Application 2020 & 2033
- Table 49: Rest of Europe Flexible Foam Industry Revenue (billion) Forecast, by Application 2020 & 2033
- Table 50: Rest of Europe Flexible Foam Industry Volume (K Tons) Forecast, by Application 2020 & 2033
- Table 51: Global Flexible Foam Industry Revenue billion Forecast, by Type 2020 & 2033
- Table 52: Global Flexible Foam Industry Volume K Tons Forecast, by Type 2020 & 2033
- Table 53: Global Flexible Foam Industry Revenue billion Forecast, by Application 2020 & 2033
- Table 54: Global Flexible Foam Industry Volume K Tons Forecast, by Application 2020 & 2033
- Table 55: Global Flexible Foam Industry Revenue billion Forecast, by Country 2020 & 2033
- Table 56: Global Flexible Foam Industry Volume K Tons Forecast, by Country 2020 & 2033
- Table 57: Brazil Flexible Foam Industry Revenue (billion) Forecast, by Application 2020 & 2033
- Table 58: Brazil Flexible Foam Industry Volume (K Tons) Forecast, by Application 2020 & 2033
- Table 59: Argentina Flexible Foam Industry Revenue (billion) Forecast, by Application 2020 & 2033
- Table 60: Argentina Flexible Foam Industry Volume (K Tons) Forecast, by Application 2020 & 2033
- Table 61: Rest of South America Flexible Foam Industry Revenue (billion) Forecast, by Application 2020 & 2033
- Table 62: Rest of South America Flexible Foam Industry Volume (K Tons) Forecast, by Application 2020 & 2033
- Table 63: Global Flexible Foam Industry Revenue billion Forecast, by Type 2020 & 2033
- Table 64: Global Flexible Foam Industry Volume K Tons Forecast, by Type 2020 & 2033
- Table 65: Global Flexible Foam Industry Revenue billion Forecast, by Application 2020 & 2033
- Table 66: Global Flexible Foam Industry Volume K Tons Forecast, by Application 2020 & 2033
- Table 67: Global Flexible Foam Industry Revenue billion Forecast, by Country 2020 & 2033
- Table 68: Global Flexible Foam Industry Volume K Tons Forecast, by Country 2020 & 2033
- Table 69: Saudi Arabia Flexible Foam Industry Revenue (billion) Forecast, by Application 2020 & 2033
- Table 70: Saudi Arabia Flexible Foam Industry Volume (K Tons) Forecast, by Application 2020 & 2033
- Table 71: South Africa Flexible Foam Industry Revenue (billion) Forecast, by Application 2020 & 2033
- Table 72: South Africa Flexible Foam Industry Volume (K Tons) Forecast, by Application 2020 & 2033
- Table 73: Rest of Middle East and Africa Flexible Foam Industry Revenue (billion) Forecast, by Application 2020 & 2033
- Table 74: Rest of Middle East and Africa Flexible Foam Industry Volume (K Tons) Forecast, by Application 2020 & 2033
Frequently Asked Questions
1. What is the projected Compound Annual Growth Rate (CAGR) of the Flexible Foam Industry?
The projected CAGR is approximately 7.14%.
2. Which companies are prominent players in the Flexible Foam Industry?
Key companies in the market include Carpenter Co, ORSA foam SpA, Wm T Burnett & Co, Recticel NV/SA, KANEKA CORPORATION, Rogers Corporation, BASF SE, Huntsman International LLC, Dow, Inoac Corporation, Woodbridge, Greiner AG, SEKISUI CHEMICAL CO LTD, Sheela Foam Ltd, American Excelsior Company, Covestro AG, Changzhou Xingang Plastic Products Co Ltd.
3. What are the main segments of the Flexible Foam Industry?
The market segments include Type, Application.
4. Can you provide details about the market size?
The market size is estimated to be USD 52.19 billion as of 2022.
5. What are some drivers contributing to market growth?
Growing Demand of Flexible Foam in Packaging; Increasing Demand for Flexible Foam in Carpet Cushion; Other Drivers.
6. What are the notable trends driving market growth?
Growing Demand for Flexible Foam in Furniture Industry.
7. Are there any restraints impacting market growth?
Environmental Degradation while Fabrication; Other Restraints.
8. Can you provide examples of recent developments in the market?
July 2022: William T. Burnett & Co. acquired Flex Foam, the first polyurethane foam manufacturer in Arizona, which will help them in growing Flex Foam's existing business and also in expanding their own ability to produce specialty urethane foams in Phoenix that would meet exacting technical specifications for use in a wide range of industries.
9. What pricing options are available for accessing the report?
Pricing options include single-user, multi-user, and enterprise licenses priced at USD 4750, USD 5250, and USD 8750 respectively.
10. Is the market size provided in terms of value or volume?
The market size is provided in terms of value, measured in billion and volume, measured in K Tons.
11. Are there any specific market keywords associated with the report?
Yes, the market keyword associated with the report is "Flexible Foam Industry," which aids in identifying and referencing the specific market segment covered.
12. How do I determine which pricing option suits my needs best?
The pricing options vary based on user requirements and access needs. Individual users may opt for single-user licenses, while businesses requiring broader access may choose multi-user or enterprise licenses for cost-effective access to the report.
13. Are there any additional resources or data provided in the Flexible Foam Industry report?
While the report offers comprehensive insights, it's advisable to review the specific contents or supplementary materials provided to ascertain if additional resources or data are available.
14. How can I stay updated on further developments or reports in the Flexible Foam Industry?
To stay informed about further developments, trends, and reports in the Flexible Foam Industry, consider subscribing to industry newsletters, following relevant companies and organizations, or regularly checking reputable industry news sources and publications.
Methodology
Step 1 - Identification of Relevant Samples Size from Population Database


Step 2 - Approaches for Defining Global Market Size (Value, Volume* & Price*)

Note*: In applicable scenarios
Step 3 - Data Sources
Primary Research
- Web Analytics
- Survey Reports
- Research Institute
- Latest Research Reports
- Opinion Leaders
Secondary Research
- Annual Reports
- White Paper
- Latest Press Release
- Industry Association
- Paid Database
- Investor Presentations

Step 4 - Data Triangulation
Involves using different sources of information in order to increase the validity of a study
These sources are likely to be stakeholders in a program - participants, other researchers, program staff, other community members, and so on.
Then we put all data in single framework & apply various statistical tools to find out the dynamic on the market.
During the analysis stage, feedback from the stakeholder groups would be compared to determine areas of agreement as well as areas of divergence