Key Insights
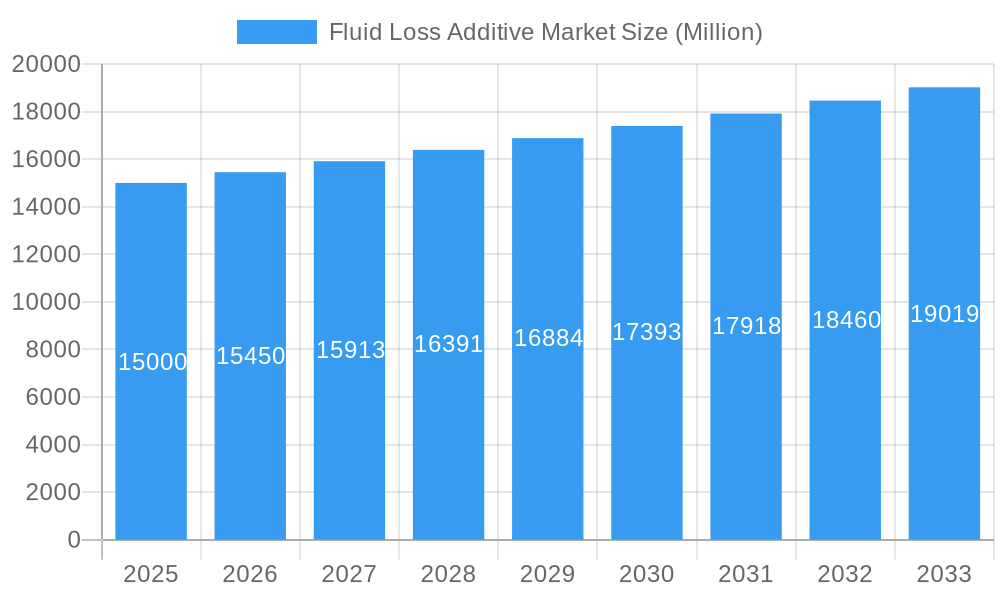
The global fluid loss additive market is experiencing significant expansion, propelled by the escalating demand for effective drilling and well completion solutions across the oil & gas and renewable energy sectors. With a projected Compound Annual Growth Rate (CAGR) of 6.23%, the market is poised for sustained growth through 2033. This upward trajectory is attributed to increased global exploration and production activities, coupled with a growing preference for eco-friendly additives, particularly those derived from natural sources and synthetically modified natural variants. While drilling fluids remain the primary application, a notable trend is the increasing use of fluid loss additives in cement slurries to bolster well integrity. Key industry leaders, including Clariant, Nouryon, Solvay, and Halliburton, are actively engaged in research and development, shaping product innovation and the competitive landscape. The Asia-Pacific region, especially China and India, presents substantial growth opportunities owing to extensive infrastructure development and ongoing energy projects. North America and Europe also contribute significantly through established oil and gas operations and investments in renewable energy. However, volatile oil prices and stringent environmental regulations necessitate a focus on sustainable and cost-efficient solutions.
Fluid Loss Additive Market Market Size (In Million)
Market segmentation by additive type (synthetic, natural, synthetically modified natural) and application (drilling fluid, cement slurry) reveals evolving consumer preferences and industry trends. The synthetic segment currently leads in market share due to superior performance, while natural and synthetically modified natural segments exhibit faster growth, driven by environmental consciousness and regulatory mandates. The global emphasis on sustainable practices is accelerating the adoption of natural and bio-based additives, further enhancing wellbore stability and minimizing environmental impact during drilling. The competitive environment features a mix of multinational corporations and specialized firms, offering avenues for both established players and emerging innovators. Future market dynamics will be influenced by technological advancements, regulatory shifts, and fluctuations in global energy demand.
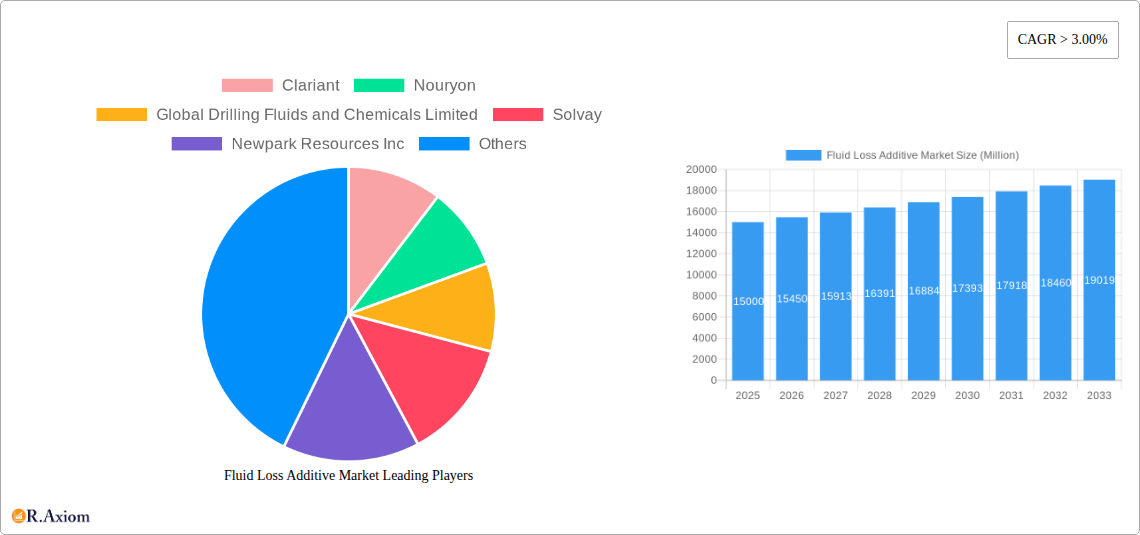
Fluid Loss Additive Market Company Market Share
Global Fluid Loss Additive Market Analysis: Size, Share, and Trends (2019-2033)
This comprehensive report delivers an in-depth analysis of the global Fluid Loss Additive market, providing critical insights for stakeholders, investors, and decision-makers. Covering the period from 2019 to 2033, with a base year of 2025, the report offers a detailed forecast from 2025 to 2033. Market segmentation by additive type (Synthetic, Natural, Synthetically Modified Natural) and application (Drilling Fluid, Cement Slurry) provides a granular view of market dynamics and growth potential. Key industry players profiled include Clariant, Nouryon, Global Drilling Fluids and Chemicals Limited, Solvay, Newpark Resources Inc, Kemira OYJ, BASF SE, Tytan Organics Pvt Ltd, Halliburton, and Schlumberger Limited, with their respective market strategies and competitive positioning detailed. The market size was valued at 383.25 million in the base year of 2025.
Fluid Loss Additive Market Concentration & Innovation
The Fluid Loss Additive market exhibits a moderately concentrated structure, with the top five players holding an estimated xx% market share in 2025. Innovation is a key driver, with companies continuously developing new additives to improve performance, reduce environmental impact, and meet evolving industry regulations. Regulatory frameworks, particularly concerning environmental protection and worker safety, significantly influence market dynamics. The market also witnesses substantial M&A activity, with deal values exceeding xx Million in the last five years, driven by the need for technological advancements and market expansion. Product substitutes, such as alternative drilling fluids, present a challenge but also create opportunities for innovation. End-user trends, including increased demand for environmentally friendly solutions and higher efficiency drilling techniques, are shaping product development and market growth.
- Market Concentration: Top 5 players hold approximately xx% market share (2025).
- M&A Activity: Deal values exceeding xx Million in the last 5 years.
- Innovation Drivers: Improved performance, reduced environmental impact, meeting stricter regulations.
- Regulatory Framework: Stringent environmental and safety regulations influence product development.
- End-User Trends: Demand for eco-friendly solutions and high-efficiency drilling techniques.
Fluid Loss Additive Market Industry Trends & Insights
The global Fluid Loss Additive market is projected to experience a CAGR of xx% during the forecast period (2025-2033), driven by several factors. The increasing demand for oil and gas exploration and production activities globally is a major catalyst. Technological advancements, including the development of high-performance additives with enhanced properties, contribute significantly to market growth. Consumer preferences are shifting towards environmentally sustainable solutions, resulting in a growing demand for biodegradable and less-toxic additives. The competitive landscape is characterized by intense competition among major players, driving innovation and price optimization. Market penetration in emerging economies is also expected to increase significantly, fueled by rising infrastructure development and energy demands. Furthermore, the development of new applications, beyond the traditional oil and gas sector, offers significant growth opportunities.
Dominant Markets & Segments in Fluid Loss Additive Market
The North American region dominated the Fluid Loss Additive market in 2025, accounting for approximately xx% of the global market share. This dominance is attributed to the significant presence of major oil and gas exploration and production companies, coupled with robust infrastructure and supportive government policies. Within the additive types, the Synthetic segment holds the largest market share, driven by its superior performance characteristics. In terms of application, the Drilling Fluid segment dominates, reflecting the widespread use of fluid loss additives in drilling operations.
- North America (Dominant Region):
- Strong presence of oil and gas companies.
- Well-developed infrastructure.
- Supportive government policies.
- Synthetic Additives (Dominant Additive Type):
- Superior performance and efficiency.
- Wider application range.
- Drilling Fluid (Dominant Application):
- Essential component of drilling operations.
- High volume consumption.
Fluid Loss Additive Market Product Developments
Recent product developments in the fluid loss additive market focus on enhancing performance, reducing environmental impact, and improving cost-effectiveness. Innovations include the development of biodegradable and bio-based additives, as well as additives with enhanced rheological properties for improved drilling efficiency. These advancements provide competitive advantages by offering superior performance, reduced environmental footprint, and better cost efficiency, aligning with the growing demand for sustainable solutions in the industry.
Report Scope & Segmentation Analysis
This report segments the Fluid Loss Additive market by additive type (Synthetic, Natural, Synthetically Modified Natural) and application (Drilling Fluid, Cement Slurry). Each segment is analyzed in detail, providing market size, growth projections, and competitive dynamics. The Synthetic segment is expected to experience significant growth, driven by its superior performance and wider application range. The Natural segment offers sustainable options, while the Synthetically Modified Natural segment presents a balance between performance and eco-friendliness. The Drilling Fluid application segment dominates due to its wide use in oil and gas exploration, while the Cement Slurry segment offers moderate growth potential.
Key Drivers of Fluid Loss Additive Market Growth
The Fluid Loss Additive market is driven by several factors, including the rising demand for oil and gas, increasing exploration activities in offshore and unconventional resources, stringent environmental regulations promoting the use of eco-friendly additives, and technological advancements leading to the development of high-performance products. Economic growth in emerging economies further fuels the demand for energy, driving market expansion.
Challenges in the Fluid Loss Additive Market Sector
Challenges include fluctuating crude oil prices impacting investment in exploration and production, stringent regulatory compliance requirements adding to operational costs, and intense competition leading to price pressures. Supply chain disruptions due to geopolitical events can also impact market stability. The development of alternative drilling fluids presents a competitive threat.
Emerging Opportunities in Fluid Loss Additive Market
Emerging opportunities lie in the development of biodegradable and sustainable additives, expansion into new applications such as geothermal and hydraulic fracturing, and the use of advanced technologies such as nanotechnology for enhanced performance and reduced environmental impact. The exploration of new oil and gas resources in emerging markets presents significant growth potential.
Leading Players in the Fluid Loss Additive Market Market
- Clariant
- Nouryon
- Global Drilling Fluids and Chemicals Limited
- Solvay
- Newpark Resources Inc
- Kemira OYJ
- BASF SE
- Tytan Organics Pvt Ltd
- Halliburton
- Schlumberger Limited
Key Developments in Fluid Loss Additive Market Industry
- January 2023: Clariant launched a new generation of environmentally friendly fluid loss additives.
- June 2022: Nouryon acquired a smaller competitor, expanding its market share.
- October 2021: BASF announced a new strategic partnership for the development of bio-based additives.
- (Further developments to be added based on actual data)
Strategic Outlook for Fluid Loss Additive Market Market
The Fluid Loss Additive market is poised for significant growth in the coming years, driven by continuous innovation, increasing demand for oil and gas, and the growing adoption of sustainable solutions. Opportunities exist in expanding into new applications, leveraging technological advancements, and catering to the rising demand in emerging markets. Companies focusing on developing high-performance, environmentally friendly additives are expected to gain a competitive advantage in the long term.
Fluid Loss Additive Market Segmentation
-
1. Additive Type
- 1.1. Synthetic
- 1.2. Natural
- 1.3. Synthetically Modified Natural
-
2. Application
- 2.1. Drilling Fluid
- 2.2. Cement Slurry
Fluid Loss Additive Market Segmentation By Geography
-
1. Asia Pacific
- 1.1. China
- 1.2. India
- 1.3. Japan
- 1.4. South Korea
- 1.5. Rest of Asia Pacific
-
2. North America
- 2.1. United States
- 2.2. Canada
- 2.3. Mexico
-
3. Europe
- 3.1. Germany
- 3.2. United Kingdom
- 3.3. France
- 3.4. Italy
- 3.5. Rest of Europe
-
4. South America
- 4.1. Brazil
- 4.2. Argentina
- 4.3. Rest of South America
-
5. Middle East and Africa
- 5.1. Saudi Arabia
- 5.2. South Africa
- 5.3. Rest of Middle East and Africa
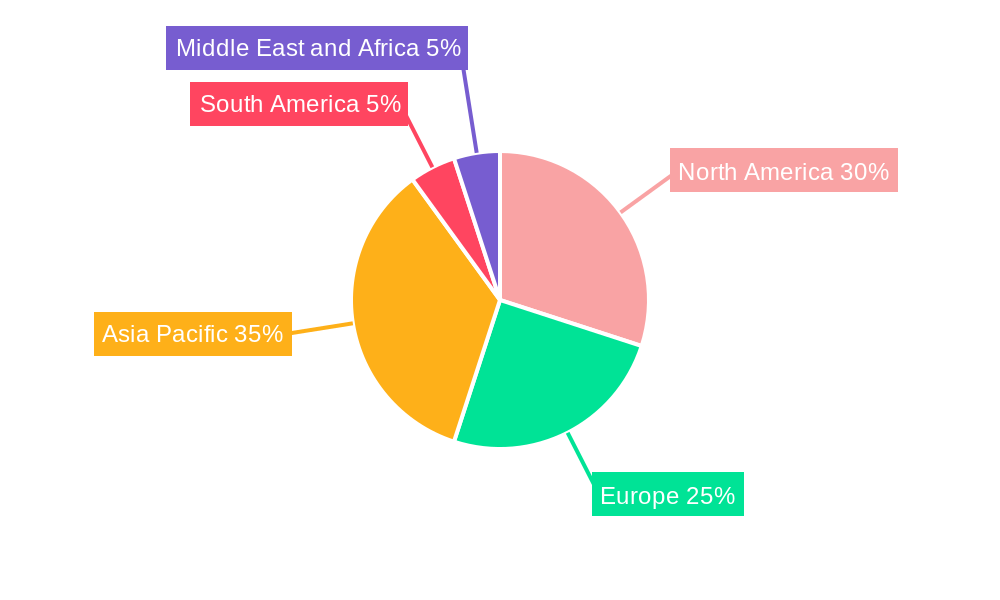
Fluid Loss Additive Market Regional Market Share
Geographic Coverage of Fluid Loss Additive Market
Fluid Loss Additive Market REPORT HIGHLIGHTS
| Aspects | Details |
|---|---|
| Study Period | 2020-2034 |
| Base Year | 2025 |
| Estimated Year | 2026 |
| Forecast Period | 2026-2034 |
| Historical Period | 2020-2025 |
| Growth Rate | CAGR of 6.23% from 2020-2034 |
| Segmentation |
|
Table of Contents
- 1. Introduction
- 1.1. Research Scope
- 1.2. Market Segmentation
- 1.3. Research Objective
- 1.4. Definitions and Assumptions
- 2. Executive Summary
- 2.1. Market Snapshot
- 3. Market Dynamics
- 3.1. Market Drivers
- 3.2. Market Restrains
- 3.3. Market Trends
- 3.4. Market Opportunities
- 4. Market Factor Analysis
- 4.1. Porters Five Forces
- 4.1.1. Bargaining Power of Suppliers
- 4.1.2. Bargaining Power of Buyers
- 4.1.3. Threat of New Entrants
- 4.1.4. Threat of Substitutes
- 4.1.5. Competitive Rivalry
- 4.2. PESTEL analysis
- 4.3. BCG Analysis
- 4.3.1. Stars (High Growth, High Market Share)
- 4.3.2. Cash Cows (Low Growth, High Market Share)
- 4.3.3. Question Mark (High Growth, Low Market Share)
- 4.3.4. Dogs (Low Growth, Low Market Share)
- 4.4. Ansoff Matrix Analysis
- 4.5. Supply Chain Analysis
- 4.6. Regulatory Landscape
- 4.7. Current Market Potential and Opportunity Assessment (TAM–SAM–SOM Framework)
- 4.8. RAX Analyst Note
- 4.1. Porters Five Forces
- 5. Market Analysis, Insights and Forecast 2021-2033
- 5.1. Market Analysis, Insights and Forecast - by Additive Type
- 5.1.1. Synthetic
- 5.1.2. Natural
- 5.1.3. Synthetically Modified Natural
- 5.2. Market Analysis, Insights and Forecast - by Application
- 5.2.1. Drilling Fluid
- 5.2.2. Cement Slurry
- 5.3. Market Analysis, Insights and Forecast - by Region
- 5.3.1. Asia Pacific
- 5.3.2. North America
- 5.3.3. Europe
- 5.3.4. South America
- 5.3.5. Middle East and Africa
- 5.1. Market Analysis, Insights and Forecast - by Additive Type
- 6. Global Fluid Loss Additive Market Analysis, Insights and Forecast, 2021-2033
- 6.1. Market Analysis, Insights and Forecast - by Additive Type
- 6.1.1. Synthetic
- 6.1.2. Natural
- 6.1.3. Synthetically Modified Natural
- 6.2. Market Analysis, Insights and Forecast - by Application
- 6.2.1. Drilling Fluid
- 6.2.2. Cement Slurry
- 6.1. Market Analysis, Insights and Forecast - by Additive Type
- 7. Asia Pacific Fluid Loss Additive Market Analysis, Insights and Forecast, 2020-2032
- 7.1. Market Analysis, Insights and Forecast - by Additive Type
- 7.1.1. Synthetic
- 7.1.2. Natural
- 7.1.3. Synthetically Modified Natural
- 7.2. Market Analysis, Insights and Forecast - by Application
- 7.2.1. Drilling Fluid
- 7.2.2. Cement Slurry
- 7.1. Market Analysis, Insights and Forecast - by Additive Type
- 8. North America Fluid Loss Additive Market Analysis, Insights and Forecast, 2020-2032
- 8.1. Market Analysis, Insights and Forecast - by Additive Type
- 8.1.1. Synthetic
- 8.1.2. Natural
- 8.1.3. Synthetically Modified Natural
- 8.2. Market Analysis, Insights and Forecast - by Application
- 8.2.1. Drilling Fluid
- 8.2.2. Cement Slurry
- 8.1. Market Analysis, Insights and Forecast - by Additive Type
- 9. Europe Fluid Loss Additive Market Analysis, Insights and Forecast, 2020-2032
- 9.1. Market Analysis, Insights and Forecast - by Additive Type
- 9.1.1. Synthetic
- 9.1.2. Natural
- 9.1.3. Synthetically Modified Natural
- 9.2. Market Analysis, Insights and Forecast - by Application
- 9.2.1. Drilling Fluid
- 9.2.2. Cement Slurry
- 9.1. Market Analysis, Insights and Forecast - by Additive Type
- 10. South America Fluid Loss Additive Market Analysis, Insights and Forecast, 2020-2032
- 10.1. Market Analysis, Insights and Forecast - by Additive Type
- 10.1.1. Synthetic
- 10.1.2. Natural
- 10.1.3. Synthetically Modified Natural
- 10.2. Market Analysis, Insights and Forecast - by Application
- 10.2.1. Drilling Fluid
- 10.2.2. Cement Slurry
- 10.1. Market Analysis, Insights and Forecast - by Additive Type
- 11. Middle East and Africa Fluid Loss Additive Market Analysis, Insights and Forecast, 2020-2032
- 11.1. Market Analysis, Insights and Forecast - by Additive Type
- 11.1.1. Synthetic
- 11.1.2. Natural
- 11.1.3. Synthetically Modified Natural
- 11.2. Market Analysis, Insights and Forecast - by Application
- 11.2.1. Drilling Fluid
- 11.2.2. Cement Slurry
- 11.1. Market Analysis, Insights and Forecast - by Additive Type
- 12. Competitive Analysis
- 12.1. Company Profiles
- 12.1.1 Clariant
- 12.1.1.1. Company Overview
- 12.1.1.2. Products
- 12.1.1.3. Company Financials
- 12.1.1.4. SWOT Analysis
- 12.1.2 Nouryon
- 12.1.2.1. Company Overview
- 12.1.2.2. Products
- 12.1.2.3. Company Financials
- 12.1.2.4. SWOT Analysis
- 12.1.3 Global Drilling Fluids and Chemicals Limited
- 12.1.3.1. Company Overview
- 12.1.3.2. Products
- 12.1.3.3. Company Financials
- 12.1.3.4. SWOT Analysis
- 12.1.4 Solvay
- 12.1.4.1. Company Overview
- 12.1.4.2. Products
- 12.1.4.3. Company Financials
- 12.1.4.4. SWOT Analysis
- 12.1.5 Newpark Resources Inc
- 12.1.5.1. Company Overview
- 12.1.5.2. Products
- 12.1.5.3. Company Financials
- 12.1.5.4. SWOT Analysis
- 12.1.6 Kemira OYJ
- 12.1.6.1. Company Overview
- 12.1.6.2. Products
- 12.1.6.3. Company Financials
- 12.1.6.4. SWOT Analysis
- 12.1.7 BASF SE
- 12.1.7.1. Company Overview
- 12.1.7.2. Products
- 12.1.7.3. Company Financials
- 12.1.7.4. SWOT Analysis
- 12.1.8 Tytan Organics Pvt Ltd
- 12.1.8.1. Company Overview
- 12.1.8.2. Products
- 12.1.8.3. Company Financials
- 12.1.8.4. SWOT Analysis
- 12.1.9 Halliburton
- 12.1.9.1. Company Overview
- 12.1.9.2. Products
- 12.1.9.3. Company Financials
- 12.1.9.4. SWOT Analysis
- 12.1.10 Schlumberger Limited
- 12.1.10.1. Company Overview
- 12.1.10.2. Products
- 12.1.10.3. Company Financials
- 12.1.10.4. SWOT Analysis
- 12.1.1 Clariant
- 12.2. Market Entropy
- 12.2.1 Company's Key Areas Served
- 12.2.2 Recent Developments
- 12.3. Company Market Share Analysis 2025
- 12.3.1 Top 5 Companies Market Share Analysis
- 12.3.2 Top 3 Companies Market Share Analysis
- 12.4. List of Potential Customers
- 13. Research Methodology
List of Figures
- Figure 1: Global Fluid Loss Additive Market Revenue Breakdown (million, %) by Region 2025 & 2033
- Figure 2: Global Fluid Loss Additive Market Volume Breakdown (kg/m3, %) by Region 2025 & 2033
- Figure 3: Asia Pacific Fluid Loss Additive Market Revenue (million), by Additive Type 2025 & 2033
- Figure 4: Asia Pacific Fluid Loss Additive Market Volume (kg/m3), by Additive Type 2025 & 2033
- Figure 5: Asia Pacific Fluid Loss Additive Market Revenue Share (%), by Additive Type 2025 & 2033
- Figure 6: Asia Pacific Fluid Loss Additive Market Volume Share (%), by Additive Type 2025 & 2033
- Figure 7: Asia Pacific Fluid Loss Additive Market Revenue (million), by Application 2025 & 2033
- Figure 8: Asia Pacific Fluid Loss Additive Market Volume (kg/m3), by Application 2025 & 2033
- Figure 9: Asia Pacific Fluid Loss Additive Market Revenue Share (%), by Application 2025 & 2033
- Figure 10: Asia Pacific Fluid Loss Additive Market Volume Share (%), by Application 2025 & 2033
- Figure 11: Asia Pacific Fluid Loss Additive Market Revenue (million), by Country 2025 & 2033
- Figure 12: Asia Pacific Fluid Loss Additive Market Volume (kg/m3), by Country 2025 & 2033
- Figure 13: Asia Pacific Fluid Loss Additive Market Revenue Share (%), by Country 2025 & 2033
- Figure 14: Asia Pacific Fluid Loss Additive Market Volume Share (%), by Country 2025 & 2033
- Figure 15: North America Fluid Loss Additive Market Revenue (million), by Additive Type 2025 & 2033
- Figure 16: North America Fluid Loss Additive Market Volume (kg/m3), by Additive Type 2025 & 2033
- Figure 17: North America Fluid Loss Additive Market Revenue Share (%), by Additive Type 2025 & 2033
- Figure 18: North America Fluid Loss Additive Market Volume Share (%), by Additive Type 2025 & 2033
- Figure 19: North America Fluid Loss Additive Market Revenue (million), by Application 2025 & 2033
- Figure 20: North America Fluid Loss Additive Market Volume (kg/m3), by Application 2025 & 2033
- Figure 21: North America Fluid Loss Additive Market Revenue Share (%), by Application 2025 & 2033
- Figure 22: North America Fluid Loss Additive Market Volume Share (%), by Application 2025 & 2033
- Figure 23: North America Fluid Loss Additive Market Revenue (million), by Country 2025 & 2033
- Figure 24: North America Fluid Loss Additive Market Volume (kg/m3), by Country 2025 & 2033
- Figure 25: North America Fluid Loss Additive Market Revenue Share (%), by Country 2025 & 2033
- Figure 26: North America Fluid Loss Additive Market Volume Share (%), by Country 2025 & 2033
- Figure 27: Europe Fluid Loss Additive Market Revenue (million), by Additive Type 2025 & 2033
- Figure 28: Europe Fluid Loss Additive Market Volume (kg/m3), by Additive Type 2025 & 2033
- Figure 29: Europe Fluid Loss Additive Market Revenue Share (%), by Additive Type 2025 & 2033
- Figure 30: Europe Fluid Loss Additive Market Volume Share (%), by Additive Type 2025 & 2033
- Figure 31: Europe Fluid Loss Additive Market Revenue (million), by Application 2025 & 2033
- Figure 32: Europe Fluid Loss Additive Market Volume (kg/m3), by Application 2025 & 2033
- Figure 33: Europe Fluid Loss Additive Market Revenue Share (%), by Application 2025 & 2033
- Figure 34: Europe Fluid Loss Additive Market Volume Share (%), by Application 2025 & 2033
- Figure 35: Europe Fluid Loss Additive Market Revenue (million), by Country 2025 & 2033
- Figure 36: Europe Fluid Loss Additive Market Volume (kg/m3), by Country 2025 & 2033
- Figure 37: Europe Fluid Loss Additive Market Revenue Share (%), by Country 2025 & 2033
- Figure 38: Europe Fluid Loss Additive Market Volume Share (%), by Country 2025 & 2033
- Figure 39: South America Fluid Loss Additive Market Revenue (million), by Additive Type 2025 & 2033
- Figure 40: South America Fluid Loss Additive Market Volume (kg/m3), by Additive Type 2025 & 2033
- Figure 41: South America Fluid Loss Additive Market Revenue Share (%), by Additive Type 2025 & 2033
- Figure 42: South America Fluid Loss Additive Market Volume Share (%), by Additive Type 2025 & 2033
- Figure 43: South America Fluid Loss Additive Market Revenue (million), by Application 2025 & 2033
- Figure 44: South America Fluid Loss Additive Market Volume (kg/m3), by Application 2025 & 2033
- Figure 45: South America Fluid Loss Additive Market Revenue Share (%), by Application 2025 & 2033
- Figure 46: South America Fluid Loss Additive Market Volume Share (%), by Application 2025 & 2033
- Figure 47: South America Fluid Loss Additive Market Revenue (million), by Country 2025 & 2033
- Figure 48: South America Fluid Loss Additive Market Volume (kg/m3), by Country 2025 & 2033
- Figure 49: South America Fluid Loss Additive Market Revenue Share (%), by Country 2025 & 2033
- Figure 50: South America Fluid Loss Additive Market Volume Share (%), by Country 2025 & 2033
- Figure 51: Middle East and Africa Fluid Loss Additive Market Revenue (million), by Additive Type 2025 & 2033
- Figure 52: Middle East and Africa Fluid Loss Additive Market Volume (kg/m3), by Additive Type 2025 & 2033
- Figure 53: Middle East and Africa Fluid Loss Additive Market Revenue Share (%), by Additive Type 2025 & 2033
- Figure 54: Middle East and Africa Fluid Loss Additive Market Volume Share (%), by Additive Type 2025 & 2033
- Figure 55: Middle East and Africa Fluid Loss Additive Market Revenue (million), by Application 2025 & 2033
- Figure 56: Middle East and Africa Fluid Loss Additive Market Volume (kg/m3), by Application 2025 & 2033
- Figure 57: Middle East and Africa Fluid Loss Additive Market Revenue Share (%), by Application 2025 & 2033
- Figure 58: Middle East and Africa Fluid Loss Additive Market Volume Share (%), by Application 2025 & 2033
- Figure 59: Middle East and Africa Fluid Loss Additive Market Revenue (million), by Country 2025 & 2033
- Figure 60: Middle East and Africa Fluid Loss Additive Market Volume (kg/m3), by Country 2025 & 2033
- Figure 61: Middle East and Africa Fluid Loss Additive Market Revenue Share (%), by Country 2025 & 2033
- Figure 62: Middle East and Africa Fluid Loss Additive Market Volume Share (%), by Country 2025 & 2033
List of Tables
- Table 1: Global Fluid Loss Additive Market Revenue million Forecast, by Additive Type 2020 & 2033
- Table 2: Global Fluid Loss Additive Market Volume kg/m3 Forecast, by Additive Type 2020 & 2033
- Table 3: Global Fluid Loss Additive Market Revenue million Forecast, by Application 2020 & 2033
- Table 4: Global Fluid Loss Additive Market Volume kg/m3 Forecast, by Application 2020 & 2033
- Table 5: Global Fluid Loss Additive Market Revenue million Forecast, by Region 2020 & 2033
- Table 6: Global Fluid Loss Additive Market Volume kg/m3 Forecast, by Region 2020 & 2033
- Table 7: Global Fluid Loss Additive Market Revenue million Forecast, by Additive Type 2020 & 2033
- Table 8: Global Fluid Loss Additive Market Volume kg/m3 Forecast, by Additive Type 2020 & 2033
- Table 9: Global Fluid Loss Additive Market Revenue million Forecast, by Application 2020 & 2033
- Table 10: Global Fluid Loss Additive Market Volume kg/m3 Forecast, by Application 2020 & 2033
- Table 11: Global Fluid Loss Additive Market Revenue million Forecast, by Country 2020 & 2033
- Table 12: Global Fluid Loss Additive Market Volume kg/m3 Forecast, by Country 2020 & 2033
- Table 13: China Fluid Loss Additive Market Revenue (million) Forecast, by Application 2020 & 2033
- Table 14: China Fluid Loss Additive Market Volume (kg/m3) Forecast, by Application 2020 & 2033
- Table 15: India Fluid Loss Additive Market Revenue (million) Forecast, by Application 2020 & 2033
- Table 16: India Fluid Loss Additive Market Volume (kg/m3) Forecast, by Application 2020 & 2033
- Table 17: Japan Fluid Loss Additive Market Revenue (million) Forecast, by Application 2020 & 2033
- Table 18: Japan Fluid Loss Additive Market Volume (kg/m3) Forecast, by Application 2020 & 2033
- Table 19: South Korea Fluid Loss Additive Market Revenue (million) Forecast, by Application 2020 & 2033
- Table 20: South Korea Fluid Loss Additive Market Volume (kg/m3) Forecast, by Application 2020 & 2033
- Table 21: Rest of Asia Pacific Fluid Loss Additive Market Revenue (million) Forecast, by Application 2020 & 2033
- Table 22: Rest of Asia Pacific Fluid Loss Additive Market Volume (kg/m3) Forecast, by Application 2020 & 2033
- Table 23: Global Fluid Loss Additive Market Revenue million Forecast, by Additive Type 2020 & 2033
- Table 24: Global Fluid Loss Additive Market Volume kg/m3 Forecast, by Additive Type 2020 & 2033
- Table 25: Global Fluid Loss Additive Market Revenue million Forecast, by Application 2020 & 2033
- Table 26: Global Fluid Loss Additive Market Volume kg/m3 Forecast, by Application 2020 & 2033
- Table 27: Global Fluid Loss Additive Market Revenue million Forecast, by Country 2020 & 2033
- Table 28: Global Fluid Loss Additive Market Volume kg/m3 Forecast, by Country 2020 & 2033
- Table 29: United States Fluid Loss Additive Market Revenue (million) Forecast, by Application 2020 & 2033
- Table 30: United States Fluid Loss Additive Market Volume (kg/m3) Forecast, by Application 2020 & 2033
- Table 31: Canada Fluid Loss Additive Market Revenue (million) Forecast, by Application 2020 & 2033
- Table 32: Canada Fluid Loss Additive Market Volume (kg/m3) Forecast, by Application 2020 & 2033
- Table 33: Mexico Fluid Loss Additive Market Revenue (million) Forecast, by Application 2020 & 2033
- Table 34: Mexico Fluid Loss Additive Market Volume (kg/m3) Forecast, by Application 2020 & 2033
- Table 35: Global Fluid Loss Additive Market Revenue million Forecast, by Additive Type 2020 & 2033
- Table 36: Global Fluid Loss Additive Market Volume kg/m3 Forecast, by Additive Type 2020 & 2033
- Table 37: Global Fluid Loss Additive Market Revenue million Forecast, by Application 2020 & 2033
- Table 38: Global Fluid Loss Additive Market Volume kg/m3 Forecast, by Application 2020 & 2033
- Table 39: Global Fluid Loss Additive Market Revenue million Forecast, by Country 2020 & 2033
- Table 40: Global Fluid Loss Additive Market Volume kg/m3 Forecast, by Country 2020 & 2033
- Table 41: Germany Fluid Loss Additive Market Revenue (million) Forecast, by Application 2020 & 2033
- Table 42: Germany Fluid Loss Additive Market Volume (kg/m3) Forecast, by Application 2020 & 2033
- Table 43: United Kingdom Fluid Loss Additive Market Revenue (million) Forecast, by Application 2020 & 2033
- Table 44: United Kingdom Fluid Loss Additive Market Volume (kg/m3) Forecast, by Application 2020 & 2033
- Table 45: France Fluid Loss Additive Market Revenue (million) Forecast, by Application 2020 & 2033
- Table 46: France Fluid Loss Additive Market Volume (kg/m3) Forecast, by Application 2020 & 2033
- Table 47: Italy Fluid Loss Additive Market Revenue (million) Forecast, by Application 2020 & 2033
- Table 48: Italy Fluid Loss Additive Market Volume (kg/m3) Forecast, by Application 2020 & 2033
- Table 49: Rest of Europe Fluid Loss Additive Market Revenue (million) Forecast, by Application 2020 & 2033
- Table 50: Rest of Europe Fluid Loss Additive Market Volume (kg/m3) Forecast, by Application 2020 & 2033
- Table 51: Global Fluid Loss Additive Market Revenue million Forecast, by Additive Type 2020 & 2033
- Table 52: Global Fluid Loss Additive Market Volume kg/m3 Forecast, by Additive Type 2020 & 2033
- Table 53: Global Fluid Loss Additive Market Revenue million Forecast, by Application 2020 & 2033
- Table 54: Global Fluid Loss Additive Market Volume kg/m3 Forecast, by Application 2020 & 2033
- Table 55: Global Fluid Loss Additive Market Revenue million Forecast, by Country 2020 & 2033
- Table 56: Global Fluid Loss Additive Market Volume kg/m3 Forecast, by Country 2020 & 2033
- Table 57: Brazil Fluid Loss Additive Market Revenue (million) Forecast, by Application 2020 & 2033
- Table 58: Brazil Fluid Loss Additive Market Volume (kg/m3) Forecast, by Application 2020 & 2033
- Table 59: Argentina Fluid Loss Additive Market Revenue (million) Forecast, by Application 2020 & 2033
- Table 60: Argentina Fluid Loss Additive Market Volume (kg/m3) Forecast, by Application 2020 & 2033
- Table 61: Rest of South America Fluid Loss Additive Market Revenue (million) Forecast, by Application 2020 & 2033
- Table 62: Rest of South America Fluid Loss Additive Market Volume (kg/m3) Forecast, by Application 2020 & 2033
- Table 63: Global Fluid Loss Additive Market Revenue million Forecast, by Additive Type 2020 & 2033
- Table 64: Global Fluid Loss Additive Market Volume kg/m3 Forecast, by Additive Type 2020 & 2033
- Table 65: Global Fluid Loss Additive Market Revenue million Forecast, by Application 2020 & 2033
- Table 66: Global Fluid Loss Additive Market Volume kg/m3 Forecast, by Application 2020 & 2033
- Table 67: Global Fluid Loss Additive Market Revenue million Forecast, by Country 2020 & 2033
- Table 68: Global Fluid Loss Additive Market Volume kg/m3 Forecast, by Country 2020 & 2033
- Table 69: Saudi Arabia Fluid Loss Additive Market Revenue (million) Forecast, by Application 2020 & 2033
- Table 70: Saudi Arabia Fluid Loss Additive Market Volume (kg/m3) Forecast, by Application 2020 & 2033
- Table 71: South Africa Fluid Loss Additive Market Revenue (million) Forecast, by Application 2020 & 2033
- Table 72: South Africa Fluid Loss Additive Market Volume (kg/m3) Forecast, by Application 2020 & 2033
- Table 73: Rest of Middle East and Africa Fluid Loss Additive Market Revenue (million) Forecast, by Application 2020 & 2033
- Table 74: Rest of Middle East and Africa Fluid Loss Additive Market Volume (kg/m3) Forecast, by Application 2020 & 2033
Frequently Asked Questions
1. What is the projected Compound Annual Growth Rate (CAGR) of the Fluid Loss Additive Market?
The projected CAGR is approximately 6.23%.
2. Which companies are prominent players in the Fluid Loss Additive Market?
Key companies in the market include Clariant, Nouryon, Global Drilling Fluids and Chemicals Limited, Solvay, Newpark Resources Inc, Kemira OYJ, BASF SE, Tytan Organics Pvt Ltd, Halliburton, Schlumberger Limited.
3. What are the main segments of the Fluid Loss Additive Market?
The market segments include Additive Type, Application.
4. Can you provide details about the market size?
The market size is estimated to be USD 383.25 million as of 2022.
5. What are some drivers contributing to market growth?
; Increase in Shale Gas Exploration; Increasing Investments in the Latest and Unconventional Drilling Technologies.
6. What are the notable trends driving market growth?
Drilling Fluid Application to Dominate the Market.
7. Are there any restraints impacting market growth?
; Growing Demand for Electric Vehicles; Harmful Impact on Environment.
8. Can you provide examples of recent developments in the market?
N/A
9. What pricing options are available for accessing the report?
Pricing options include single-user, multi-user, and enterprise licenses priced at USD 4750, USD 5250, and USD 8750 respectively.
10. Is the market size provided in terms of value or volume?
The market size is provided in terms of value, measured in million and volume, measured in kg/m3.
11. Are there any specific market keywords associated with the report?
Yes, the market keyword associated with the report is "Fluid Loss Additive Market," which aids in identifying and referencing the specific market segment covered.
12. How do I determine which pricing option suits my needs best?
The pricing options vary based on user requirements and access needs. Individual users may opt for single-user licenses, while businesses requiring broader access may choose multi-user or enterprise licenses for cost-effective access to the report.
13. Are there any additional resources or data provided in the Fluid Loss Additive Market report?
While the report offers comprehensive insights, it's advisable to review the specific contents or supplementary materials provided to ascertain if additional resources or data are available.
14. How can I stay updated on further developments or reports in the Fluid Loss Additive Market?
To stay informed about further developments, trends, and reports in the Fluid Loss Additive Market, consider subscribing to industry newsletters, following relevant companies and organizations, or regularly checking reputable industry news sources and publications.
Methodology
Step 1 - Identification of Relevant Samples Size from Population Database


Step 2 - Approaches for Defining Global Market Size (Value, Volume* & Price*)

Note*: In applicable scenarios
Step 3 - Data Sources
Primary Research
- Web Analytics
- Survey Reports
- Research Institute
- Latest Research Reports
- Opinion Leaders
Secondary Research
- Annual Reports
- White Paper
- Latest Press Release
- Industry Association
- Paid Database
- Investor Presentations

Step 4 - Data Triangulation
Involves using different sources of information in order to increase the validity of a study
These sources are likely to be stakeholders in a program - participants, other researchers, program staff, other community members, and so on.
Then we put all data in single framework & apply various statistical tools to find out the dynamic on the market.
During the analysis stage, feedback from the stakeholder groups would be compared to determine areas of agreement as well as areas of divergence

