Key Insights
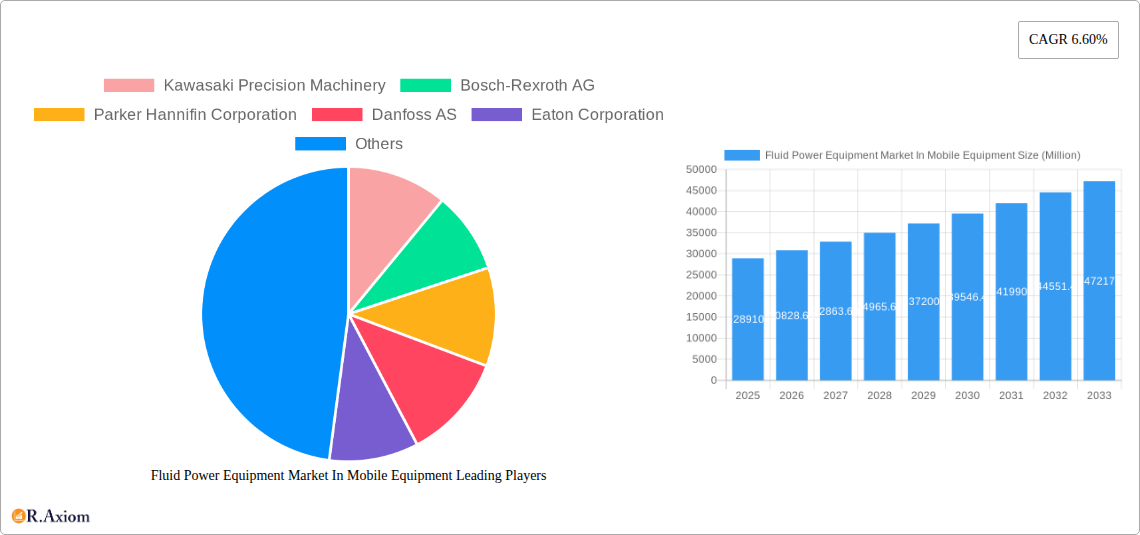
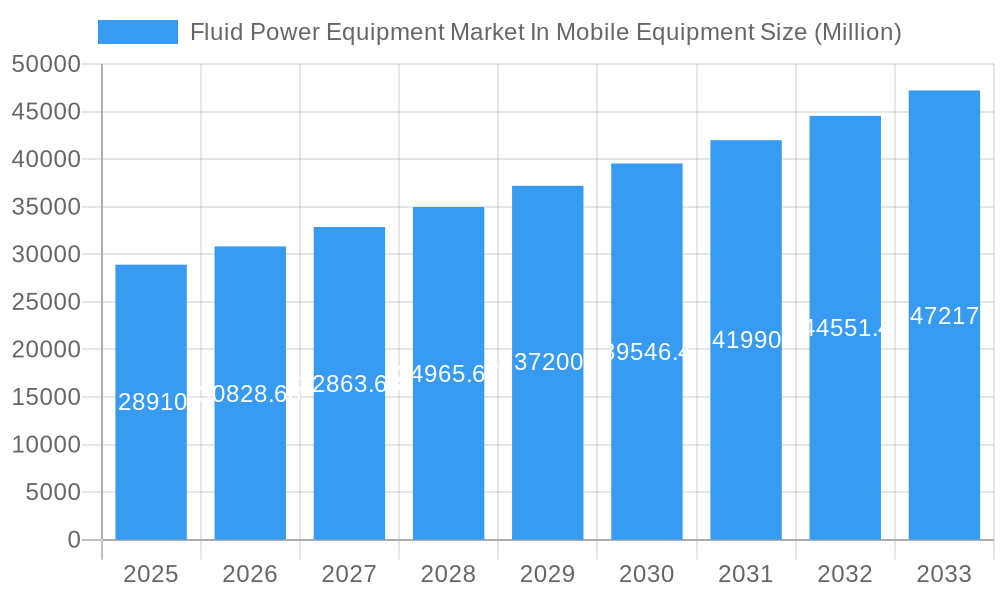
The Fluid Power Equipment Market in Mobile Equipment is experiencing robust growth, projected to reach a market size of $28.91 billion in 2025, with a compound annual growth rate (CAGR) of 6.60% from 2019 to 2033. This expansion is fueled by several key drivers. Increasing demand for efficient and powerful mobile equipment across diverse sectors like construction, agriculture, and materials handling is a primary factor. Advancements in hydraulic and pneumatic technologies, leading to improved energy efficiency and enhanced performance, further propel market growth. The rising adoption of automation and advanced control systems in mobile machinery also contributes significantly. Furthermore, stringent emission regulations globally are pushing manufacturers towards developing more sustainable and eco-friendly fluid power solutions, creating new market opportunities. Key players like Kawasaki Precision Machinery, Bosch-Rexroth AG, and Parker Hannifin Corporation are driving innovation and competition within the market, expanding their product portfolios and global reach. However, challenges remain, including the volatility of raw material prices and concerns about the environmental impact of certain fluid power components. The market is segmented by equipment type (e.g., excavators, forklifts, tractors), application (e.g., construction, agriculture), and component type (e.g., pumps, valves, actuators). Future growth will be significantly influenced by technological advancements, government regulations, and the overall economic outlook of key industries reliant on mobile equipment.
Fluid Power Equipment Market In Mobile Equipment Market Size (In Billion)
The forecast period from 2025 to 2033 anticipates continued market expansion, driven by ongoing technological innovations and increasing demand across various mobile equipment applications. The market's segmentation offers opportunities for specialized players to target niche applications. Regional variations in market growth will be influenced by factors such as economic development, infrastructure investment, and regulatory environments. Competition among established players is likely to intensify, with a focus on product differentiation, innovation, and strategic partnerships to capture market share. The market's future trajectory will depend on the successful integration of sustainable technologies, the adoption of Industry 4.0 principles, and the ability of manufacturers to address the challenges posed by fluctuating raw material costs and environmental concerns.
Fluid Power Equipment Market In Mobile Equipment Company Market Share
Fluid Power Equipment Market in Mobile Equipment: A Comprehensive Market Report (2019-2033)
This detailed report provides an in-depth analysis of the Fluid Power Equipment Market in Mobile Equipment, offering invaluable insights for industry stakeholders, investors, and strategic decision-makers. The study period covers 2019-2033, with a base year of 2025 and a forecast period of 2025-2033. The report includes comprehensive market sizing, segmentation, and competitive landscape analysis, providing actionable intelligence for navigating this dynamic market. Expected market value is xx Million by 2033.
Fluid Power Equipment Market In Mobile Equipment Market Concentration & Innovation
This section analyzes the market concentration, highlighting key players and their market share. The report assesses innovation drivers such as technological advancements in hydraulic components and electrification trends. Regulatory frameworks impacting the industry, including emission standards and safety regulations, are examined. The analysis also considers the impact of product substitutes, such as electric and hybrid systems, and evolving end-user trends, such as the demand for greater efficiency and automation. Finally, the report explores mergers and acquisitions (M&A) activities within the market, analyzing deal values and their implications for market consolidation.
- Market Share: The report will detail the market share of major players like Parker Hannifin, Bosch Rexroth, and others, providing a clear picture of market concentration.
- M&A Activity: The report analyzes key M&A deals, including deal values and their strategic implications for market growth and consolidation. Expected deal value in the forecast period is predicted to be xx Million.
- Innovation Drivers: Detailed analysis of technological advancements such as electro-hydraulic systems, and their impact on market dynamics.
Fluid Power Equipment Market In Mobile Equipment Industry Trends & Insights
This section delves into the key trends shaping the Fluid Power Equipment Market in Mobile Equipment. It explores market growth drivers, including the increasing demand for mobile equipment in various industries (construction, agriculture, etc.), and technological disruptions impacting the industry. Consumer preferences toward more efficient, reliable, and environmentally friendly equipment are analyzed. The competitive dynamics, including pricing strategies and product differentiation, are explored, providing a comprehensive understanding of the market's evolution. Specific metrics like Compound Annual Growth Rate (CAGR) and market penetration rates are provided for key segments. The CAGR for the forecast period is projected to be xx%. Market penetration is expected to reach xx% by 2033.
Dominant Markets & Segments in Fluid Power Equipment Market In Mobile Equipment
This section identifies the leading regions, countries, and segments within the Fluid Power Equipment Market in Mobile Equipment. A detailed dominance analysis, along with key drivers for each dominant market, is provided. These drivers include economic policies supporting infrastructure development, and government regulations impacting the sector.
- Leading Region: The report will identify the leading region for fluid power equipment in mobile equipment and provide detailed reasons for its dominance.
- Key Drivers: Bullet points detailing the economic policies, infrastructure investments, and other factors driving market growth in the leading region(s).
- Dominance Analysis: A detailed paragraph explaining the factors contributing to the dominance of the leading region/country/segment.
Fluid Power Equipment Market In Mobile Equipment Product Developments
This section summarizes recent product innovations, highlighting their applications and competitive advantages. Technological trends driving innovation, such as the integration of advanced sensors and control systems, are discussed. The market fit of new products and their impact on market competitiveness are analyzed.
Report Scope & Segmentation Analysis
This section details all market segmentations considered in the report. Each segment's growth projections, market size, and competitive dynamics are presented. The report analyzes segments based on equipment type, application, and geography.
- Equipment Type: Analysis of market size and growth for different equipment types, such as pumps, motors, valves, and cylinders.
- Application: Market segmentation by application, such as construction, agriculture, and material handling.
- Geography: Market segmentation by region (North America, Europe, Asia-Pacific, etc.).
Key Drivers of Fluid Power Equipment Market In Mobile Equipment Growth
This section outlines the key factors driving market growth. These drivers are categorized as technological advancements (e.g., development of more efficient hydraulic components), economic factors (e.g., increasing infrastructure spending), and regulatory changes (e.g., stricter emission norms).
Challenges in the Fluid Power Equipment Market In Mobile Equipment Sector
This section identifies and discusses the key challenges facing the Fluid Power Equipment Market in Mobile Equipment. These challenges include regulatory hurdles, supply chain disruptions, and intense competition. Quantifiable impacts of these challenges on market growth are also presented.
Emerging Opportunities in Fluid Power Equipment Market In Mobile Equipment
This section highlights emerging trends and opportunities within the market. These include the adoption of new technologies, the expansion into new markets, and the changing consumer preferences towards sustainable and efficient equipment. Examples of specific opportunities are provided.
Leading Players in the Fluid Power Equipment Market In Mobile Equipment Market
This section profiles the leading players in the fluid power equipment market for mobile equipment. It includes a vendor ranking analysis.
- Kawasaki Precision Machinery
- Bosch-Rexroth AG
- Parker Hannifin Corporation
- Danfoss AS
- Eaton Corporation
- Hydac International GmbH
- HydraForce Inc
- Festo Corporation
- SMC Corporation
- List Not Exhaustive
Key Developments in Fluid Power Equipment Market In Mobile Equipment Industry
This section details significant industry developments.
- July 2023: Bosch Rexroth opened a new plant in Querétaro, Mexico, investing EUR 160 Million and creating 900 jobs by 2027, boosting North American manufacturing capacity for mobile hydraulics.
- February 2024: Eaton's Mobility Group expanded its portfolio with new Bezares PTO units and APSCO directional control valves, showcased at the Work Truck Show in Indianapolis.
Strategic Outlook for Fluid Power Equipment Market In Mobile Equipment Market
This section summarizes the key growth catalysts and provides a strategic outlook for the future of the Fluid Power Equipment Market in Mobile Equipment, highlighting its market potential and emerging opportunities. The report concludes with strategic recommendations for businesses operating in this market.
Fluid Power Equipment Market In Mobile Equipment Segmentation
-
1. Product Type
-
1.1. Hydraulics
- 1.1.1. Pumps
- 1.1.2. Motors
- 1.1.3. Valves
- 1.1.4. Cylinders
- 1.1.5. Accumulators and Filters
- 1.1.6. Other Pr
-
1.2. Pneumatics
- 1.2.1. Actuators
- 1.2.2. FRLs
- 1.2.3. Fittings
- 1.2.4. Other Pr
-
1.1. Hydraulics
-
2. End-user Vertical
- 2.1. Construction
- 2.2. Agriculture
- 2.3. Material Handling
- 2.4. Mining
- 2.5. Other En
Fluid Power Equipment Market In Mobile Equipment Segmentation By Geography
- 1. North America
- 2. Asia
- 3. Europe
- 4. Latin America
- 5. Middle East and Africa
- 6. Australia and New Zealand
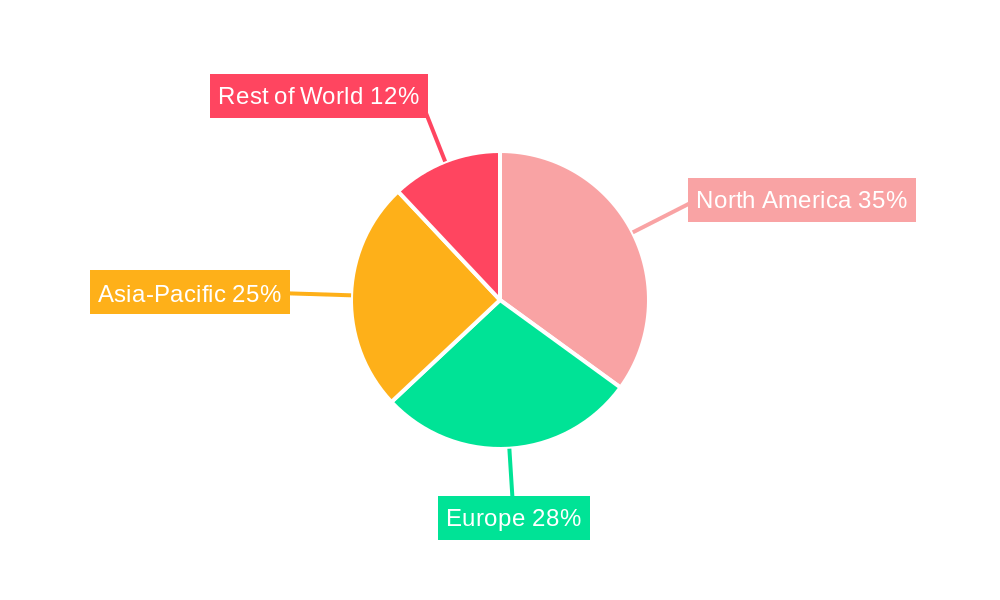
Fluid Power Equipment Market In Mobile Equipment Regional Market Share
Geographic Coverage of Fluid Power Equipment Market In Mobile Equipment
Fluid Power Equipment Market In Mobile Equipment REPORT HIGHLIGHTS
| Aspects | Details |
|---|---|
| Study Period | 2020-2034 |
| Base Year | 2025 |
| Estimated Year | 2026 |
| Forecast Period | 2026-2034 |
| Historical Period | 2020-2025 |
| Growth Rate | CAGR of 6.60% from 2020-2034 |
| Segmentation |
|
Table of Contents
- 1. Introduction
- 1.1. Research Scope
- 1.2. Market Segmentation
- 1.3. Research Objective
- 1.4. Definitions and Assumptions
- 2. Executive Summary
- 2.1. Market Snapshot
- 3. Market Dynamics
- 3.1. Market Drivers
- 3.2. Market Restrains
- 3.3. Market Trends
- 3.4. Market Opportunities
- 4. Market Factor Analysis
- 4.1. Porters Five Forces
- 4.1.1. Bargaining Power of Suppliers
- 4.1.2. Bargaining Power of Buyers
- 4.1.3. Threat of New Entrants
- 4.1.4. Threat of Substitutes
- 4.1.5. Competitive Rivalry
- 4.2. PESTEL analysis
- 4.3. BCG Analysis
- 4.3.1. Stars (High Growth, High Market Share)
- 4.3.2. Cash Cows (Low Growth, High Market Share)
- 4.3.3. Question Mark (High Growth, Low Market Share)
- 4.3.4. Dogs (Low Growth, Low Market Share)
- 4.4. Ansoff Matrix Analysis
- 4.5. Supply Chain Analysis
- 4.6. Regulatory Landscape
- 4.7. Current Market Potential and Opportunity Assessment (TAM–SAM–SOM Framework)
- 4.8. RAX Analyst Note
- 4.1. Porters Five Forces
- 5. Market Analysis, Insights and Forecast 2021-2033
- 5.1. Market Analysis, Insights and Forecast - by Product Type
- 5.1.1. Hydraulics
- 5.1.1.1. Pumps
- 5.1.1.2. Motors
- 5.1.1.3. Valves
- 5.1.1.4. Cylinders
- 5.1.1.5. Accumulators and Filters
- 5.1.1.6. Other Pr
- 5.1.2. Pneumatics
- 5.1.2.1. Actuators
- 5.1.2.2. FRLs
- 5.1.2.3. Fittings
- 5.1.2.4. Other Pr
- 5.1.1. Hydraulics
- 5.2. Market Analysis, Insights and Forecast - by End-user Vertical
- 5.2.1. Construction
- 5.2.2. Agriculture
- 5.2.3. Material Handling
- 5.2.4. Mining
- 5.2.5. Other En
- 5.3. Market Analysis, Insights and Forecast - by Region
- 5.3.1. North America
- 5.3.2. Asia
- 5.3.3. Europe
- 5.3.4. Latin America
- 5.3.5. Middle East and Africa
- 5.3.6. Australia and New Zealand
- 5.1. Market Analysis, Insights and Forecast - by Product Type
- 6. Global Fluid Power Equipment Market In Mobile Equipment Analysis, Insights and Forecast, 2021-2033
- 6.1. Market Analysis, Insights and Forecast - by Product Type
- 6.1.1. Hydraulics
- 6.1.1.1. Pumps
- 6.1.1.2. Motors
- 6.1.1.3. Valves
- 6.1.1.4. Cylinders
- 6.1.1.5. Accumulators and Filters
- 6.1.1.6. Other Pr
- 6.1.2. Pneumatics
- 6.1.2.1. Actuators
- 6.1.2.2. FRLs
- 6.1.2.3. Fittings
- 6.1.2.4. Other Pr
- 6.1.1. Hydraulics
- 6.2. Market Analysis, Insights and Forecast - by End-user Vertical
- 6.2.1. Construction
- 6.2.2. Agriculture
- 6.2.3. Material Handling
- 6.2.4. Mining
- 6.2.5. Other En
- 6.1. Market Analysis, Insights and Forecast - by Product Type
- 7. North America Fluid Power Equipment Market In Mobile Equipment Analysis, Insights and Forecast, 2020-2032
- 7.1. Market Analysis, Insights and Forecast - by Product Type
- 7.1.1. Hydraulics
- 7.1.1.1. Pumps
- 7.1.1.2. Motors
- 7.1.1.3. Valves
- 7.1.1.4. Cylinders
- 7.1.1.5. Accumulators and Filters
- 7.1.1.6. Other Pr
- 7.1.2. Pneumatics
- 7.1.2.1. Actuators
- 7.1.2.2. FRLs
- 7.1.2.3. Fittings
- 7.1.2.4. Other Pr
- 7.1.1. Hydraulics
- 7.2. Market Analysis, Insights and Forecast - by End-user Vertical
- 7.2.1. Construction
- 7.2.2. Agriculture
- 7.2.3. Material Handling
- 7.2.4. Mining
- 7.2.5. Other En
- 7.1. Market Analysis, Insights and Forecast - by Product Type
- 8. Asia Fluid Power Equipment Market In Mobile Equipment Analysis, Insights and Forecast, 2020-2032
- 8.1. Market Analysis, Insights and Forecast - by Product Type
- 8.1.1. Hydraulics
- 8.1.1.1. Pumps
- 8.1.1.2. Motors
- 8.1.1.3. Valves
- 8.1.1.4. Cylinders
- 8.1.1.5. Accumulators and Filters
- 8.1.1.6. Other Pr
- 8.1.2. Pneumatics
- 8.1.2.1. Actuators
- 8.1.2.2. FRLs
- 8.1.2.3. Fittings
- 8.1.2.4. Other Pr
- 8.1.1. Hydraulics
- 8.2. Market Analysis, Insights and Forecast - by End-user Vertical
- 8.2.1. Construction
- 8.2.2. Agriculture
- 8.2.3. Material Handling
- 8.2.4. Mining
- 8.2.5. Other En
- 8.1. Market Analysis, Insights and Forecast - by Product Type
- 9. Europe Fluid Power Equipment Market In Mobile Equipment Analysis, Insights and Forecast, 2020-2032
- 9.1. Market Analysis, Insights and Forecast - by Product Type
- 9.1.1. Hydraulics
- 9.1.1.1. Pumps
- 9.1.1.2. Motors
- 9.1.1.3. Valves
- 9.1.1.4. Cylinders
- 9.1.1.5. Accumulators and Filters
- 9.1.1.6. Other Pr
- 9.1.2. Pneumatics
- 9.1.2.1. Actuators
- 9.1.2.2. FRLs
- 9.1.2.3. Fittings
- 9.1.2.4. Other Pr
- 9.1.1. Hydraulics
- 9.2. Market Analysis, Insights and Forecast - by End-user Vertical
- 9.2.1. Construction
- 9.2.2. Agriculture
- 9.2.3. Material Handling
- 9.2.4. Mining
- 9.2.5. Other En
- 9.1. Market Analysis, Insights and Forecast - by Product Type
- 10. Latin America Fluid Power Equipment Market In Mobile Equipment Analysis, Insights and Forecast, 2020-2032
- 10.1. Market Analysis, Insights and Forecast - by Product Type
- 10.1.1. Hydraulics
- 10.1.1.1. Pumps
- 10.1.1.2. Motors
- 10.1.1.3. Valves
- 10.1.1.4. Cylinders
- 10.1.1.5. Accumulators and Filters
- 10.1.1.6. Other Pr
- 10.1.2. Pneumatics
- 10.1.2.1. Actuators
- 10.1.2.2. FRLs
- 10.1.2.3. Fittings
- 10.1.2.4. Other Pr
- 10.1.1. Hydraulics
- 10.2. Market Analysis, Insights and Forecast - by End-user Vertical
- 10.2.1. Construction
- 10.2.2. Agriculture
- 10.2.3. Material Handling
- 10.2.4. Mining
- 10.2.5. Other En
- 10.1. Market Analysis, Insights and Forecast - by Product Type
- 11. Middle East and Africa Fluid Power Equipment Market In Mobile Equipment Analysis, Insights and Forecast, 2020-2032
- 11.1. Market Analysis, Insights and Forecast - by Product Type
- 11.1.1. Hydraulics
- 11.1.1.1. Pumps
- 11.1.1.2. Motors
- 11.1.1.3. Valves
- 11.1.1.4. Cylinders
- 11.1.1.5. Accumulators and Filters
- 11.1.1.6. Other Pr
- 11.1.2. Pneumatics
- 11.1.2.1. Actuators
- 11.1.2.2. FRLs
- 11.1.2.3. Fittings
- 11.1.2.4. Other Pr
- 11.1.1. Hydraulics
- 11.2. Market Analysis, Insights and Forecast - by End-user Vertical
- 11.2.1. Construction
- 11.2.2. Agriculture
- 11.2.3. Material Handling
- 11.2.4. Mining
- 11.2.5. Other En
- 11.1. Market Analysis, Insights and Forecast - by Product Type
- 12. Australia and New Zealand Fluid Power Equipment Market In Mobile Equipment Analysis, Insights and Forecast, 2020-2032
- 12.1. Market Analysis, Insights and Forecast - by Product Type
- 12.1.1. Hydraulics
- 12.1.1.1. Pumps
- 12.1.1.2. Motors
- 12.1.1.3. Valves
- 12.1.1.4. Cylinders
- 12.1.1.5. Accumulators and Filters
- 12.1.1.6. Other Pr
- 12.1.2. Pneumatics
- 12.1.2.1. Actuators
- 12.1.2.2. FRLs
- 12.1.2.3. Fittings
- 12.1.2.4. Other Pr
- 12.1.1. Hydraulics
- 12.2. Market Analysis, Insights and Forecast - by End-user Vertical
- 12.2.1. Construction
- 12.2.2. Agriculture
- 12.2.3. Material Handling
- 12.2.4. Mining
- 12.2.5. Other En
- 12.1. Market Analysis, Insights and Forecast - by Product Type
- 13. Competitive Analysis
- 13.1. Company Profiles
- 13.1.1 Kawasaki Precision Machinery
- 13.1.1.1. Company Overview
- 13.1.1.2. Products
- 13.1.1.3. Company Financials
- 13.1.1.4. SWOT Analysis
- 13.1.2 Bosch-Rexroth AG
- 13.1.2.1. Company Overview
- 13.1.2.2. Products
- 13.1.2.3. Company Financials
- 13.1.2.4. SWOT Analysis
- 13.1.3 Parker Hannifin Corporation
- 13.1.3.1. Company Overview
- 13.1.3.2. Products
- 13.1.3.3. Company Financials
- 13.1.3.4. SWOT Analysis
- 13.1.4 Danfoss AS
- 13.1.4.1. Company Overview
- 13.1.4.2. Products
- 13.1.4.3. Company Financials
- 13.1.4.4. SWOT Analysis
- 13.1.5 Eaton Corporation
- 13.1.5.1. Company Overview
- 13.1.5.2. Products
- 13.1.5.3. Company Financials
- 13.1.5.4. SWOT Analysis
- 13.1.6 Hydac International GmbH
- 13.1.6.1. Company Overview
- 13.1.6.2. Products
- 13.1.6.3. Company Financials
- 13.1.6.4. SWOT Analysis
- 13.1.7 HydraForce Inc
- 13.1.7.1. Company Overview
- 13.1.7.2. Products
- 13.1.7.3. Company Financials
- 13.1.7.4. SWOT Analysis
- 13.1.8 Festo Corporation
- 13.1.8.1. Company Overview
- 13.1.8.2. Products
- 13.1.8.3. Company Financials
- 13.1.8.4. SWOT Analysis
- 13.1.9 SMC Corporation*List Not Exhaustive 7 2 Vendor Ranking Analysi
- 13.1.9.1. Company Overview
- 13.1.9.2. Products
- 13.1.9.3. Company Financials
- 13.1.9.4. SWOT Analysis
- 13.1.1 Kawasaki Precision Machinery
- 13.2. Market Entropy
- 13.2.1 Company's Key Areas Served
- 13.2.2 Recent Developments
- 13.3. Company Market Share Analysis 2025
- 13.3.1 Top 5 Companies Market Share Analysis
- 13.3.2 Top 3 Companies Market Share Analysis
- 13.4. List of Potential Customers
- 14. Research Methodology
List of Figures
- Figure 1: Global Fluid Power Equipment Market In Mobile Equipment Revenue Breakdown (Million, %) by Region 2025 & 2033
- Figure 2: Global Fluid Power Equipment Market In Mobile Equipment Volume Breakdown (Billion, %) by Region 2025 & 2033
- Figure 3: North America Fluid Power Equipment Market In Mobile Equipment Revenue (Million), by Product Type 2025 & 2033
- Figure 4: North America Fluid Power Equipment Market In Mobile Equipment Volume (Billion), by Product Type 2025 & 2033
- Figure 5: North America Fluid Power Equipment Market In Mobile Equipment Revenue Share (%), by Product Type 2025 & 2033
- Figure 6: North America Fluid Power Equipment Market In Mobile Equipment Volume Share (%), by Product Type 2025 & 2033
- Figure 7: North America Fluid Power Equipment Market In Mobile Equipment Revenue (Million), by End-user Vertical 2025 & 2033
- Figure 8: North America Fluid Power Equipment Market In Mobile Equipment Volume (Billion), by End-user Vertical 2025 & 2033
- Figure 9: North America Fluid Power Equipment Market In Mobile Equipment Revenue Share (%), by End-user Vertical 2025 & 2033
- Figure 10: North America Fluid Power Equipment Market In Mobile Equipment Volume Share (%), by End-user Vertical 2025 & 2033
- Figure 11: North America Fluid Power Equipment Market In Mobile Equipment Revenue (Million), by Country 2025 & 2033
- Figure 12: North America Fluid Power Equipment Market In Mobile Equipment Volume (Billion), by Country 2025 & 2033
- Figure 13: North America Fluid Power Equipment Market In Mobile Equipment Revenue Share (%), by Country 2025 & 2033
- Figure 14: North America Fluid Power Equipment Market In Mobile Equipment Volume Share (%), by Country 2025 & 2033
- Figure 15: Asia Fluid Power Equipment Market In Mobile Equipment Revenue (Million), by Product Type 2025 & 2033
- Figure 16: Asia Fluid Power Equipment Market In Mobile Equipment Volume (Billion), by Product Type 2025 & 2033
- Figure 17: Asia Fluid Power Equipment Market In Mobile Equipment Revenue Share (%), by Product Type 2025 & 2033
- Figure 18: Asia Fluid Power Equipment Market In Mobile Equipment Volume Share (%), by Product Type 2025 & 2033
- Figure 19: Asia Fluid Power Equipment Market In Mobile Equipment Revenue (Million), by End-user Vertical 2025 & 2033
- Figure 20: Asia Fluid Power Equipment Market In Mobile Equipment Volume (Billion), by End-user Vertical 2025 & 2033
- Figure 21: Asia Fluid Power Equipment Market In Mobile Equipment Revenue Share (%), by End-user Vertical 2025 & 2033
- Figure 22: Asia Fluid Power Equipment Market In Mobile Equipment Volume Share (%), by End-user Vertical 2025 & 2033
- Figure 23: Asia Fluid Power Equipment Market In Mobile Equipment Revenue (Million), by Country 2025 & 2033
- Figure 24: Asia Fluid Power Equipment Market In Mobile Equipment Volume (Billion), by Country 2025 & 2033
- Figure 25: Asia Fluid Power Equipment Market In Mobile Equipment Revenue Share (%), by Country 2025 & 2033
- Figure 26: Asia Fluid Power Equipment Market In Mobile Equipment Volume Share (%), by Country 2025 & 2033
- Figure 27: Europe Fluid Power Equipment Market In Mobile Equipment Revenue (Million), by Product Type 2025 & 2033
- Figure 28: Europe Fluid Power Equipment Market In Mobile Equipment Volume (Billion), by Product Type 2025 & 2033
- Figure 29: Europe Fluid Power Equipment Market In Mobile Equipment Revenue Share (%), by Product Type 2025 & 2033
- Figure 30: Europe Fluid Power Equipment Market In Mobile Equipment Volume Share (%), by Product Type 2025 & 2033
- Figure 31: Europe Fluid Power Equipment Market In Mobile Equipment Revenue (Million), by End-user Vertical 2025 & 2033
- Figure 32: Europe Fluid Power Equipment Market In Mobile Equipment Volume (Billion), by End-user Vertical 2025 & 2033
- Figure 33: Europe Fluid Power Equipment Market In Mobile Equipment Revenue Share (%), by End-user Vertical 2025 & 2033
- Figure 34: Europe Fluid Power Equipment Market In Mobile Equipment Volume Share (%), by End-user Vertical 2025 & 2033
- Figure 35: Europe Fluid Power Equipment Market In Mobile Equipment Revenue (Million), by Country 2025 & 2033
- Figure 36: Europe Fluid Power Equipment Market In Mobile Equipment Volume (Billion), by Country 2025 & 2033
- Figure 37: Europe Fluid Power Equipment Market In Mobile Equipment Revenue Share (%), by Country 2025 & 2033
- Figure 38: Europe Fluid Power Equipment Market In Mobile Equipment Volume Share (%), by Country 2025 & 2033
- Figure 39: Latin America Fluid Power Equipment Market In Mobile Equipment Revenue (Million), by Product Type 2025 & 2033
- Figure 40: Latin America Fluid Power Equipment Market In Mobile Equipment Volume (Billion), by Product Type 2025 & 2033
- Figure 41: Latin America Fluid Power Equipment Market In Mobile Equipment Revenue Share (%), by Product Type 2025 & 2033
- Figure 42: Latin America Fluid Power Equipment Market In Mobile Equipment Volume Share (%), by Product Type 2025 & 2033
- Figure 43: Latin America Fluid Power Equipment Market In Mobile Equipment Revenue (Million), by End-user Vertical 2025 & 2033
- Figure 44: Latin America Fluid Power Equipment Market In Mobile Equipment Volume (Billion), by End-user Vertical 2025 & 2033
- Figure 45: Latin America Fluid Power Equipment Market In Mobile Equipment Revenue Share (%), by End-user Vertical 2025 & 2033
- Figure 46: Latin America Fluid Power Equipment Market In Mobile Equipment Volume Share (%), by End-user Vertical 2025 & 2033
- Figure 47: Latin America Fluid Power Equipment Market In Mobile Equipment Revenue (Million), by Country 2025 & 2033
- Figure 48: Latin America Fluid Power Equipment Market In Mobile Equipment Volume (Billion), by Country 2025 & 2033
- Figure 49: Latin America Fluid Power Equipment Market In Mobile Equipment Revenue Share (%), by Country 2025 & 2033
- Figure 50: Latin America Fluid Power Equipment Market In Mobile Equipment Volume Share (%), by Country 2025 & 2033
- Figure 51: Middle East and Africa Fluid Power Equipment Market In Mobile Equipment Revenue (Million), by Product Type 2025 & 2033
- Figure 52: Middle East and Africa Fluid Power Equipment Market In Mobile Equipment Volume (Billion), by Product Type 2025 & 2033
- Figure 53: Middle East and Africa Fluid Power Equipment Market In Mobile Equipment Revenue Share (%), by Product Type 2025 & 2033
- Figure 54: Middle East and Africa Fluid Power Equipment Market In Mobile Equipment Volume Share (%), by Product Type 2025 & 2033
- Figure 55: Middle East and Africa Fluid Power Equipment Market In Mobile Equipment Revenue (Million), by End-user Vertical 2025 & 2033
- Figure 56: Middle East and Africa Fluid Power Equipment Market In Mobile Equipment Volume (Billion), by End-user Vertical 2025 & 2033
- Figure 57: Middle East and Africa Fluid Power Equipment Market In Mobile Equipment Revenue Share (%), by End-user Vertical 2025 & 2033
- Figure 58: Middle East and Africa Fluid Power Equipment Market In Mobile Equipment Volume Share (%), by End-user Vertical 2025 & 2033
- Figure 59: Middle East and Africa Fluid Power Equipment Market In Mobile Equipment Revenue (Million), by Country 2025 & 2033
- Figure 60: Middle East and Africa Fluid Power Equipment Market In Mobile Equipment Volume (Billion), by Country 2025 & 2033
- Figure 61: Middle East and Africa Fluid Power Equipment Market In Mobile Equipment Revenue Share (%), by Country 2025 & 2033
- Figure 62: Middle East and Africa Fluid Power Equipment Market In Mobile Equipment Volume Share (%), by Country 2025 & 2033
- Figure 63: Australia and New Zealand Fluid Power Equipment Market In Mobile Equipment Revenue (Million), by Product Type 2025 & 2033
- Figure 64: Australia and New Zealand Fluid Power Equipment Market In Mobile Equipment Volume (Billion), by Product Type 2025 & 2033
- Figure 65: Australia and New Zealand Fluid Power Equipment Market In Mobile Equipment Revenue Share (%), by Product Type 2025 & 2033
- Figure 66: Australia and New Zealand Fluid Power Equipment Market In Mobile Equipment Volume Share (%), by Product Type 2025 & 2033
- Figure 67: Australia and New Zealand Fluid Power Equipment Market In Mobile Equipment Revenue (Million), by End-user Vertical 2025 & 2033
- Figure 68: Australia and New Zealand Fluid Power Equipment Market In Mobile Equipment Volume (Billion), by End-user Vertical 2025 & 2033
- Figure 69: Australia and New Zealand Fluid Power Equipment Market In Mobile Equipment Revenue Share (%), by End-user Vertical 2025 & 2033
- Figure 70: Australia and New Zealand Fluid Power Equipment Market In Mobile Equipment Volume Share (%), by End-user Vertical 2025 & 2033
- Figure 71: Australia and New Zealand Fluid Power Equipment Market In Mobile Equipment Revenue (Million), by Country 2025 & 2033
- Figure 72: Australia and New Zealand Fluid Power Equipment Market In Mobile Equipment Volume (Billion), by Country 2025 & 2033
- Figure 73: Australia and New Zealand Fluid Power Equipment Market In Mobile Equipment Revenue Share (%), by Country 2025 & 2033
- Figure 74: Australia and New Zealand Fluid Power Equipment Market In Mobile Equipment Volume Share (%), by Country 2025 & 2033
List of Tables
- Table 1: Global Fluid Power Equipment Market In Mobile Equipment Revenue Million Forecast, by Product Type 2020 & 2033
- Table 2: Global Fluid Power Equipment Market In Mobile Equipment Volume Billion Forecast, by Product Type 2020 & 2033
- Table 3: Global Fluid Power Equipment Market In Mobile Equipment Revenue Million Forecast, by End-user Vertical 2020 & 2033
- Table 4: Global Fluid Power Equipment Market In Mobile Equipment Volume Billion Forecast, by End-user Vertical 2020 & 2033
- Table 5: Global Fluid Power Equipment Market In Mobile Equipment Revenue Million Forecast, by Region 2020 & 2033
- Table 6: Global Fluid Power Equipment Market In Mobile Equipment Volume Billion Forecast, by Region 2020 & 2033
- Table 7: Global Fluid Power Equipment Market In Mobile Equipment Revenue Million Forecast, by Product Type 2020 & 2033
- Table 8: Global Fluid Power Equipment Market In Mobile Equipment Volume Billion Forecast, by Product Type 2020 & 2033
- Table 9: Global Fluid Power Equipment Market In Mobile Equipment Revenue Million Forecast, by End-user Vertical 2020 & 2033
- Table 10: Global Fluid Power Equipment Market In Mobile Equipment Volume Billion Forecast, by End-user Vertical 2020 & 2033
- Table 11: Global Fluid Power Equipment Market In Mobile Equipment Revenue Million Forecast, by Country 2020 & 2033
- Table 12: Global Fluid Power Equipment Market In Mobile Equipment Volume Billion Forecast, by Country 2020 & 2033
- Table 13: Global Fluid Power Equipment Market In Mobile Equipment Revenue Million Forecast, by Product Type 2020 & 2033
- Table 14: Global Fluid Power Equipment Market In Mobile Equipment Volume Billion Forecast, by Product Type 2020 & 2033
- Table 15: Global Fluid Power Equipment Market In Mobile Equipment Revenue Million Forecast, by End-user Vertical 2020 & 2033
- Table 16: Global Fluid Power Equipment Market In Mobile Equipment Volume Billion Forecast, by End-user Vertical 2020 & 2033
- Table 17: Global Fluid Power Equipment Market In Mobile Equipment Revenue Million Forecast, by Country 2020 & 2033
- Table 18: Global Fluid Power Equipment Market In Mobile Equipment Volume Billion Forecast, by Country 2020 & 2033
- Table 19: Global Fluid Power Equipment Market In Mobile Equipment Revenue Million Forecast, by Product Type 2020 & 2033
- Table 20: Global Fluid Power Equipment Market In Mobile Equipment Volume Billion Forecast, by Product Type 2020 & 2033
- Table 21: Global Fluid Power Equipment Market In Mobile Equipment Revenue Million Forecast, by End-user Vertical 2020 & 2033
- Table 22: Global Fluid Power Equipment Market In Mobile Equipment Volume Billion Forecast, by End-user Vertical 2020 & 2033
- Table 23: Global Fluid Power Equipment Market In Mobile Equipment Revenue Million Forecast, by Country 2020 & 2033
- Table 24: Global Fluid Power Equipment Market In Mobile Equipment Volume Billion Forecast, by Country 2020 & 2033
- Table 25: Global Fluid Power Equipment Market In Mobile Equipment Revenue Million Forecast, by Product Type 2020 & 2033
- Table 26: Global Fluid Power Equipment Market In Mobile Equipment Volume Billion Forecast, by Product Type 2020 & 2033
- Table 27: Global Fluid Power Equipment Market In Mobile Equipment Revenue Million Forecast, by End-user Vertical 2020 & 2033
- Table 28: Global Fluid Power Equipment Market In Mobile Equipment Volume Billion Forecast, by End-user Vertical 2020 & 2033
- Table 29: Global Fluid Power Equipment Market In Mobile Equipment Revenue Million Forecast, by Country 2020 & 2033
- Table 30: Global Fluid Power Equipment Market In Mobile Equipment Volume Billion Forecast, by Country 2020 & 2033
- Table 31: Global Fluid Power Equipment Market In Mobile Equipment Revenue Million Forecast, by Product Type 2020 & 2033
- Table 32: Global Fluid Power Equipment Market In Mobile Equipment Volume Billion Forecast, by Product Type 2020 & 2033
- Table 33: Global Fluid Power Equipment Market In Mobile Equipment Revenue Million Forecast, by End-user Vertical 2020 & 2033
- Table 34: Global Fluid Power Equipment Market In Mobile Equipment Volume Billion Forecast, by End-user Vertical 2020 & 2033
- Table 35: Global Fluid Power Equipment Market In Mobile Equipment Revenue Million Forecast, by Country 2020 & 2033
- Table 36: Global Fluid Power Equipment Market In Mobile Equipment Volume Billion Forecast, by Country 2020 & 2033
- Table 37: Global Fluid Power Equipment Market In Mobile Equipment Revenue Million Forecast, by Product Type 2020 & 2033
- Table 38: Global Fluid Power Equipment Market In Mobile Equipment Volume Billion Forecast, by Product Type 2020 & 2033
- Table 39: Global Fluid Power Equipment Market In Mobile Equipment Revenue Million Forecast, by End-user Vertical 2020 & 2033
- Table 40: Global Fluid Power Equipment Market In Mobile Equipment Volume Billion Forecast, by End-user Vertical 2020 & 2033
- Table 41: Global Fluid Power Equipment Market In Mobile Equipment Revenue Million Forecast, by Country 2020 & 2033
- Table 42: Global Fluid Power Equipment Market In Mobile Equipment Volume Billion Forecast, by Country 2020 & 2033
Frequently Asked Questions
1. What is the projected Compound Annual Growth Rate (CAGR) of the Fluid Power Equipment Market In Mobile Equipment?
The projected CAGR is approximately 6.60%.
2. Which companies are prominent players in the Fluid Power Equipment Market In Mobile Equipment?
Key companies in the market include Kawasaki Precision Machinery, Bosch-Rexroth AG, Parker Hannifin Corporation, Danfoss AS, Eaton Corporation, Hydac International GmbH, HydraForce Inc, Festo Corporation, SMC Corporation*List Not Exhaustive 7 2 Vendor Ranking Analysi.
3. What are the main segments of the Fluid Power Equipment Market In Mobile Equipment?
The market segments include Product Type, End-user Vertical.
4. Can you provide details about the market size?
The market size is estimated to be USD 28.91 Million as of 2022.
5. What are some drivers contributing to market growth?
Growing Construction and Infrastructure Development; Growing Need for Increased Efficiency and Productivity; Increasing Advancements in Technology.
6. What are the notable trends driving market growth?
The Construction Segment is Expected to Drive the Market's Growth.
7. Are there any restraints impacting market growth?
Growing Construction and Infrastructure Development; Growing Need for Increased Efficiency and Productivity; Increasing Advancements in Technology.
8. Can you provide examples of recent developments in the market?
February 2024: Power management company Eaton announced that its Mobility Group is expanding its mobile power products portfolio with the introduction of the Bezares 3960, 2500, and 500 series power takeoff (PTO) units, as well as APSCO APV and APG series directional hydraulic control valves. The new offerings are expected to be introduced at the Work Truck Show, March 5-8 in Indianapolis.July 2023: Bosch Rexroth opened a new plant in Querétaro, Mexico, with a vision to create more manufacturing capacity for mobile hydraulics and factory automation in North America and shorten delivery routes for customers in the region. The company claimed that it is investing about EUR 160 million in the new location and would create about 900 jobs by 2027. At its 42,000-square-meter, or 452,000-square-foot, plant in Querétaro, the company began manufacturing hydraulic pumps, motors, and valves for mobile machinery, like excavators, forklifts, and tractors, in June 2023.
9. What pricing options are available for accessing the report?
Pricing options include single-user, multi-user, and enterprise licenses priced at USD 4750, USD 5250, and USD 8750 respectively.
10. Is the market size provided in terms of value or volume?
The market size is provided in terms of value, measured in Million and volume, measured in Billion.
11. Are there any specific market keywords associated with the report?
Yes, the market keyword associated with the report is "Fluid Power Equipment Market In Mobile Equipment," which aids in identifying and referencing the specific market segment covered.
12. How do I determine which pricing option suits my needs best?
The pricing options vary based on user requirements and access needs. Individual users may opt for single-user licenses, while businesses requiring broader access may choose multi-user or enterprise licenses for cost-effective access to the report.
13. Are there any additional resources or data provided in the Fluid Power Equipment Market In Mobile Equipment report?
While the report offers comprehensive insights, it's advisable to review the specific contents or supplementary materials provided to ascertain if additional resources or data are available.
14. How can I stay updated on further developments or reports in the Fluid Power Equipment Market In Mobile Equipment?
To stay informed about further developments, trends, and reports in the Fluid Power Equipment Market In Mobile Equipment, consider subscribing to industry newsletters, following relevant companies and organizations, or regularly checking reputable industry news sources and publications.
Methodology
Step 1 - Identification of Relevant Samples Size from Population Database


Step 2 - Approaches for Defining Global Market Size (Value, Volume* & Price*)

Note*: In applicable scenarios
Step 3 - Data Sources
Primary Research
- Web Analytics
- Survey Reports
- Research Institute
- Latest Research Reports
- Opinion Leaders
Secondary Research
- Annual Reports
- White Paper
- Latest Press Release
- Industry Association
- Paid Database
- Investor Presentations

Step 4 - Data Triangulation
Involves using different sources of information in order to increase the validity of a study
These sources are likely to be stakeholders in a program - participants, other researchers, program staff, other community members, and so on.
Then we put all data in single framework & apply various statistical tools to find out the dynamic on the market.
During the analysis stage, feedback from the stakeholder groups would be compared to determine areas of agreement as well as areas of divergence

