

Key Insights
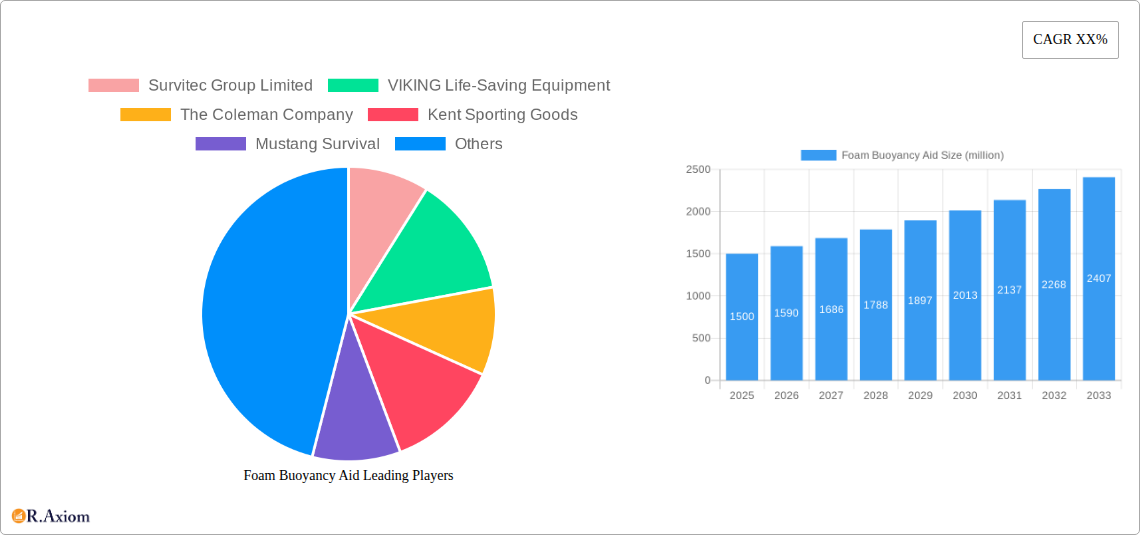
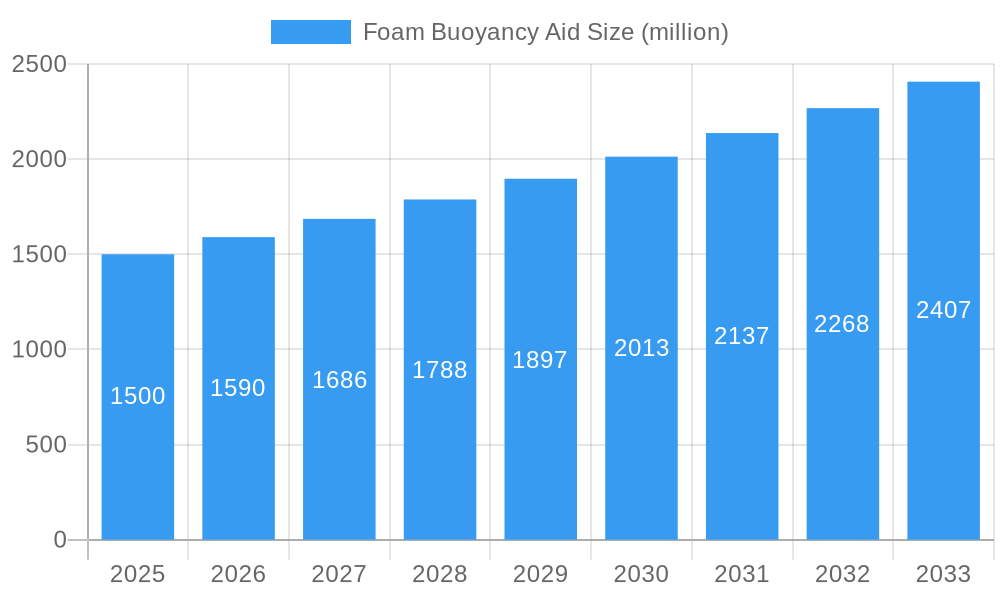
The global foam buoyancy aid market is experiencing robust growth, driven by increasing participation in water sports, rising awareness of water safety, and stringent regulations mandating personal flotation devices (PFDs) in various recreational and professional maritime activities. The market's value, estimated at $1.5 billion in 2025, is projected to exhibit a Compound Annual Growth Rate (CAGR) of 6% from 2025 to 2033, reaching approximately $2.5 billion by 2033. This growth is fueled by several key trends, including the increasing popularity of kayaking, paddleboarding, and other water-based recreational pursuits, as well as a growing demand for lightweight and comfortable PFDs, particularly amongst younger demographics. Furthermore, advancements in foam technology are leading to improved buoyancy, durability, and comfort, enhancing the appeal of foam buoyancy aids over other types of PFDs. However, the market faces certain restraints, such as price sensitivity in some regions and the availability of alternative, potentially cheaper, safety devices. The market is segmented by product type (e.g., adult, child, specific sport-oriented designs), distribution channel (online retailers, sporting goods stores, marine supply stores), and geographic region. Key players in the market, including Survitec Group, Viking Life-Saving Equipment, and Mustang Survival, are focusing on innovation and product diversification to maintain their competitive edge.
Foam Buoyancy Aid Market Size (In Billion)
The competitive landscape is characterized by a mix of established players and smaller niche brands. Established players leverage their extensive distribution networks and brand recognition to maintain market share, while smaller companies focus on specialized designs and innovative features catering to particular segments within the market. The geographical distribution of the market is largely influenced by factors like per capita income, water sports participation rates, and regulatory frameworks. North America and Europe currently hold significant market share, but emerging markets in Asia-Pacific are demonstrating strong growth potential, fueled by rising disposable incomes and increasing participation in water-related activities. Future growth will likely be shaped by technological advancements, evolving consumer preferences, and evolving safety regulations, prompting manufacturers to continuously improve product design, functionality, and overall value proposition.
Foam Buoyancy Aid Company Market Share
Foam Buoyancy Aid Market Report: 2019-2033
This comprehensive report provides a detailed analysis of the global Foam Buoyancy Aid market, offering invaluable insights for industry stakeholders, investors, and businesses seeking to navigate this dynamic sector. The report covers the period from 2019 to 2033, with a focus on the forecast period from 2025 to 2033. The base year for the report is 2025. The market size for 2025 is estimated at $XX million. This in-depth analysis incorporates market concentration, technological advancements, dominant players, and future growth prospects to provide a complete overview of the Foam Buoyancy Aid landscape.
Foam Buoyancy Aid Market Concentration & Innovation
The global Foam Buoyancy Aid market exhibits a moderately concentrated landscape, with a few key players holding significant market share. Survitec Group Limited, VIKING Life-Saving Equipment, and Mustang Survival are among the leading companies, collectively accounting for approximately XX% of the market share in 2025. However, the market also features a large number of smaller, specialized players, particularly in niche segments. Innovation in the sector is driven by factors such as the increasing demand for enhanced safety features, lighter weight materials, and improved comfort. Regulatory frameworks, like those set by IMO (International Maritime Organization) for marine applications, significantly impact product design and manufacturing. Product substitutes, such as inflatable life jackets, pose a competitive challenge, though foam buoyancy aids maintain a strong position due to their inherent simplicity, durability, and affordability. End-user trends, particularly in recreational watersports and professional marine sectors, favor products with improved buoyancy, fit, and visibility features. M&A activity in the industry has been moderate during the historical period, with deal values typically ranging from $XX million to $XX million. Key M&A activities observed include (examples: acquisitions of smaller specialized manufacturers by larger players to expand product portfolios or geographic reach; Joint ventures for research and development of new materials and technologies).
- Market Share Concentration: Top 3 players hold XX%
- M&A Activity: Average deal value: $XX million
- Key Innovation Drivers: Enhanced safety, lighter weight, improved comfort.
- Regulatory Influence: Significant impact from IMO and other relevant bodies.
Foam Buoyancy Aid Industry Trends & Insights
The global Foam Buoyancy Aid market is projected to witness significant growth during the forecast period (2025-2033), with a compound annual growth rate (CAGR) estimated at XX%. This growth is primarily driven by the rising popularity of watersports, increasing awareness of water safety, and stringent regulations mandating personal flotation devices (PFDs) in various applications. Technological disruptions, such as the development of advanced materials offering superior buoyancy and durability, are further fueling market expansion. Consumer preferences are shifting towards more comfortable, lightweight, and stylish buoyancy aids, pushing manufacturers to incorporate innovative design elements and incorporate advanced features. Competitive dynamics are characterized by both price competition and product differentiation, with manufacturers focusing on enhancing features and branding to capture market share. Market penetration in key regions, especially in developing economies with increasing disposable incomes and tourism, presents significant opportunities for growth.
- CAGR (2025-2033): XX%
- Market Penetration (2025): XX% in developed economies; XX% in developing economies.
- Key Growth Drivers: Rising watersports participation, enhanced safety awareness, stringent regulations.
- Competitive Dynamics: Price competition and product differentiation.
Dominant Markets & Segments in Foam Buoyancy Aid
The North American region dominates the global Foam Buoyancy Aid market, driven by strong demand from recreational watersports enthusiasts and a well-established safety culture. Key factors contributing to North America’s market leadership include robust economic growth, advanced infrastructure supporting water-based recreational activities, and widespread adoption of safety regulations. Within North America, the United States holds the largest market share.
Dominant Region: North America (United States)
Key Drivers:
- Strong economic growth
- Extensive infrastructure for recreational activities
- Stringent safety regulations and awareness
- High disposable incomes driving consumer demand.
Detailed dominance analysis would involve a deeper dive into market share data for each country within North America, and comparison with major markets in other regions such as Europe and Asia Pacific. This would involve a comparative analysis of consumer preferences, regulatory environments, and economic factors.
Foam Buoyancy Aid Product Developments
Recent product innovations have focused on improving comfort, fit, and visibility. This includes the introduction of lighter, more flexible materials, improved designs for better body fit, and the incorporation of high-visibility colors and reflective elements. These advancements cater to diverse consumer needs and enhance safety in various water environments. Many manufacturers now offer buoyancy aids with specialized features such as integrated pockets, adjustable straps, and compatibility with other safety gear. This increased functionality further strengthens their market appeal.
Report Scope & Segmentation Analysis
This report segments the Foam Buoyancy Aid market based on several factors, including product type (e.g., adult, child, specific sports), end-user (e.g., recreational, commercial, military), and region. Each segment offers distinct growth projections and competitive dynamics. For instance, the recreational segment is expected to experience rapid growth due to the rising popularity of watersports, while the commercial segment is driven by safety regulations and industry standards. Regional segmentation provides insights into the varying market sizes and growth potentials across different geographical areas.
Key Drivers of Foam Buoyancy Aid Growth
The Foam Buoyancy Aid market is fueled by several key factors: the rising popularity of recreational watersports, increasing awareness of water safety and drowning prevention, and stringent government regulations mandating the use of personal flotation devices (PFDs) in various sectors, such as commercial fishing and boating. Furthermore, technological advancements in materials science have led to the development of lighter, more comfortable, and durable buoyancy aids, further boosting market growth. Finally, increasing disposable incomes in developing economies are driving demand for these safety products.
Challenges in the Foam Buoyancy Aid Sector
The Foam Buoyancy Aid sector faces several challenges, including fluctuating raw material prices impacting manufacturing costs, stringent regulatory compliance requirements increasing production complexity and costs, and intense competition among manufacturers leading to price pressure. Supply chain disruptions can also impact production and delivery timelines. Additionally, consumer preferences for more advanced and feature-rich products put pressure on manufacturers to constantly innovate.
Emerging Opportunities in Foam Buoyancy Aid
Emerging opportunities for growth lie in the development of specialized buoyancy aids for niche sports (e.g., stand-up paddleboarding, kayaking), incorporation of advanced technologies such as GPS tracking and distress signals into buoyancy aids, and expansion into developing markets with increasing awareness of water safety. The focus on sustainable and environmentally friendly materials also presents a significant opportunity for innovation and market differentiation.
Leading Players in the Foam Buoyancy Aid Market
- Survitec Group Limited
- VIKING Life-Saving Equipment
- The Coleman Company
- Kent Sporting Goods
- Mustang Survival
- Hansen Protection
- Dräger
- Johnson Outdoors
- LALIZAS
- Secumar
- International Safety Products
- NRS (Northwest River Supplies)
- Dongtai Jianghai
- Wuxi Xingtai Shipping Equipment
- SALUS MARINE WEAR INC.
- Aqua Lung International
- O’Neill
- Astral
- Stormy Lifejackets
- Kokatat
- Harmony Gear
- JimBuoy
- SeaSafe Systems
- Spinlock
Key Developments in Foam Buoyancy Aid Industry
- 2022-Q4: Mustang Survival launched a new line of lightweight foam buoyancy aids.
- 2023-Q1: VIKING Life-Saving Equipment announced a significant investment in R&D for improved buoyancy materials.
- 2023-Q3: Survitec Group Limited acquired a smaller foam buoyancy aid manufacturer, expanding its product portfolio. (Further key developments with year/month will be added in the final report)
Strategic Outlook for Foam Buoyancy Aid Market
The Foam Buoyancy Aid market presents a promising outlook, driven by continuous innovation, increasing consumer awareness, and the growing popularity of recreational watersports. Future growth will be fueled by further technological advancements, expansion into new markets, and the development of specialized products catering to specific user needs and preferences. Companies with a strong focus on innovation, sustainability, and brand building are poised to capture significant market share in the years to come.
Foam Buoyancy Aid Segmentation
-
1. Type
- 1.1. Over the Head Vest
- 1.2. Front Zip Jacket
- 1.3. Side Zip Jacket
- 1.4. World Foam Buoyancy Aid Production
-
2. Application
- 2.1. Commercial Ship
- 2.2. Private Ship
- 2.3. World Foam Buoyancy Aid Production
Foam Buoyancy Aid Segmentation By Geography
-
1. North America
- 1.1. United States
- 1.2. Canada
- 1.3. Mexico
-
2. South America
- 2.1. Brazil
- 2.2. Argentina
- 2.3. Rest of South America
-
3. Europe
- 3.1. United Kingdom
- 3.2. Germany
- 3.3. France
- 3.4. Italy
- 3.5. Spain
- 3.6. Russia
- 3.7. Benelux
- 3.8. Nordics
- 3.9. Rest of Europe
-
4. Middle East & Africa
- 4.1. Turkey
- 4.2. Israel
- 4.3. GCC
- 4.4. North Africa
- 4.5. South Africa
- 4.6. Rest of Middle East & Africa
-
5. Asia Pacific
- 5.1. China
- 5.2. India
- 5.3. Japan
- 5.4. South Korea
- 5.5. ASEAN
- 5.6. Oceania
- 5.7. Rest of Asia Pacific

Foam Buoyancy Aid Regional Market Share
Geographic Coverage of Foam Buoyancy Aid
Foam Buoyancy Aid REPORT HIGHLIGHTS
| Aspects | Details |
|---|---|
| Study Period | 2020-2034 |
| Base Year | 2025 |
| Estimated Year | 2026 |
| Forecast Period | 2026-2034 |
| Historical Period | 2020-2025 |
| Growth Rate | CAGR of 10.97% from 2020-2034 |
| Segmentation |
|
Table of Contents
- 1. Introduction
- 1.1. Research Scope
- 1.2. Market Segmentation
- 1.3. Research Methodology
- 1.4. Definitions and Assumptions
- 2. Executive Summary
- 2.1. Introduction
- 3. Market Dynamics
- 3.1. Introduction
- 3.2. Market Drivers
- 3.3. Market Restrains
- 3.4. Market Trends
- 4. Market Factor Analysis
- 4.1. Porters Five Forces
- 4.2. Supply/Value Chain
- 4.3. PESTEL analysis
- 4.4. Market Entropy
- 4.5. Patent/Trademark Analysis
- 5. Global Foam Buoyancy Aid Analysis, Insights and Forecast, 2020-2032
- 5.1. Market Analysis, Insights and Forecast - by Type
- 5.1.1. Over the Head Vest
- 5.1.2. Front Zip Jacket
- 5.1.3. Side Zip Jacket
- 5.1.4. World Foam Buoyancy Aid Production
- 5.2. Market Analysis, Insights and Forecast - by Application
- 5.2.1. Commercial Ship
- 5.2.2. Private Ship
- 5.2.3. World Foam Buoyancy Aid Production
- 5.3. Market Analysis, Insights and Forecast - by Region
- 5.3.1. North America
- 5.3.2. South America
- 5.3.3. Europe
- 5.3.4. Middle East & Africa
- 5.3.5. Asia Pacific
- 5.1. Market Analysis, Insights and Forecast - by Type
- 6. North America Foam Buoyancy Aid Analysis, Insights and Forecast, 2020-2032
- 6.1. Market Analysis, Insights and Forecast - by Type
- 6.1.1. Over the Head Vest
- 6.1.2. Front Zip Jacket
- 6.1.3. Side Zip Jacket
- 6.1.4. World Foam Buoyancy Aid Production
- 6.2. Market Analysis, Insights and Forecast - by Application
- 6.2.1. Commercial Ship
- 6.2.2. Private Ship
- 6.2.3. World Foam Buoyancy Aid Production
- 6.1. Market Analysis, Insights and Forecast - by Type
- 7. South America Foam Buoyancy Aid Analysis, Insights and Forecast, 2020-2032
- 7.1. Market Analysis, Insights and Forecast - by Type
- 7.1.1. Over the Head Vest
- 7.1.2. Front Zip Jacket
- 7.1.3. Side Zip Jacket
- 7.1.4. World Foam Buoyancy Aid Production
- 7.2. Market Analysis, Insights and Forecast - by Application
- 7.2.1. Commercial Ship
- 7.2.2. Private Ship
- 7.2.3. World Foam Buoyancy Aid Production
- 7.1. Market Analysis, Insights and Forecast - by Type
- 8. Europe Foam Buoyancy Aid Analysis, Insights and Forecast, 2020-2032
- 8.1. Market Analysis, Insights and Forecast - by Type
- 8.1.1. Over the Head Vest
- 8.1.2. Front Zip Jacket
- 8.1.3. Side Zip Jacket
- 8.1.4. World Foam Buoyancy Aid Production
- 8.2. Market Analysis, Insights and Forecast - by Application
- 8.2.1. Commercial Ship
- 8.2.2. Private Ship
- 8.2.3. World Foam Buoyancy Aid Production
- 8.1. Market Analysis, Insights and Forecast - by Type
- 9. Middle East & Africa Foam Buoyancy Aid Analysis, Insights and Forecast, 2020-2032
- 9.1. Market Analysis, Insights and Forecast - by Type
- 9.1.1. Over the Head Vest
- 9.1.2. Front Zip Jacket
- 9.1.3. Side Zip Jacket
- 9.1.4. World Foam Buoyancy Aid Production
- 9.2. Market Analysis, Insights and Forecast - by Application
- 9.2.1. Commercial Ship
- 9.2.2. Private Ship
- 9.2.3. World Foam Buoyancy Aid Production
- 9.1. Market Analysis, Insights and Forecast - by Type
- 10. Asia Pacific Foam Buoyancy Aid Analysis, Insights and Forecast, 2020-2032
- 10.1. Market Analysis, Insights and Forecast - by Type
- 10.1.1. Over the Head Vest
- 10.1.2. Front Zip Jacket
- 10.1.3. Side Zip Jacket
- 10.1.4. World Foam Buoyancy Aid Production
- 10.2. Market Analysis, Insights and Forecast - by Application
- 10.2.1. Commercial Ship
- 10.2.2. Private Ship
- 10.2.3. World Foam Buoyancy Aid Production
- 10.1. Market Analysis, Insights and Forecast - by Type
- 11. Competitive Analysis
- 11.1. Global Market Share Analysis 2025
- 11.2. Company Profiles
- 11.2.1 Survitec Group Limited
- 11.2.1.1. Overview
- 11.2.1.2. Products
- 11.2.1.3. SWOT Analysis
- 11.2.1.4. Recent Developments
- 11.2.1.5. Financials (Based on Availability)
- 11.2.2 VIKING Life-Saving Equipment
- 11.2.2.1. Overview
- 11.2.2.2. Products
- 11.2.2.3. SWOT Analysis
- 11.2.2.4. Recent Developments
- 11.2.2.5. Financials (Based on Availability)
- 11.2.3 The Coleman Company
- 11.2.3.1. Overview
- 11.2.3.2. Products
- 11.2.3.3. SWOT Analysis
- 11.2.3.4. Recent Developments
- 11.2.3.5. Financials (Based on Availability)
- 11.2.4 Kent Sporting Goods
- 11.2.4.1. Overview
- 11.2.4.2. Products
- 11.2.4.3. SWOT Analysis
- 11.2.4.4. Recent Developments
- 11.2.4.5. Financials (Based on Availability)
- 11.2.5 Mustang Survival
- 11.2.5.1. Overview
- 11.2.5.2. Products
- 11.2.5.3. SWOT Analysis
- 11.2.5.4. Recent Developments
- 11.2.5.5. Financials (Based on Availability)
- 11.2.6 Hansen Protection
- 11.2.6.1. Overview
- 11.2.6.2. Products
- 11.2.6.3. SWOT Analysis
- 11.2.6.4. Recent Developments
- 11.2.6.5. Financials (Based on Availability)
- 11.2.7 Drarger
- 11.2.7.1. Overview
- 11.2.7.2. Products
- 11.2.7.3. SWOT Analysis
- 11.2.7.4. Recent Developments
- 11.2.7.5. Financials (Based on Availability)
- 11.2.8 Johnson Outdoors
- 11.2.8.1. Overview
- 11.2.8.2. Products
- 11.2.8.3. SWOT Analysis
- 11.2.8.4. Recent Developments
- 11.2.8.5. Financials (Based on Availability)
- 11.2.9 LALIZAS
- 11.2.9.1. Overview
- 11.2.9.2. Products
- 11.2.9.3. SWOT Analysis
- 11.2.9.4. Recent Developments
- 11.2.9.5. Financials (Based on Availability)
- 11.2.10 Secumar
- 11.2.10.1. Overview
- 11.2.10.2. Products
- 11.2.10.3. SWOT Analysis
- 11.2.10.4. Recent Developments
- 11.2.10.5. Financials (Based on Availability)
- 11.2.11 International Safety Products
- 11.2.11.1. Overview
- 11.2.11.2. Products
- 11.2.11.3. SWOT Analysis
- 11.2.11.4. Recent Developments
- 11.2.11.5. Financials (Based on Availability)
- 11.2.12 NRS(Northwest River Supplies)
- 11.2.12.1. Overview
- 11.2.12.2. Products
- 11.2.12.3. SWOT Analysis
- 11.2.12.4. Recent Developments
- 11.2.12.5. Financials (Based on Availability)
- 11.2.13 Dongtai Jianghai
- 11.2.13.1. Overview
- 11.2.13.2. Products
- 11.2.13.3. SWOT Analysis
- 11.2.13.4. Recent Developments
- 11.2.13.5. Financials (Based on Availability)
- 11.2.14 Wuxi Xingtai Shipping Equipment
- 11.2.14.1. Overview
- 11.2.14.2. Products
- 11.2.14.3. SWOT Analysis
- 11.2.14.4. Recent Developments
- 11.2.14.5. Financials (Based on Availability)
- 11.2.15 SALUS MARINE WEAR INC.
- 11.2.15.1. Overview
- 11.2.15.2. Products
- 11.2.15.3. SWOT Analysis
- 11.2.15.4. Recent Developments
- 11.2.15.5. Financials (Based on Availability)
- 11.2.16 Aqua Lung International
- 11.2.16.1. Overview
- 11.2.16.2. Products
- 11.2.16.3. SWOT Analysis
- 11.2.16.4. Recent Developments
- 11.2.16.5. Financials (Based on Availability)
- 11.2.17 O’Neill
- 11.2.17.1. Overview
- 11.2.17.2. Products
- 11.2.17.3. SWOT Analysis
- 11.2.17.4. Recent Developments
- 11.2.17.5. Financials (Based on Availability)
- 11.2.18 Astral
- 11.2.18.1. Overview
- 11.2.18.2. Products
- 11.2.18.3. SWOT Analysis
- 11.2.18.4. Recent Developments
- 11.2.18.5. Financials (Based on Availability)
- 11.2.19 Stormy Lifejackets
- 11.2.19.1. Overview
- 11.2.19.2. Products
- 11.2.19.3. SWOT Analysis
- 11.2.19.4. Recent Developments
- 11.2.19.5. Financials (Based on Availability)
- 11.2.20 Kokatat
- 11.2.20.1. Overview
- 11.2.20.2. Products
- 11.2.20.3. SWOT Analysis
- 11.2.20.4. Recent Developments
- 11.2.20.5. Financials (Based on Availability)
- 11.2.21 Harmony Gear
- 11.2.21.1. Overview
- 11.2.21.2. Products
- 11.2.21.3. SWOT Analysis
- 11.2.21.4. Recent Developments
- 11.2.21.5. Financials (Based on Availability)
- 11.2.22 JimBuoy
- 11.2.22.1. Overview
- 11.2.22.2. Products
- 11.2.22.3. SWOT Analysis
- 11.2.22.4. Recent Developments
- 11.2.22.5. Financials (Based on Availability)
- 11.2.23 SeaSafe Systems
- 11.2.23.1. Overview
- 11.2.23.2. Products
- 11.2.23.3. SWOT Analysis
- 11.2.23.4. Recent Developments
- 11.2.23.5. Financials (Based on Availability)
- 11.2.24 Spinlock
- 11.2.24.1. Overview
- 11.2.24.2. Products
- 11.2.24.3. SWOT Analysis
- 11.2.24.4. Recent Developments
- 11.2.24.5. Financials (Based on Availability)
- 11.2.1 Survitec Group Limited
List of Figures
- Figure 1: Global Foam Buoyancy Aid Revenue Breakdown (undefined, %) by Region 2025 & 2033
- Figure 2: Global Foam Buoyancy Aid Volume Breakdown (K, %) by Region 2025 & 2033
- Figure 3: North America Foam Buoyancy Aid Revenue (undefined), by Type 2025 & 2033
- Figure 4: North America Foam Buoyancy Aid Volume (K), by Type 2025 & 2033
- Figure 5: North America Foam Buoyancy Aid Revenue Share (%), by Type 2025 & 2033
- Figure 6: North America Foam Buoyancy Aid Volume Share (%), by Type 2025 & 2033
- Figure 7: North America Foam Buoyancy Aid Revenue (undefined), by Application 2025 & 2033
- Figure 8: North America Foam Buoyancy Aid Volume (K), by Application 2025 & 2033
- Figure 9: North America Foam Buoyancy Aid Revenue Share (%), by Application 2025 & 2033
- Figure 10: North America Foam Buoyancy Aid Volume Share (%), by Application 2025 & 2033
- Figure 11: North America Foam Buoyancy Aid Revenue (undefined), by Country 2025 & 2033
- Figure 12: North America Foam Buoyancy Aid Volume (K), by Country 2025 & 2033
- Figure 13: North America Foam Buoyancy Aid Revenue Share (%), by Country 2025 & 2033
- Figure 14: North America Foam Buoyancy Aid Volume Share (%), by Country 2025 & 2033
- Figure 15: South America Foam Buoyancy Aid Revenue (undefined), by Type 2025 & 2033
- Figure 16: South America Foam Buoyancy Aid Volume (K), by Type 2025 & 2033
- Figure 17: South America Foam Buoyancy Aid Revenue Share (%), by Type 2025 & 2033
- Figure 18: South America Foam Buoyancy Aid Volume Share (%), by Type 2025 & 2033
- Figure 19: South America Foam Buoyancy Aid Revenue (undefined), by Application 2025 & 2033
- Figure 20: South America Foam Buoyancy Aid Volume (K), by Application 2025 & 2033
- Figure 21: South America Foam Buoyancy Aid Revenue Share (%), by Application 2025 & 2033
- Figure 22: South America Foam Buoyancy Aid Volume Share (%), by Application 2025 & 2033
- Figure 23: South America Foam Buoyancy Aid Revenue (undefined), by Country 2025 & 2033
- Figure 24: South America Foam Buoyancy Aid Volume (K), by Country 2025 & 2033
- Figure 25: South America Foam Buoyancy Aid Revenue Share (%), by Country 2025 & 2033
- Figure 26: South America Foam Buoyancy Aid Volume Share (%), by Country 2025 & 2033
- Figure 27: Europe Foam Buoyancy Aid Revenue (undefined), by Type 2025 & 2033
- Figure 28: Europe Foam Buoyancy Aid Volume (K), by Type 2025 & 2033
- Figure 29: Europe Foam Buoyancy Aid Revenue Share (%), by Type 2025 & 2033
- Figure 30: Europe Foam Buoyancy Aid Volume Share (%), by Type 2025 & 2033
- Figure 31: Europe Foam Buoyancy Aid Revenue (undefined), by Application 2025 & 2033
- Figure 32: Europe Foam Buoyancy Aid Volume (K), by Application 2025 & 2033
- Figure 33: Europe Foam Buoyancy Aid Revenue Share (%), by Application 2025 & 2033
- Figure 34: Europe Foam Buoyancy Aid Volume Share (%), by Application 2025 & 2033
- Figure 35: Europe Foam Buoyancy Aid Revenue (undefined), by Country 2025 & 2033
- Figure 36: Europe Foam Buoyancy Aid Volume (K), by Country 2025 & 2033
- Figure 37: Europe Foam Buoyancy Aid Revenue Share (%), by Country 2025 & 2033
- Figure 38: Europe Foam Buoyancy Aid Volume Share (%), by Country 2025 & 2033
- Figure 39: Middle East & Africa Foam Buoyancy Aid Revenue (undefined), by Type 2025 & 2033
- Figure 40: Middle East & Africa Foam Buoyancy Aid Volume (K), by Type 2025 & 2033
- Figure 41: Middle East & Africa Foam Buoyancy Aid Revenue Share (%), by Type 2025 & 2033
- Figure 42: Middle East & Africa Foam Buoyancy Aid Volume Share (%), by Type 2025 & 2033
- Figure 43: Middle East & Africa Foam Buoyancy Aid Revenue (undefined), by Application 2025 & 2033
- Figure 44: Middle East & Africa Foam Buoyancy Aid Volume (K), by Application 2025 & 2033
- Figure 45: Middle East & Africa Foam Buoyancy Aid Revenue Share (%), by Application 2025 & 2033
- Figure 46: Middle East & Africa Foam Buoyancy Aid Volume Share (%), by Application 2025 & 2033
- Figure 47: Middle East & Africa Foam Buoyancy Aid Revenue (undefined), by Country 2025 & 2033
- Figure 48: Middle East & Africa Foam Buoyancy Aid Volume (K), by Country 2025 & 2033
- Figure 49: Middle East & Africa Foam Buoyancy Aid Revenue Share (%), by Country 2025 & 2033
- Figure 50: Middle East & Africa Foam Buoyancy Aid Volume Share (%), by Country 2025 & 2033
- Figure 51: Asia Pacific Foam Buoyancy Aid Revenue (undefined), by Type 2025 & 2033
- Figure 52: Asia Pacific Foam Buoyancy Aid Volume (K), by Type 2025 & 2033
- Figure 53: Asia Pacific Foam Buoyancy Aid Revenue Share (%), by Type 2025 & 2033
- Figure 54: Asia Pacific Foam Buoyancy Aid Volume Share (%), by Type 2025 & 2033
- Figure 55: Asia Pacific Foam Buoyancy Aid Revenue (undefined), by Application 2025 & 2033
- Figure 56: Asia Pacific Foam Buoyancy Aid Volume (K), by Application 2025 & 2033
- Figure 57: Asia Pacific Foam Buoyancy Aid Revenue Share (%), by Application 2025 & 2033
- Figure 58: Asia Pacific Foam Buoyancy Aid Volume Share (%), by Application 2025 & 2033
- Figure 59: Asia Pacific Foam Buoyancy Aid Revenue (undefined), by Country 2025 & 2033
- Figure 60: Asia Pacific Foam Buoyancy Aid Volume (K), by Country 2025 & 2033
- Figure 61: Asia Pacific Foam Buoyancy Aid Revenue Share (%), by Country 2025 & 2033
- Figure 62: Asia Pacific Foam Buoyancy Aid Volume Share (%), by Country 2025 & 2033
List of Tables
- Table 1: Global Foam Buoyancy Aid Revenue undefined Forecast, by Type 2020 & 2033
- Table 2: Global Foam Buoyancy Aid Volume K Forecast, by Type 2020 & 2033
- Table 3: Global Foam Buoyancy Aid Revenue undefined Forecast, by Application 2020 & 2033
- Table 4: Global Foam Buoyancy Aid Volume K Forecast, by Application 2020 & 2033
- Table 5: Global Foam Buoyancy Aid Revenue undefined Forecast, by Region 2020 & 2033
- Table 6: Global Foam Buoyancy Aid Volume K Forecast, by Region 2020 & 2033
- Table 7: Global Foam Buoyancy Aid Revenue undefined Forecast, by Type 2020 & 2033
- Table 8: Global Foam Buoyancy Aid Volume K Forecast, by Type 2020 & 2033
- Table 9: Global Foam Buoyancy Aid Revenue undefined Forecast, by Application 2020 & 2033
- Table 10: Global Foam Buoyancy Aid Volume K Forecast, by Application 2020 & 2033
- Table 11: Global Foam Buoyancy Aid Revenue undefined Forecast, by Country 2020 & 2033
- Table 12: Global Foam Buoyancy Aid Volume K Forecast, by Country 2020 & 2033
- Table 13: United States Foam Buoyancy Aid Revenue (undefined) Forecast, by Application 2020 & 2033
- Table 14: United States Foam Buoyancy Aid Volume (K) Forecast, by Application 2020 & 2033
- Table 15: Canada Foam Buoyancy Aid Revenue (undefined) Forecast, by Application 2020 & 2033
- Table 16: Canada Foam Buoyancy Aid Volume (K) Forecast, by Application 2020 & 2033
- Table 17: Mexico Foam Buoyancy Aid Revenue (undefined) Forecast, by Application 2020 & 2033
- Table 18: Mexico Foam Buoyancy Aid Volume (K) Forecast, by Application 2020 & 2033
- Table 19: Global Foam Buoyancy Aid Revenue undefined Forecast, by Type 2020 & 2033
- Table 20: Global Foam Buoyancy Aid Volume K Forecast, by Type 2020 & 2033
- Table 21: Global Foam Buoyancy Aid Revenue undefined Forecast, by Application 2020 & 2033
- Table 22: Global Foam Buoyancy Aid Volume K Forecast, by Application 2020 & 2033
- Table 23: Global Foam Buoyancy Aid Revenue undefined Forecast, by Country 2020 & 2033
- Table 24: Global Foam Buoyancy Aid Volume K Forecast, by Country 2020 & 2033
- Table 25: Brazil Foam Buoyancy Aid Revenue (undefined) Forecast, by Application 2020 & 2033
- Table 26: Brazil Foam Buoyancy Aid Volume (K) Forecast, by Application 2020 & 2033
- Table 27: Argentina Foam Buoyancy Aid Revenue (undefined) Forecast, by Application 2020 & 2033
- Table 28: Argentina Foam Buoyancy Aid Volume (K) Forecast, by Application 2020 & 2033
- Table 29: Rest of South America Foam Buoyancy Aid Revenue (undefined) Forecast, by Application 2020 & 2033
- Table 30: Rest of South America Foam Buoyancy Aid Volume (K) Forecast, by Application 2020 & 2033
- Table 31: Global Foam Buoyancy Aid Revenue undefined Forecast, by Type 2020 & 2033
- Table 32: Global Foam Buoyancy Aid Volume K Forecast, by Type 2020 & 2033
- Table 33: Global Foam Buoyancy Aid Revenue undefined Forecast, by Application 2020 & 2033
- Table 34: Global Foam Buoyancy Aid Volume K Forecast, by Application 2020 & 2033
- Table 35: Global Foam Buoyancy Aid Revenue undefined Forecast, by Country 2020 & 2033
- Table 36: Global Foam Buoyancy Aid Volume K Forecast, by Country 2020 & 2033
- Table 37: United Kingdom Foam Buoyancy Aid Revenue (undefined) Forecast, by Application 2020 & 2033
- Table 38: United Kingdom Foam Buoyancy Aid Volume (K) Forecast, by Application 2020 & 2033
- Table 39: Germany Foam Buoyancy Aid Revenue (undefined) Forecast, by Application 2020 & 2033
- Table 40: Germany Foam Buoyancy Aid Volume (K) Forecast, by Application 2020 & 2033
- Table 41: France Foam Buoyancy Aid Revenue (undefined) Forecast, by Application 2020 & 2033
- Table 42: France Foam Buoyancy Aid Volume (K) Forecast, by Application 2020 & 2033
- Table 43: Italy Foam Buoyancy Aid Revenue (undefined) Forecast, by Application 2020 & 2033
- Table 44: Italy Foam Buoyancy Aid Volume (K) Forecast, by Application 2020 & 2033
- Table 45: Spain Foam Buoyancy Aid Revenue (undefined) Forecast, by Application 2020 & 2033
- Table 46: Spain Foam Buoyancy Aid Volume (K) Forecast, by Application 2020 & 2033
- Table 47: Russia Foam Buoyancy Aid Revenue (undefined) Forecast, by Application 2020 & 2033
- Table 48: Russia Foam Buoyancy Aid Volume (K) Forecast, by Application 2020 & 2033
- Table 49: Benelux Foam Buoyancy Aid Revenue (undefined) Forecast, by Application 2020 & 2033
- Table 50: Benelux Foam Buoyancy Aid Volume (K) Forecast, by Application 2020 & 2033
- Table 51: Nordics Foam Buoyancy Aid Revenue (undefined) Forecast, by Application 2020 & 2033
- Table 52: Nordics Foam Buoyancy Aid Volume (K) Forecast, by Application 2020 & 2033
- Table 53: Rest of Europe Foam Buoyancy Aid Revenue (undefined) Forecast, by Application 2020 & 2033
- Table 54: Rest of Europe Foam Buoyancy Aid Volume (K) Forecast, by Application 2020 & 2033
- Table 55: Global Foam Buoyancy Aid Revenue undefined Forecast, by Type 2020 & 2033
- Table 56: Global Foam Buoyancy Aid Volume K Forecast, by Type 2020 & 2033
- Table 57: Global Foam Buoyancy Aid Revenue undefined Forecast, by Application 2020 & 2033
- Table 58: Global Foam Buoyancy Aid Volume K Forecast, by Application 2020 & 2033
- Table 59: Global Foam Buoyancy Aid Revenue undefined Forecast, by Country 2020 & 2033
- Table 60: Global Foam Buoyancy Aid Volume K Forecast, by Country 2020 & 2033
- Table 61: Turkey Foam Buoyancy Aid Revenue (undefined) Forecast, by Application 2020 & 2033
- Table 62: Turkey Foam Buoyancy Aid Volume (K) Forecast, by Application 2020 & 2033
- Table 63: Israel Foam Buoyancy Aid Revenue (undefined) Forecast, by Application 2020 & 2033
- Table 64: Israel Foam Buoyancy Aid Volume (K) Forecast, by Application 2020 & 2033
- Table 65: GCC Foam Buoyancy Aid Revenue (undefined) Forecast, by Application 2020 & 2033
- Table 66: GCC Foam Buoyancy Aid Volume (K) Forecast, by Application 2020 & 2033
- Table 67: North Africa Foam Buoyancy Aid Revenue (undefined) Forecast, by Application 2020 & 2033
- Table 68: North Africa Foam Buoyancy Aid Volume (K) Forecast, by Application 2020 & 2033
- Table 69: South Africa Foam Buoyancy Aid Revenue (undefined) Forecast, by Application 2020 & 2033
- Table 70: South Africa Foam Buoyancy Aid Volume (K) Forecast, by Application 2020 & 2033
- Table 71: Rest of Middle East & Africa Foam Buoyancy Aid Revenue (undefined) Forecast, by Application 2020 & 2033
- Table 72: Rest of Middle East & Africa Foam Buoyancy Aid Volume (K) Forecast, by Application 2020 & 2033
- Table 73: Global Foam Buoyancy Aid Revenue undefined Forecast, by Type 2020 & 2033
- Table 74: Global Foam Buoyancy Aid Volume K Forecast, by Type 2020 & 2033
- Table 75: Global Foam Buoyancy Aid Revenue undefined Forecast, by Application 2020 & 2033
- Table 76: Global Foam Buoyancy Aid Volume K Forecast, by Application 2020 & 2033
- Table 77: Global Foam Buoyancy Aid Revenue undefined Forecast, by Country 2020 & 2033
- Table 78: Global Foam Buoyancy Aid Volume K Forecast, by Country 2020 & 2033
- Table 79: China Foam Buoyancy Aid Revenue (undefined) Forecast, by Application 2020 & 2033
- Table 80: China Foam Buoyancy Aid Volume (K) Forecast, by Application 2020 & 2033
- Table 81: India Foam Buoyancy Aid Revenue (undefined) Forecast, by Application 2020 & 2033
- Table 82: India Foam Buoyancy Aid Volume (K) Forecast, by Application 2020 & 2033
- Table 83: Japan Foam Buoyancy Aid Revenue (undefined) Forecast, by Application 2020 & 2033
- Table 84: Japan Foam Buoyancy Aid Volume (K) Forecast, by Application 2020 & 2033
- Table 85: South Korea Foam Buoyancy Aid Revenue (undefined) Forecast, by Application 2020 & 2033
- Table 86: South Korea Foam Buoyancy Aid Volume (K) Forecast, by Application 2020 & 2033
- Table 87: ASEAN Foam Buoyancy Aid Revenue (undefined) Forecast, by Application 2020 & 2033
- Table 88: ASEAN Foam Buoyancy Aid Volume (K) Forecast, by Application 2020 & 2033
- Table 89: Oceania Foam Buoyancy Aid Revenue (undefined) Forecast, by Application 2020 & 2033
- Table 90: Oceania Foam Buoyancy Aid Volume (K) Forecast, by Application 2020 & 2033
- Table 91: Rest of Asia Pacific Foam Buoyancy Aid Revenue (undefined) Forecast, by Application 2020 & 2033
- Table 92: Rest of Asia Pacific Foam Buoyancy Aid Volume (K) Forecast, by Application 2020 & 2033
Frequently Asked Questions
1. What is the projected Compound Annual Growth Rate (CAGR) of the Foam Buoyancy Aid?
The projected CAGR is approximately 10.97%.
2. Which companies are prominent players in the Foam Buoyancy Aid?
Key companies in the market include Survitec Group Limited, VIKING Life-Saving Equipment, The Coleman Company, Kent Sporting Goods, Mustang Survival, Hansen Protection, Drarger, Johnson Outdoors, LALIZAS, Secumar, International Safety Products, NRS(Northwest River Supplies), Dongtai Jianghai, Wuxi Xingtai Shipping Equipment, SALUS MARINE WEAR INC., Aqua Lung International, O’Neill, Astral, Stormy Lifejackets, Kokatat, Harmony Gear, JimBuoy, SeaSafe Systems, Spinlock.
3. What are the main segments of the Foam Buoyancy Aid?
The market segments include Type, Application.
4. Can you provide details about the market size?
The market size is estimated to be USD XXX N/A as of 2022.
5. What are some drivers contributing to market growth?
N/A
6. What are the notable trends driving market growth?
N/A
7. Are there any restraints impacting market growth?
N/A
8. Can you provide examples of recent developments in the market?
N/A
9. What pricing options are available for accessing the report?
Pricing options include single-user, multi-user, and enterprise licenses priced at USD 4350.00, USD 6525.00, and USD 8700.00 respectively.
10. Is the market size provided in terms of value or volume?
The market size is provided in terms of value, measured in N/A and volume, measured in K.
11. Are there any specific market keywords associated with the report?
Yes, the market keyword associated with the report is "Foam Buoyancy Aid," which aids in identifying and referencing the specific market segment covered.
12. How do I determine which pricing option suits my needs best?
The pricing options vary based on user requirements and access needs. Individual users may opt for single-user licenses, while businesses requiring broader access may choose multi-user or enterprise licenses for cost-effective access to the report.
13. Are there any additional resources or data provided in the Foam Buoyancy Aid report?
While the report offers comprehensive insights, it's advisable to review the specific contents or supplementary materials provided to ascertain if additional resources or data are available.
14. How can I stay updated on further developments or reports in the Foam Buoyancy Aid?
To stay informed about further developments, trends, and reports in the Foam Buoyancy Aid, consider subscribing to industry newsletters, following relevant companies and organizations, or regularly checking reputable industry news sources and publications.
Methodology
Step 1 - Identification of Relevant Samples Size from Population Database


Step 2 - Approaches for Defining Global Market Size (Value, Volume* & Price*)

Note*: In applicable scenarios
Step 3 - Data Sources
Primary Research
- Web Analytics
- Survey Reports
- Research Institute
- Latest Research Reports
- Opinion Leaders
Secondary Research
- Annual Reports
- White Paper
- Latest Press Release
- Industry Association
- Paid Database
- Investor Presentations

Step 4 - Data Triangulation
Involves using different sources of information in order to increase the validity of a study
These sources are likely to be stakeholders in a program - participants, other researchers, program staff, other community members, and so on.
Then we put all data in single framework & apply various statistical tools to find out the dynamic on the market.
During the analysis stage, feedback from the stakeholder groups would be compared to determine areas of agreement as well as areas of divergence