

Key Insights
The global foam glass market demonstrates significant growth, projected to reach $2.82 billion by 2025, with a Compound Annual Growth Rate (CAGR) of 5.04%. This expansion is fueled by escalating demand across key industries, primarily driven by the construction sector's increasing need for high-performance thermal insulation. Stringent energy efficiency regulations in commercial and industrial buildings are a major catalyst. Foam glass's inherent qualities, including its lightweight nature, superior durability, and excellent resistance to moisture and chemicals, make it an attractive material for roofing, flooring, and critical infrastructure projects. The market is segmented by type (open-cell, closed-cell) and end-user industry (commercial, residential, industrial). The commercial sector currently leads market consumption due to the prevalence of large-scale construction initiatives. Advancements in foam glass production technology are enhancing efficiency, reducing costs, and improving product quality. While the residential segment shows growth, adoption is slower than in commercial applications due to initial investment considerations. However, growing awareness of long-term cost savings from superior insulation is gradually narrowing this gap. Geographically, the Asia-Pacific region, particularly China and India, presents substantial growth potential, attributed to rapid infrastructure development and urbanization. North America and Europe maintain robust market shares, supported by established building codes and a strong emphasis on sustainable construction practices.
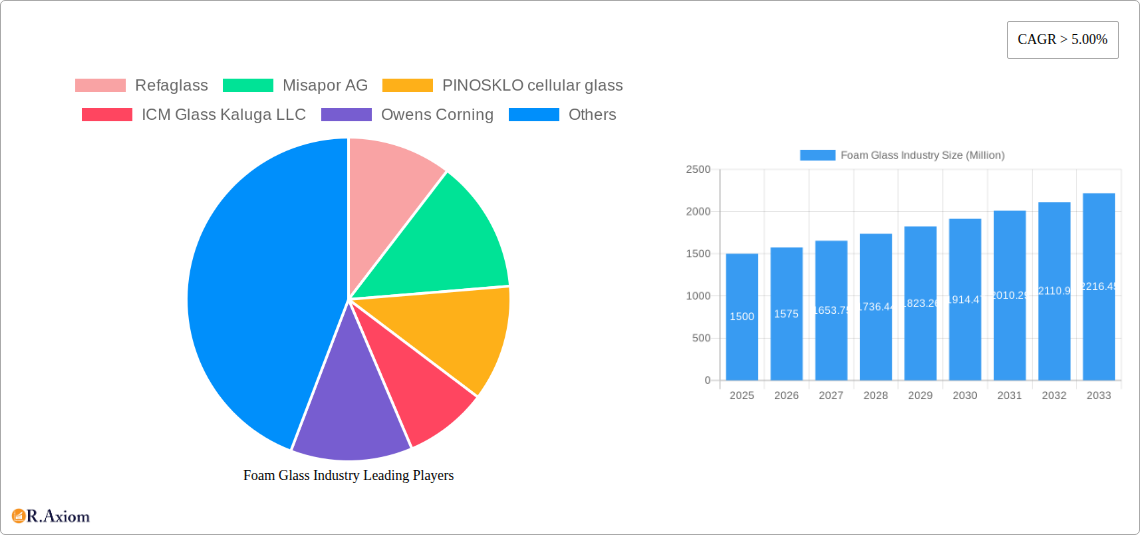
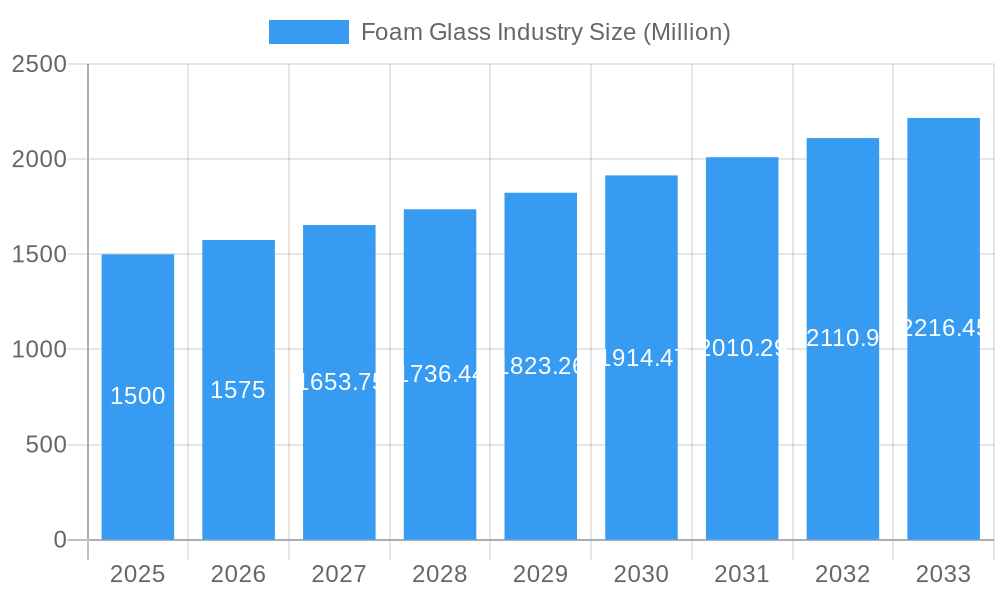
Foam Glass Industry Market Size (In Billion)
Despite its promising growth, the foam glass market encounters challenges. Volatility in raw material prices, especially recycled glass, can affect production expenses. The relatively high upfront cost of foam glass installation compared to alternative insulation materials may also impede adoption in specific market segments. Nevertheless, the long-term cost-effectiveness and environmental advantages of foam glass are expected to mitigate these challenges, supporting sustained market expansion. The competitive landscape is moderately concentrated, with leading players such as Owens Corning and Misapor AG focusing on innovation and strategic alliances to broaden their market reach and address diverse regional demands. The forecast period is anticipated to witness further consolidation as companies pursue market leadership through mergers, acquisitions, and product portfolio expansion.
Foam Glass Industry Company Market Share
This report offers a comprehensive analysis of the global foam glass industry, providing valuable insights for stakeholders, investors, and industry professionals. The study covers the market from 2019 to 2033, with 2025 designated as the base year. Key analyses include market size, growth drivers, challenges, and opportunities across various segments. Prominent players such as Refaglass, Misapor AG, and Owens Corning are profiled, contributing to a thorough competitive landscape assessment.
Foam Glass Industry Market Concentration & Innovation
The foam glass market exhibits a moderately concentrated structure, with a few major players holding significant market share. Refaglass, Misapor AG, and Owens Corning are estimated to collectively control approximately xx% of the global market in 2025. However, the presence of several regional and niche players signifies a dynamic competitive landscape. Innovation in the sector is driven by the need for enhanced thermal insulation properties, improved durability, and sustainable manufacturing processes. Regulatory frameworks, particularly those concerning energy efficiency and environmental sustainability, significantly influence market dynamics. Product substitutes, such as mineral wool and expanded polystyrene, pose a competitive threat. Mergers and acquisitions (M&A) activity in the foam glass sector is relatively low, with xx Million in total deal value recorded between 2019 and 2024. End-user trends, primarily focused on green building initiatives and infrastructure development, are key growth drivers.
- Market Share (2025 Estimate): Refaglass (xx%), Misapor AG (xx%), Owens Corning (xx%), Others (xx%)
- M&A Deal Value (2019-2024): xx Million
- Key Innovation Drivers: Improved thermal performance, enhanced durability, sustainable production methods.
Foam Glass Industry Industry Trends & Insights
The global foam glass market is projected to experience significant growth, with a Compound Annual Growth Rate (CAGR) of xx% during the forecast period (2025-2033). This growth is primarily fueled by the increasing demand for energy-efficient building materials in both residential and commercial sectors. Technological advancements, such as the development of innovative production techniques and enhanced material formulations, are further boosting market expansion. Consumer preference for sustainable and environmentally friendly building products is also driving market growth. The competitive landscape is characterized by both established players and emerging companies striving for innovation and market share. Market penetration in developing economies is expected to increase significantly, contributing substantially to overall market expansion.
Dominant Markets & Segments in Foam Glass Industry
The dominant market segment is projected to be the commercial sector, fueled by large-scale construction projects and stringent energy efficiency regulations. Within product types, closed-cell foam glass is expected to hold the largest market share due to its superior insulation properties and moisture resistance. Europe is projected to be the leading region, driven by robust construction activity and supportive government policies promoting green building practices.
- Leading Region: Europe
- Leading Segment (Type): Closed-Cell Foam Glass
- Leading Segment (End-user): Commercial
- Key Drivers (Europe): Stringent building codes, growing awareness of energy efficiency, significant investments in infrastructure projects.
Foam Glass Industry Product Developments
Recent product developments have focused on improving the thermal conductivity of foam glass, enhancing its resistance to moisture and chemicals, and expanding its applications in various industries. New formulations and manufacturing techniques have enabled the production of lighter and stronger foam glass products, meeting the diverse needs of the market. This has increased the market fit and competitiveness of the product.
Report Scope & Segmentation Analysis
This report segments the foam glass market by type (Open Cell, Closed Cell, Other Types) and end-user industry (Commercial, Residential, Industrial). Each segment is analyzed based on its market size, growth projections, and competitive landscape.
- By Type: Open-cell foam glass is expected to show moderate growth, driven by its cost-effectiveness; closed-cell foam glass offers higher market value due to improved performance; other types, like specialized formulations, will occupy a niche market.
- By End-user Industry: Commercial construction accounts for the largest market share, followed by residential and industrial sectors.
Key Drivers of Foam Glass Industry Growth
The foam glass industry's growth is primarily driven by several factors: increasing demand for energy-efficient construction materials, rising awareness of environmental sustainability, advancements in manufacturing technology leading to cost-effective production, and supportive government policies promoting green building practices.
Challenges in the Foam Glass Industry Sector
The industry faces challenges such as fluctuating raw material prices, competition from alternative insulation materials, and stringent environmental regulations. Supply chain disruptions, especially in raw materials sourcing and transportation, can significantly impact profitability.
Emerging Opportunities in Foam Glass Industry
Emerging opportunities exist in developing economies with burgeoning construction sectors, the development of novel applications in specialized industries like infrastructure and transportation, and the integration of foam glass with other building materials to create composite solutions that maximize energy efficiency.
Leading Players in the Foam Glass Industry Market
- Refaglass
- Misapor AG
- PINOSKLO cellular glass
- ICM Glass Kaluga LLC
- Owens Corning
- GEOCELL Schaumglas GmbH
- AeroAggregates of North America LLC
- Glapor Werk Mitterteich GmbH
- Glevel
- Styro Ltd
- Anhui Huichang New Material Co Ltd
- Ningbo Yoyo Foam Glass Co Ltd
- Zhejiang Zhenshen Insulation Technology Corp
- Polydros SA
- Uusioaines Oy
Key Developments in Foam Glass Industry Industry
- 2022 Q4: Refaglass launched a new line of high-performance foam glass insulation panels.
- 2023 Q1: Misapor AG announced a strategic partnership to expand its manufacturing capacity in North America.
- 2024 Q2: Owens Corning invested in R&D for enhanced foam glass formulations focusing on sustainability. (Further details are limited, and specific dates for other developments are not available)
Strategic Outlook for Foam Glass Industry Market
The foam glass industry is poised for continued growth, driven by strong demand from the construction and infrastructure sectors and the increasing focus on sustainability. Technological advancements, product diversification, and strategic partnerships will be crucial for players seeking to capitalize on this positive outlook. Expansion into emerging markets and development of innovative applications present significant opportunities for future market expansion.
Foam Glass Industry Segmentation
-
1. Type
- 1.1. Open Cell
- 1.2. Closed Cell
- 1.3. Other Types
-
2. End-user Industry
- 2.1. Commercial
- 2.2. Residential
- 2.3. Industrial
Foam Glass Industry Segmentation By Geography
-
1. Asia Pacific
- 1.1. China
- 1.2. India
- 1.3. Japan
- 1.4. South Korea
- 1.5. Rest of Asia Pacific
-
2. North America
- 2.1. United States
- 2.2. Canada
- 2.3. Mexico
-
3. Europe
- 3.1. Germany
- 3.2. United Kingdom
- 3.3. France
- 3.4. Italy
- 3.5. Rest of Europe
-
4. South America
- 4.1. Brazil
- 4.2. Argentina
- 4.3. Rest of South America
-
5. Middle East and Africa
- 5.1. Saudi Arabia
- 5.2. South Africa
- 5.3. Rest of Middle East and Africa
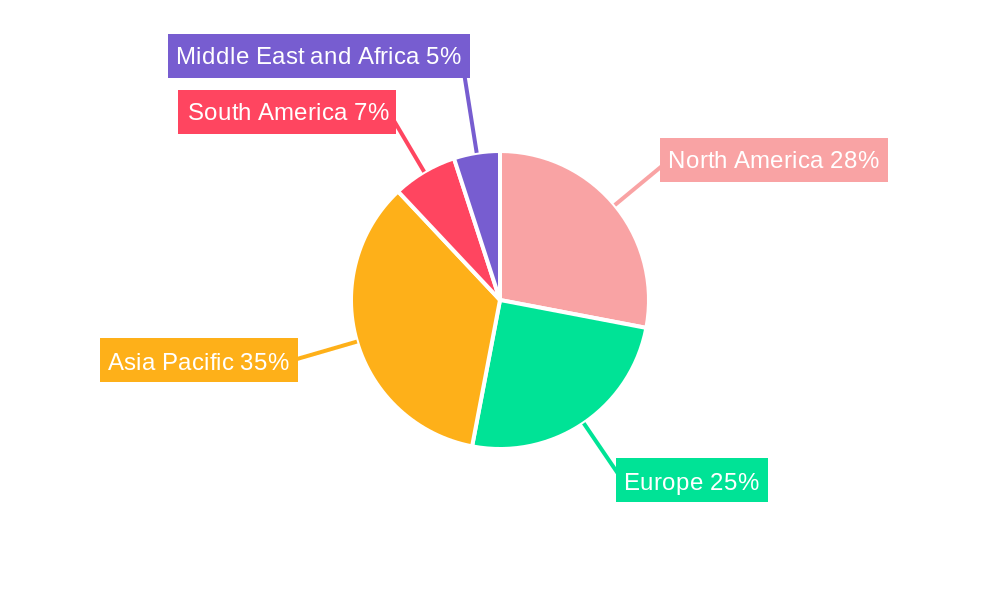
Foam Glass Industry Regional Market Share
Geographic Coverage of Foam Glass Industry
Foam Glass Industry REPORT HIGHLIGHTS
| Aspects | Details |
|---|---|
| Study Period | 2020-2034 |
| Base Year | 2025 |
| Estimated Year | 2026 |
| Forecast Period | 2026-2034 |
| Historical Period | 2020-2025 |
| Growth Rate | CAGR of 5.04% from 2020-2034 |
| Segmentation |
|
Table of Contents
- 1. Introduction
- 1.1. Research Scope
- 1.2. Market Segmentation
- 1.3. Research Objective
- 1.4. Definitions and Assumptions
- 2. Executive Summary
- 2.1. Market Snapshot
- 3. Market Dynamics
- 3.1. Market Drivers
- 3.2. Market Restrains
- 3.3. Market Trends
- 3.4. Market Opportunities
- 4. Market Factor Analysis
- 4.1. Porters Five Forces
- 4.1.1. Bargaining Power of Suppliers
- 4.1.2. Bargaining Power of Buyers
- 4.1.3. Threat of New Entrants
- 4.1.4. Threat of Substitutes
- 4.1.5. Competitive Rivalry
- 4.2. PESTEL analysis
- 4.3. BCG Analysis
- 4.3.1. Stars (High Growth, High Market Share)
- 4.3.2. Cash Cows (Low Growth, High Market Share)
- 4.3.3. Question Mark (High Growth, Low Market Share)
- 4.3.4. Dogs (Low Growth, Low Market Share)
- 4.4. Ansoff Matrix Analysis
- 4.5. Supply Chain Analysis
- 4.6. Regulatory Landscape
- 4.7. Current Market Potential and Opportunity Assessment (TAM–SAM–SOM Framework)
- 4.8. RAX Analyst Note
- 4.1. Porters Five Forces
- 5. Market Analysis, Insights and Forecast 2021-2033
- 5.1. Market Analysis, Insights and Forecast - by Type
- 5.1.1. Open Cell
- 5.1.2. Closed Cell
- 5.1.3. Other Types
- 5.2. Market Analysis, Insights and Forecast - by End-user Industry
- 5.2.1. Commercial
- 5.2.2. Residential
- 5.2.3. Industrial
- 5.3. Market Analysis, Insights and Forecast - by Region
- 5.3.1. Asia Pacific
- 5.3.2. North America
- 5.3.3. Europe
- 5.3.4. South America
- 5.3.5. Middle East and Africa
- 5.1. Market Analysis, Insights and Forecast - by Type
- 6. Global Foam Glass Industry Analysis, Insights and Forecast, 2021-2033
- 6.1. Market Analysis, Insights and Forecast - by Type
- 6.1.1. Open Cell
- 6.1.2. Closed Cell
- 6.1.3. Other Types
- 6.2. Market Analysis, Insights and Forecast - by End-user Industry
- 6.2.1. Commercial
- 6.2.2. Residential
- 6.2.3. Industrial
- 6.1. Market Analysis, Insights and Forecast - by Type
- 7. Asia Pacific Foam Glass Industry Analysis, Insights and Forecast, 2020-2032
- 7.1. Market Analysis, Insights and Forecast - by Type
- 7.1.1. Open Cell
- 7.1.2. Closed Cell
- 7.1.3. Other Types
- 7.2. Market Analysis, Insights and Forecast - by End-user Industry
- 7.2.1. Commercial
- 7.2.2. Residential
- 7.2.3. Industrial
- 7.1. Market Analysis, Insights and Forecast - by Type
- 8. North America Foam Glass Industry Analysis, Insights and Forecast, 2020-2032
- 8.1. Market Analysis, Insights and Forecast - by Type
- 8.1.1. Open Cell
- 8.1.2. Closed Cell
- 8.1.3. Other Types
- 8.2. Market Analysis, Insights and Forecast - by End-user Industry
- 8.2.1. Commercial
- 8.2.2. Residential
- 8.2.3. Industrial
- 8.1. Market Analysis, Insights and Forecast - by Type
- 9. Europe Foam Glass Industry Analysis, Insights and Forecast, 2020-2032
- 9.1. Market Analysis, Insights and Forecast - by Type
- 9.1.1. Open Cell
- 9.1.2. Closed Cell
- 9.1.3. Other Types
- 9.2. Market Analysis, Insights and Forecast - by End-user Industry
- 9.2.1. Commercial
- 9.2.2. Residential
- 9.2.3. Industrial
- 9.1. Market Analysis, Insights and Forecast - by Type
- 10. South America Foam Glass Industry Analysis, Insights and Forecast, 2020-2032
- 10.1. Market Analysis, Insights and Forecast - by Type
- 10.1.1. Open Cell
- 10.1.2. Closed Cell
- 10.1.3. Other Types
- 10.2. Market Analysis, Insights and Forecast - by End-user Industry
- 10.2.1. Commercial
- 10.2.2. Residential
- 10.2.3. Industrial
- 10.1. Market Analysis, Insights and Forecast - by Type
- 11. Middle East and Africa Foam Glass Industry Analysis, Insights and Forecast, 2020-2032
- 11.1. Market Analysis, Insights and Forecast - by Type
- 11.1.1. Open Cell
- 11.1.2. Closed Cell
- 11.1.3. Other Types
- 11.2. Market Analysis, Insights and Forecast - by End-user Industry
- 11.2.1. Commercial
- 11.2.2. Residential
- 11.2.3. Industrial
- 11.1. Market Analysis, Insights and Forecast - by Type
- 12. Competitive Analysis
- 12.1. Company Profiles
- 12.1.1 Refaglass
- 12.1.1.1. Company Overview
- 12.1.1.2. Products
- 12.1.1.3. Company Financials
- 12.1.1.4. SWOT Analysis
- 12.1.2 Misapor AG
- 12.1.2.1. Company Overview
- 12.1.2.2. Products
- 12.1.2.3. Company Financials
- 12.1.2.4. SWOT Analysis
- 12.1.3 PINOSKLO cellular glass
- 12.1.3.1. Company Overview
- 12.1.3.2. Products
- 12.1.3.3. Company Financials
- 12.1.3.4. SWOT Analysis
- 12.1.4 ICM Glass Kaluga LLC
- 12.1.4.1. Company Overview
- 12.1.4.2. Products
- 12.1.4.3. Company Financials
- 12.1.4.4. SWOT Analysis
- 12.1.5 Owens Corning
- 12.1.5.1. Company Overview
- 12.1.5.2. Products
- 12.1.5.3. Company Financials
- 12.1.5.4. SWOT Analysis
- 12.1.6 GEOCELL Schaumglas GmbH
- 12.1.6.1. Company Overview
- 12.1.6.2. Products
- 12.1.6.3. Company Financials
- 12.1.6.4. SWOT Analysis
- 12.1.7 AeroAggregates of North America LLC
- 12.1.7.1. Company Overview
- 12.1.7.2. Products
- 12.1.7.3. Company Financials
- 12.1.7.4. SWOT Analysis
- 12.1.8 Glapor Werk Mitterteich GmbH
- 12.1.8.1. Company Overview
- 12.1.8.2. Products
- 12.1.8.3. Company Financials
- 12.1.8.4. SWOT Analysis
- 12.1.9 Glevel
- 12.1.9.1. Company Overview
- 12.1.9.2. Products
- 12.1.9.3. Company Financials
- 12.1.9.4. SWOT Analysis
- 12.1.10 Styro Ltd
- 12.1.10.1. Company Overview
- 12.1.10.2. Products
- 12.1.10.3. Company Financials
- 12.1.10.4. SWOT Analysis
- 12.1.11 Anhui Huichang New Material Co Ltd
- 12.1.11.1. Company Overview
- 12.1.11.2. Products
- 12.1.11.3. Company Financials
- 12.1.11.4. SWOT Analysis
- 12.1.12 Ningbo Yoyo Foam Glass Co Ltd
- 12.1.12.1. Company Overview
- 12.1.12.2. Products
- 12.1.12.3. Company Financials
- 12.1.12.4. SWOT Analysis
- 12.1.13 Zhejiang Zhenshen Insulation Technology Corp *List Not Exhaustive
- 12.1.13.1. Company Overview
- 12.1.13.2. Products
- 12.1.13.3. Company Financials
- 12.1.13.4. SWOT Analysis
- 12.1.14 Polydros SA
- 12.1.14.1. Company Overview
- 12.1.14.2. Products
- 12.1.14.3. Company Financials
- 12.1.14.4. SWOT Analysis
- 12.1.15 Uusioaines Oy
- 12.1.15.1. Company Overview
- 12.1.15.2. Products
- 12.1.15.3. Company Financials
- 12.1.15.4. SWOT Analysis
- 12.1.1 Refaglass
- 12.2. Market Entropy
- 12.2.1 Company's Key Areas Served
- 12.2.2 Recent Developments
- 12.3. Company Market Share Analysis 2025
- 12.3.1 Top 5 Companies Market Share Analysis
- 12.3.2 Top 3 Companies Market Share Analysis
- 12.4. List of Potential Customers
- 13. Research Methodology
List of Figures
- Figure 1: Global Foam Glass Industry Revenue Breakdown (billion, %) by Region 2025 & 2033
- Figure 2: Asia Pacific Foam Glass Industry Revenue (billion), by Type 2025 & 2033
- Figure 3: Asia Pacific Foam Glass Industry Revenue Share (%), by Type 2025 & 2033
- Figure 4: Asia Pacific Foam Glass Industry Revenue (billion), by End-user Industry 2025 & 2033
- Figure 5: Asia Pacific Foam Glass Industry Revenue Share (%), by End-user Industry 2025 & 2033
- Figure 6: Asia Pacific Foam Glass Industry Revenue (billion), by Country 2025 & 2033
- Figure 7: Asia Pacific Foam Glass Industry Revenue Share (%), by Country 2025 & 2033
- Figure 8: North America Foam Glass Industry Revenue (billion), by Type 2025 & 2033
- Figure 9: North America Foam Glass Industry Revenue Share (%), by Type 2025 & 2033
- Figure 10: North America Foam Glass Industry Revenue (billion), by End-user Industry 2025 & 2033
- Figure 11: North America Foam Glass Industry Revenue Share (%), by End-user Industry 2025 & 2033
- Figure 12: North America Foam Glass Industry Revenue (billion), by Country 2025 & 2033
- Figure 13: North America Foam Glass Industry Revenue Share (%), by Country 2025 & 2033
- Figure 14: Europe Foam Glass Industry Revenue (billion), by Type 2025 & 2033
- Figure 15: Europe Foam Glass Industry Revenue Share (%), by Type 2025 & 2033
- Figure 16: Europe Foam Glass Industry Revenue (billion), by End-user Industry 2025 & 2033
- Figure 17: Europe Foam Glass Industry Revenue Share (%), by End-user Industry 2025 & 2033
- Figure 18: Europe Foam Glass Industry Revenue (billion), by Country 2025 & 2033
- Figure 19: Europe Foam Glass Industry Revenue Share (%), by Country 2025 & 2033
- Figure 20: South America Foam Glass Industry Revenue (billion), by Type 2025 & 2033
- Figure 21: South America Foam Glass Industry Revenue Share (%), by Type 2025 & 2033
- Figure 22: South America Foam Glass Industry Revenue (billion), by End-user Industry 2025 & 2033
- Figure 23: South America Foam Glass Industry Revenue Share (%), by End-user Industry 2025 & 2033
- Figure 24: South America Foam Glass Industry Revenue (billion), by Country 2025 & 2033
- Figure 25: South America Foam Glass Industry Revenue Share (%), by Country 2025 & 2033
- Figure 26: Middle East and Africa Foam Glass Industry Revenue (billion), by Type 2025 & 2033
- Figure 27: Middle East and Africa Foam Glass Industry Revenue Share (%), by Type 2025 & 2033
- Figure 28: Middle East and Africa Foam Glass Industry Revenue (billion), by End-user Industry 2025 & 2033
- Figure 29: Middle East and Africa Foam Glass Industry Revenue Share (%), by End-user Industry 2025 & 2033
- Figure 30: Middle East and Africa Foam Glass Industry Revenue (billion), by Country 2025 & 2033
- Figure 31: Middle East and Africa Foam Glass Industry Revenue Share (%), by Country 2025 & 2033
List of Tables
- Table 1: Global Foam Glass Industry Revenue billion Forecast, by Type 2020 & 2033
- Table 2: Global Foam Glass Industry Revenue billion Forecast, by End-user Industry 2020 & 2033
- Table 3: Global Foam Glass Industry Revenue billion Forecast, by Region 2020 & 2033
- Table 4: Global Foam Glass Industry Revenue billion Forecast, by Type 2020 & 2033
- Table 5: Global Foam Glass Industry Revenue billion Forecast, by End-user Industry 2020 & 2033
- Table 6: Global Foam Glass Industry Revenue billion Forecast, by Country 2020 & 2033
- Table 7: China Foam Glass Industry Revenue (billion) Forecast, by Application 2020 & 2033
- Table 8: India Foam Glass Industry Revenue (billion) Forecast, by Application 2020 & 2033
- Table 9: Japan Foam Glass Industry Revenue (billion) Forecast, by Application 2020 & 2033
- Table 10: South Korea Foam Glass Industry Revenue (billion) Forecast, by Application 2020 & 2033
- Table 11: Rest of Asia Pacific Foam Glass Industry Revenue (billion) Forecast, by Application 2020 & 2033
- Table 12: Global Foam Glass Industry Revenue billion Forecast, by Type 2020 & 2033
- Table 13: Global Foam Glass Industry Revenue billion Forecast, by End-user Industry 2020 & 2033
- Table 14: Global Foam Glass Industry Revenue billion Forecast, by Country 2020 & 2033
- Table 15: United States Foam Glass Industry Revenue (billion) Forecast, by Application 2020 & 2033
- Table 16: Canada Foam Glass Industry Revenue (billion) Forecast, by Application 2020 & 2033
- Table 17: Mexico Foam Glass Industry Revenue (billion) Forecast, by Application 2020 & 2033
- Table 18: Global Foam Glass Industry Revenue billion Forecast, by Type 2020 & 2033
- Table 19: Global Foam Glass Industry Revenue billion Forecast, by End-user Industry 2020 & 2033
- Table 20: Global Foam Glass Industry Revenue billion Forecast, by Country 2020 & 2033
- Table 21: Germany Foam Glass Industry Revenue (billion) Forecast, by Application 2020 & 2033
- Table 22: United Kingdom Foam Glass Industry Revenue (billion) Forecast, by Application 2020 & 2033
- Table 23: France Foam Glass Industry Revenue (billion) Forecast, by Application 2020 & 2033
- Table 24: Italy Foam Glass Industry Revenue (billion) Forecast, by Application 2020 & 2033
- Table 25: Rest of Europe Foam Glass Industry Revenue (billion) Forecast, by Application 2020 & 2033
- Table 26: Global Foam Glass Industry Revenue billion Forecast, by Type 2020 & 2033
- Table 27: Global Foam Glass Industry Revenue billion Forecast, by End-user Industry 2020 & 2033
- Table 28: Global Foam Glass Industry Revenue billion Forecast, by Country 2020 & 2033
- Table 29: Brazil Foam Glass Industry Revenue (billion) Forecast, by Application 2020 & 2033
- Table 30: Argentina Foam Glass Industry Revenue (billion) Forecast, by Application 2020 & 2033
- Table 31: Rest of South America Foam Glass Industry Revenue (billion) Forecast, by Application 2020 & 2033
- Table 32: Global Foam Glass Industry Revenue billion Forecast, by Type 2020 & 2033
- Table 33: Global Foam Glass Industry Revenue billion Forecast, by End-user Industry 2020 & 2033
- Table 34: Global Foam Glass Industry Revenue billion Forecast, by Country 2020 & 2033
- Table 35: Saudi Arabia Foam Glass Industry Revenue (billion) Forecast, by Application 2020 & 2033
- Table 36: South Africa Foam Glass Industry Revenue (billion) Forecast, by Application 2020 & 2033
- Table 37: Rest of Middle East and Africa Foam Glass Industry Revenue (billion) Forecast, by Application 2020 & 2033
Frequently Asked Questions
1. What is the projected Compound Annual Growth Rate (CAGR) of the Foam Glass Industry?
The projected CAGR is approximately 5.04%.
2. Which companies are prominent players in the Foam Glass Industry?
Key companies in the market include Refaglass, Misapor AG, PINOSKLO cellular glass, ICM Glass Kaluga LLC, Owens Corning, GEOCELL Schaumglas GmbH, AeroAggregates of North America LLC, Glapor Werk Mitterteich GmbH, Glevel, Styro Ltd, Anhui Huichang New Material Co Ltd, Ningbo Yoyo Foam Glass Co Ltd, Zhejiang Zhenshen Insulation Technology Corp *List Not Exhaustive, Polydros SA, Uusioaines Oy.
3. What are the main segments of the Foam Glass Industry?
The market segments include Type, End-user Industry.
4. Can you provide details about the market size?
The market size is estimated to be USD 2.82 billion as of 2022.
5. What are some drivers contributing to market growth?
; Increasing Demand From the Industrial Sector; Other Drivers.
6. What are the notable trends driving market growth?
Industrial Segment to Dominate the Market.
7. Are there any restraints impacting market growth?
; High Capital Investment; Other Restraints.
8. Can you provide examples of recent developments in the market?
N/A
9. What pricing options are available for accessing the report?
Pricing options include single-user, multi-user, and enterprise licenses priced at USD 4750, USD 5250, and USD 8750 respectively.
10. Is the market size provided in terms of value or volume?
The market size is provided in terms of value, measured in billion.
11. Are there any specific market keywords associated with the report?
Yes, the market keyword associated with the report is "Foam Glass Industry," which aids in identifying and referencing the specific market segment covered.
12. How do I determine which pricing option suits my needs best?
The pricing options vary based on user requirements and access needs. Individual users may opt for single-user licenses, while businesses requiring broader access may choose multi-user or enterprise licenses for cost-effective access to the report.
13. Are there any additional resources or data provided in the Foam Glass Industry report?
While the report offers comprehensive insights, it's advisable to review the specific contents or supplementary materials provided to ascertain if additional resources or data are available.
14. How can I stay updated on further developments or reports in the Foam Glass Industry?
To stay informed about further developments, trends, and reports in the Foam Glass Industry, consider subscribing to industry newsletters, following relevant companies and organizations, or regularly checking reputable industry news sources and publications.
Methodology
Step 1 - Identification of Relevant Samples Size from Population Database


Step 2 - Approaches for Defining Global Market Size (Value, Volume* & Price*)

Note*: In applicable scenarios
Step 3 - Data Sources
Primary Research
- Web Analytics
- Survey Reports
- Research Institute
- Latest Research Reports
- Opinion Leaders
Secondary Research
- Annual Reports
- White Paper
- Latest Press Release
- Industry Association
- Paid Database
- Investor Presentations

Step 4 - Data Triangulation
Involves using different sources of information in order to increase the validity of a study
These sources are likely to be stakeholders in a program - participants, other researchers, program staff, other community members, and so on.
Then we put all data in single framework & apply various statistical tools to find out the dynamic on the market.
During the analysis stage, feedback from the stakeholder groups would be compared to determine areas of agreement as well as areas of divergence