

Key Insights
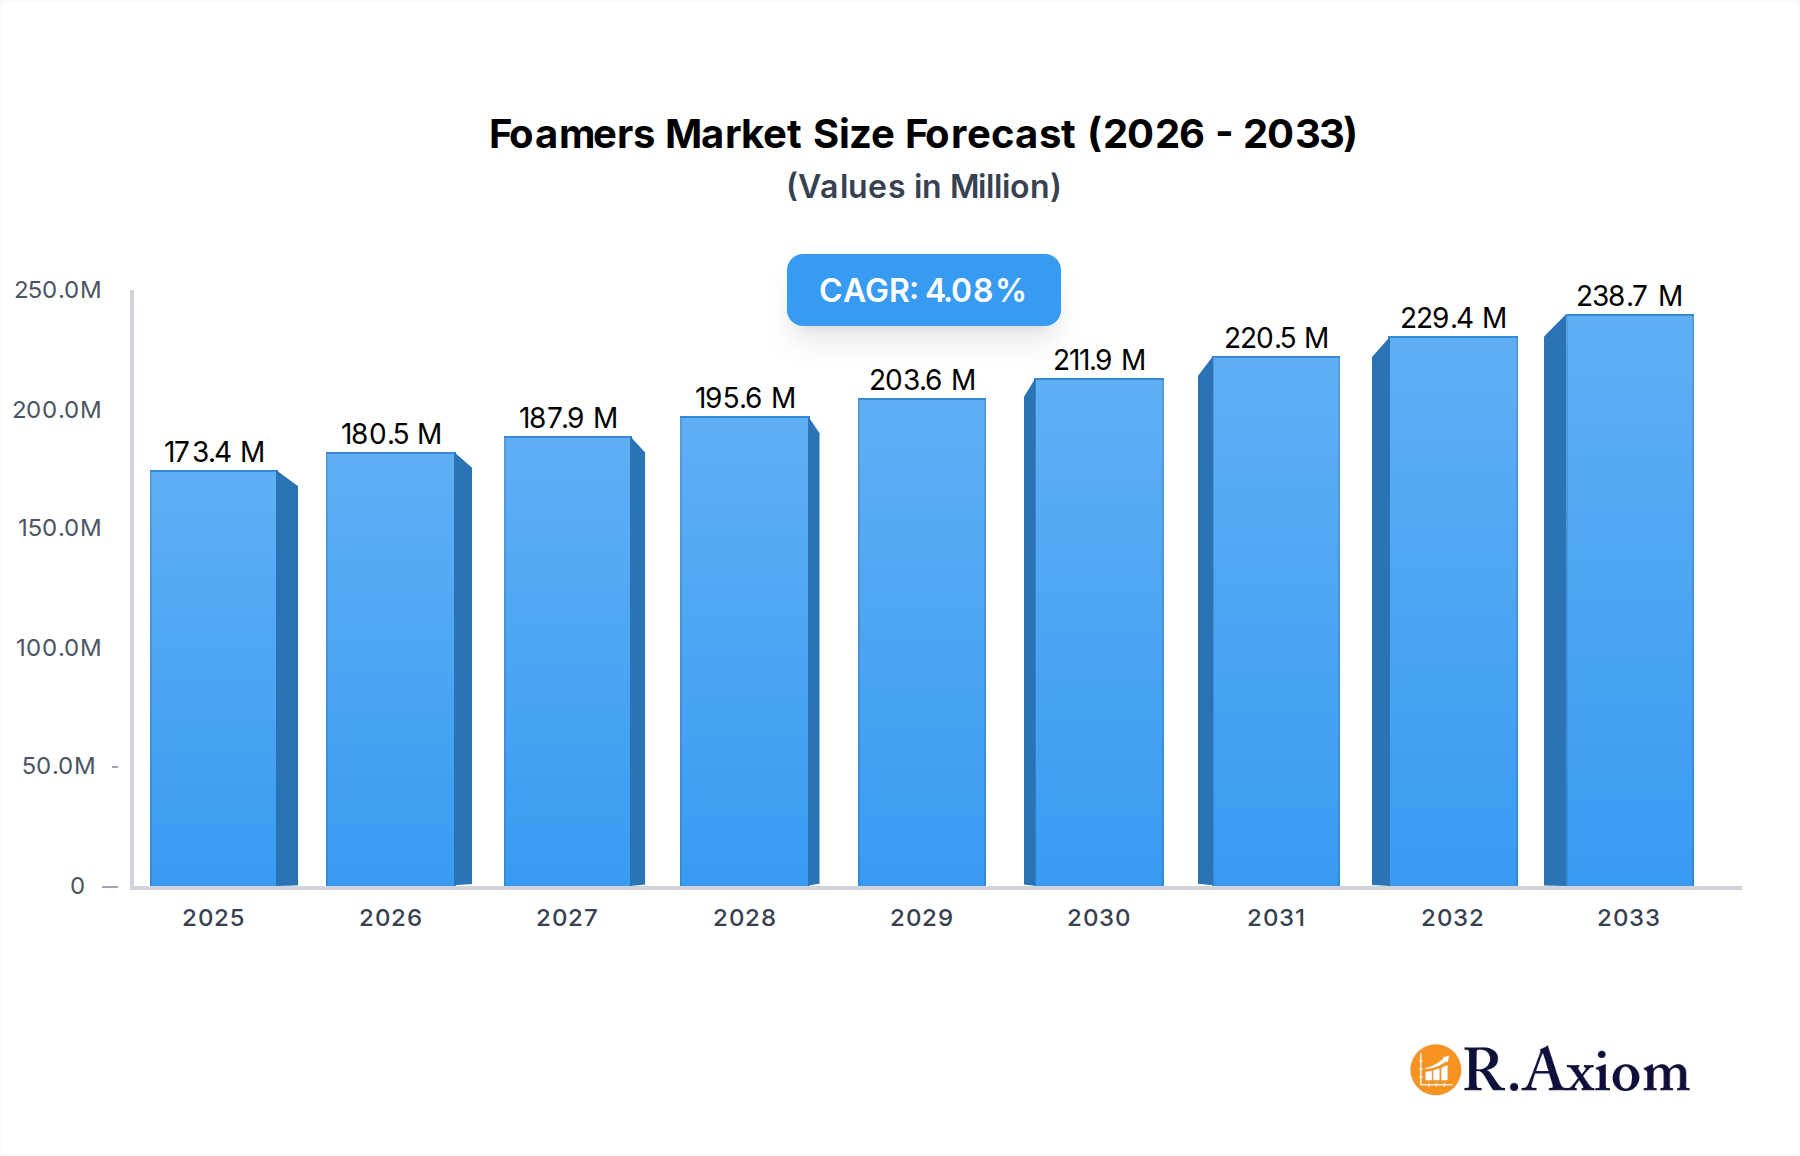
The global market for foamers is projected to experience robust growth, reaching an estimated $173.4 million in 2025 with a Compound Annual Growth Rate (CAGR) of 4.1% through 2033. This expansion is fueled by a diverse range of drivers, primarily the increasing demand from the Chemical Industry for specialized foaming agents in manufacturing processes, and the burgeoning Food Service sector, which leverages foaming technology for product presentation and efficiency. The Personal Healthcare & Cosmetics industry also significantly contributes to market growth, with foam-based products like shaving creams, shampoos, and body washes gaining consumer preference for their user experience and efficacy. Furthermore, the Automotive sector is adopting advanced foaming solutions for insulation and sound dampening, while the Furniture industry utilizes them for enhanced comfort and durability. The market is segmented by application, highlighting these key end-use industries, and by type, distinguishing between Sanitary Grade and Industrial Grade foamers, each catering to specific regulatory and performance requirements.
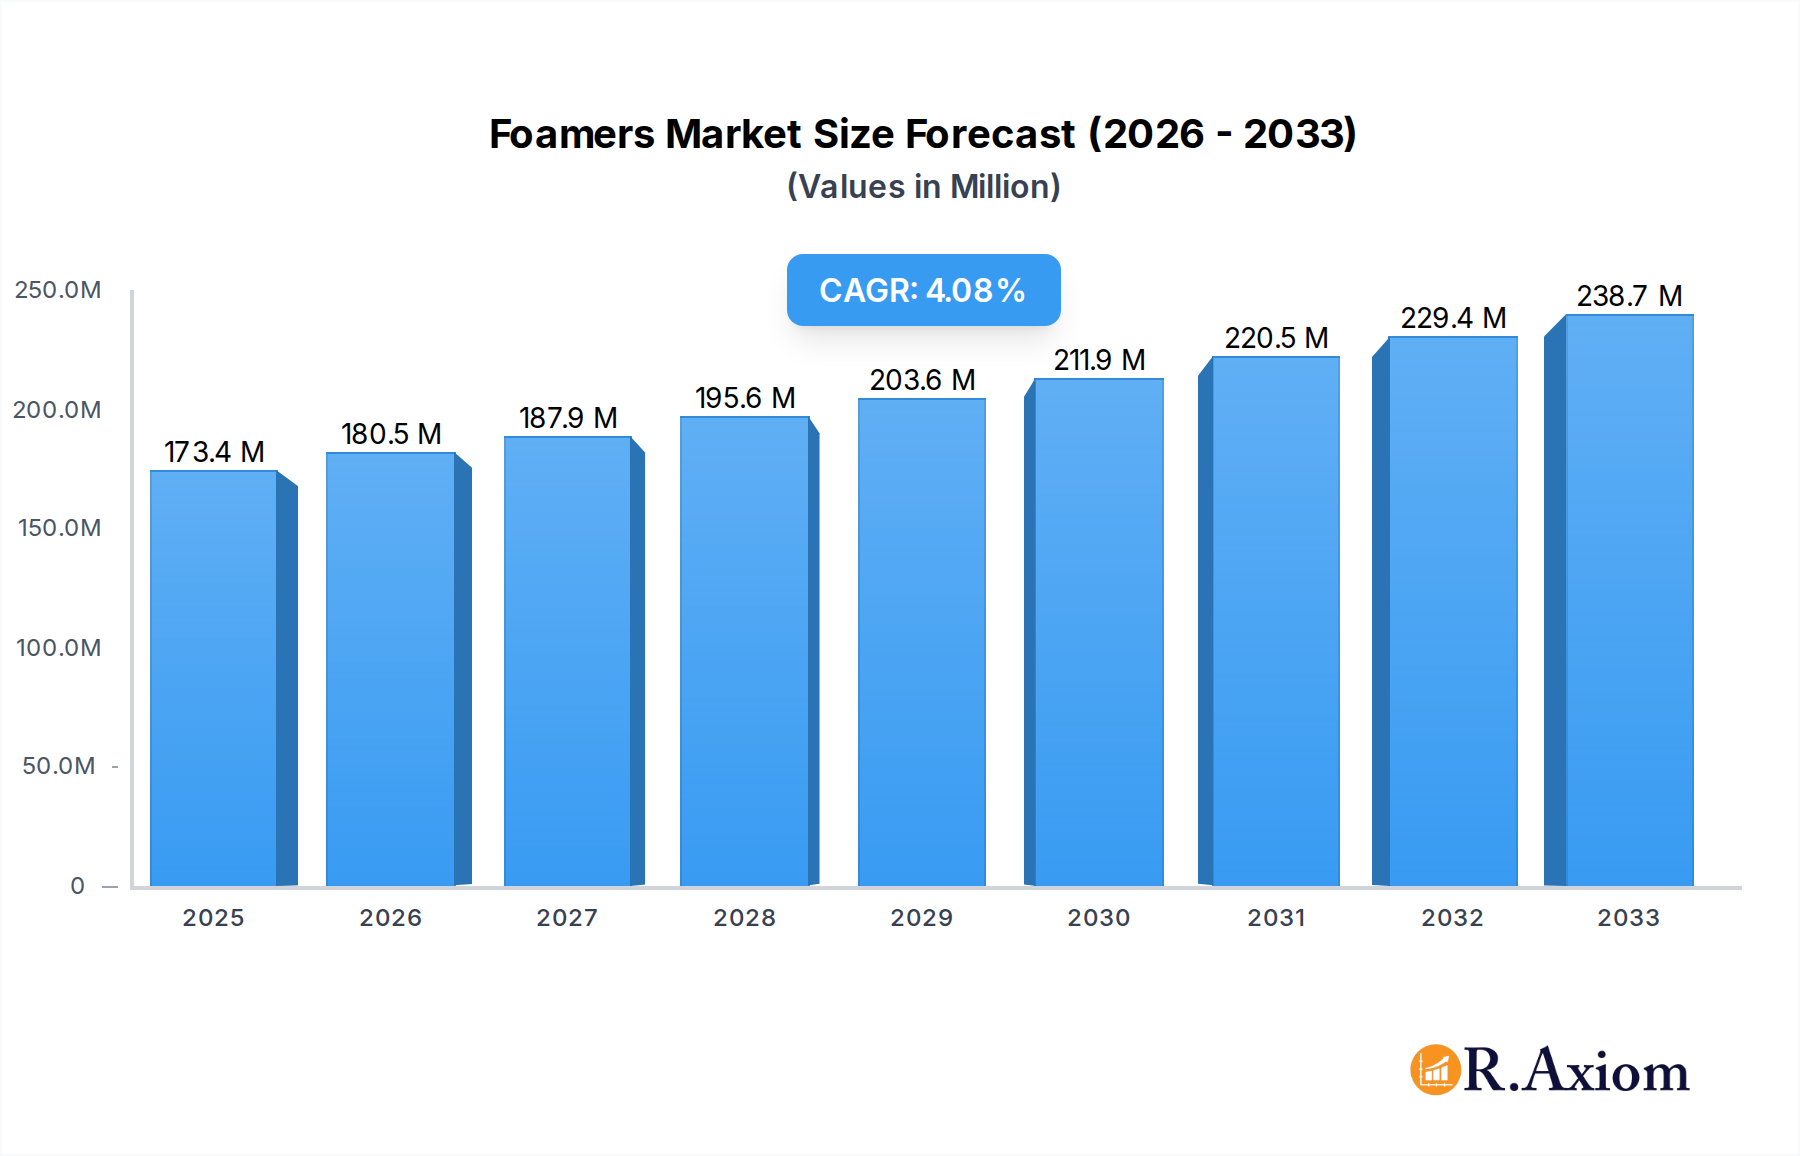
Foamers Market Size (In Million)
The market dynamics are further shaped by emerging trends such as the development of eco-friendly and biodegradable foaming agents, driven by increasing environmental consciousness and regulatory pressures. Innovations in dispensing technology, leading to more controlled and efficient foam application, are also gaining traction. However, certain restraints exist, including the fluctuating raw material prices that can impact production costs and profitability, and the stringent regulatory compliance required for certain applications, particularly in the food and personal care segments. Companies like Procter & Gamble, Griot's Garage, and others are actively innovating and expanding their product portfolios to capitalize on these opportunities across key regions like North America, Europe, and Asia Pacific, which collectively represent a significant share of the global foamers market. The forecast period anticipates sustained demand, with technological advancements and evolving consumer preferences continuing to steer market trajectory.
Foamers Company Market Share
This in-depth report provides a detailed analysis of the global foamers market, encompassing historical performance, current trends, and future projections. It delves into market concentration, innovation drivers, regulatory landscapes, and evolving end-user preferences, offering actionable insights for industry stakeholders. The study covers a comprehensive forecast period from 2025 to 2033, with a base year of 2025 and historical data from 2019 to 2024.
Foamers Market Concentration & Innovation
The global foamers market exhibits a moderate level of concentration, with key players like Procter & Gamble, Griot's Garage, Nelson-Jameson, Ogena Solutions Canada Corp, Vortex Industries Inc, BE POWER EQUIPMENT, Hydro Systems, Gardner Products, Albéa, Swish Maintenance Limited, and Avmor Ltd holding significant market shares. Innovation is a primary driver of market growth, with companies continuously investing in research and development to enhance product efficacy, sustainability, and user experience. Regulatory frameworks, particularly those concerning environmental impact and chemical safety, are increasingly influencing product development and market entry strategies. The availability of product substitutes, such as liquid concentrates and aerosol sprays, presents a competitive challenge, necessitating continuous product differentiation. End-user trends are shifting towards eco-friendly and high-performance foaming solutions across various applications. Mergers and acquisitions (M&A) are expected to play a crucial role in market consolidation and expansion, with estimated M&A deal values potentially reaching several million dollars, further shaping the competitive landscape.
Foamers Industry Trends & Insights
The foamers industry is poised for significant growth, driven by a confluence of factors. The increasing demand for efficient cleaning and application solutions across diverse sectors, including industrial manufacturing, food processing, and personal care, serves as a primary growth catalyst. Technological advancements are revolutionizing foam generation and dispensing technologies, leading to the development of more sophisticated and user-friendly foaming systems. This includes innovations in nozzle design, formulation chemistry, and smart dispensing capabilities, contributing to enhanced product performance and reduced material consumption. Consumer preferences are increasingly gravitating towards products that offer superior cleaning power, ease of use, and environmental sustainability. The rise of the "green cleaning" movement, coupled with growing awareness of hygiene standards, further fuels the demand for effective foaming agents. Competitive dynamics within the market are intensifying, with established players and emerging innovators vying for market share through product differentiation, strategic partnerships, and aggressive marketing campaigns. The market penetration of advanced foaming technologies is expected to witness a substantial rise, with a projected Compound Annual Growth Rate (CAGR) of approximately 6.5% over the forecast period. The chemical industry, in particular, is adopting advanced foaming solutions for enhanced process efficiency and waste reduction.
Dominant Markets & Segments in Foamers
The Chemical Industry stands out as a dominant market segment within the global foamers landscape. This dominance is propelled by the critical need for effective foaming agents in various chemical processes, including emulsification, dispersion, and reaction control. Economic policies supporting industrial growth and infrastructure development further bolster this segment. Additionally, advancements in chemical formulations are leading to the creation of specialized foamers for niche chemical applications.
- Key Drivers in the Chemical Industry:
- Increased industrial production and manufacturing activities.
- Stringent environmental regulations promoting efficient chemical usage and waste reduction.
- Growing demand for high-performance surfactants and foaming agents.
- Technological innovation in chemical processing and application.
The Food Service sector is another significant market, driven by stringent hygiene standards and the need for efficient cleaning and sanitizing solutions. The growing global food and beverage industry, coupled with rising consumer awareness regarding food safety, underpins this segment's expansion.
- Key Drivers in Food Service:
- Strict food safety and hygiene regulations.
- Increasing number of food establishments globally.
- Demand for specialized cleaning and sanitizing foams.
- Growth in the processed and packaged food industry.
In terms of product types, Industrial Grade foamers hold a substantial market share due to their widespread application in heavy-duty cleaning, manufacturing, and processing industries. The robust performance and cost-effectiveness of industrial-grade foamers make them indispensable in numerous industrial settings.
- Key Drivers for Industrial Grade Foamers:
- High demand from manufacturing and industrial sectors.
- Superior cleaning and degreasing capabilities.
- Cost-effectiveness for large-scale applications.
- Durability and performance in challenging environments.
Sanitary Grade foamers are also experiencing robust growth, particularly in healthcare, personal care, and food processing applications where hygiene is paramount. The increasing global focus on public health and personal well-being is a significant contributor to this segment's expansion.
- Key Drivers for Sanitary Grade Foamers:
- Growing emphasis on hygiene and sanitation.
- Demand from healthcare and pharmaceutical industries.
- Expansion of the personal care and cosmetics market.
- Strict regulatory requirements for sanitization.
Geographically, North America and Europe currently lead the market, driven by advanced industrial infrastructure, strong regulatory frameworks, and high consumer spending. However, the Asia Pacific region is emerging as a significant growth engine, fueled by rapid industrialization and a burgeoning middle class.
Foamers Product Developments
Recent product developments in the foamers market are characterized by an emphasis on enhanced sustainability and performance. Innovations include the formulation of biodegradable foaming agents, water-saving foaming technologies, and multi-functional foamers that combine cleaning, sanitizing, and conditioning properties. Companies are also focusing on developing foamers with improved adhesion to vertical surfaces for longer contact times and more effective cleaning. These developments aim to provide competitive advantages by offering solutions that are not only effective but also environmentally responsible and cost-efficient for end-users across sectors like automotive care and personal healthcare.
Report Scope & Segmentation Analysis
This report meticulously segments the foamers market across key applications and product types. The Application segments include the Chemical Industry, Food Service, Personal Healthcare & Cosmetics, Automotive, Furniture, and Others. The Types segmentation comprises Sanitary Grade and Industrial Grade foamers. Each segment is analyzed in detail, considering its current market size, projected growth rate, and the competitive dynamics within it. For instance, the Personal Healthcare & Cosmetics segment is expected to exhibit a CAGR of approximately 7.2% due to increasing consumer demand for premium and hygienic personal care products, with key players like Albéa driving innovation. The Automotive segment, with a projected CAGR of 5.8%, is influenced by the demand for advanced car care and detailing solutions, with companies like Griot's Garage leading product introductions.
Key Drivers of Foamers Growth
Several key factors are propelling the growth of the foamers market. Technological advancements in foaming agent formulations and dispensing systems are leading to more efficient and targeted applications. The increasing global emphasis on hygiene and sanitation across industries like food service, healthcare, and personal care directly translates to higher demand for effective foaming solutions. Furthermore, growing environmental consciousness is driving the development and adoption of eco-friendly and biodegradable foaming products. Government regulations promoting cleaner production processes and waste reduction also act as significant growth catalysts.
Challenges in the Foamers Sector
Despite its growth trajectory, the foamers sector faces several challenges. Stringent environmental regulations, while driving innovation, can also increase production costs and necessitate significant investment in R&D for compliance. Volatility in raw material prices, particularly for surfactants and other chemical components, can impact profit margins. Intense competition among established players and new entrants can lead to price wars and pressure on profitability. Furthermore, the development of effective substitutes and the potential for user error in dispensing can pose challenges to market expansion and consistent product performance.
Emerging Opportunities in Foamers
Emerging opportunities in the foamers market lie in the development of specialized, high-performance foaming solutions for niche applications. The growing demand for sustainable and bio-based foaming agents presents a significant opportunity for innovation and market differentiation. The expansion of e-commerce platforms is facilitating wider market reach for specialized foaming products. Moreover, the increasing adoption of smart dispensing technologies and IoT integration in industrial cleaning systems opens new avenues for advanced foaming applications and data-driven optimization.
Leading Players in the Foamers Market
- Procter & Gamble
- Griot's Garage
- Nelson-Jameson
- Ogena Solutions Canada Corp
- Vortex Industries Inc
- BE POWER EQUIPMENT
- Hydro Systems
- Gardner Products
- Albéa
- Swish Maintenance Limited
- Avmor Ltd
Key Developments in Foamers Industry
- January 2024: Launch of new biodegradable foaming detergent by a leading personal care company, targeting the eco-conscious consumer segment.
- November 2023: Acquisition of a specialized industrial cleaning foam manufacturer by a major chemical company to expand its product portfolio.
- July 2023: Introduction of a novel high-adhesion foaming agent for automotive detailing, offering extended contact time and superior cleaning.
- March 2023: Development of a water-saving foaming dispensing system for food service applications, reducing water consumption by xx%.
- September 2022: Rollout of a new line of industrial-grade foamers with enhanced degreasing properties for the manufacturing sector.
Strategic Outlook for Foamers Market
The strategic outlook for the foamers market remains highly positive, driven by continuous innovation, evolving consumer preferences, and increasing regulatory support for sustainable practices. The market is expected to witness sustained growth, with a strong focus on developing advanced, eco-friendly, and application-specific foaming solutions. Strategic collaborations, M&A activities, and investments in cutting-edge research and development will be crucial for players aiming to capture market share and drive future growth. The expanding applications in emerging economies and the continuous demand for effective hygiene and cleaning solutions will solidify the market's robust future potential.
Foamers Segmentation
-
1. Application
- 1.1. Chemical Industry
- 1.2. Food Service
- 1.3. Personal Healthcare & Cosmetics
- 1.4. Automotive
- 1.5. Furniture
- 1.6. Others
-
2. Types
- 2.1. Sanitary Grade
- 2.2. Industrial Grade
Foamers Segmentation By Geography
-
1. North America
- 1.1. United States
- 1.2. Canada
- 1.3. Mexico
-
2. South America
- 2.1. Brazil
- 2.2. Argentina
- 2.3. Rest of South America
-
3. Europe
- 3.1. United Kingdom
- 3.2. Germany
- 3.3. France
- 3.4. Italy
- 3.5. Spain
- 3.6. Russia
- 3.7. Benelux
- 3.8. Nordics
- 3.9. Rest of Europe
-
4. Middle East & Africa
- 4.1. Turkey
- 4.2. Israel
- 4.3. GCC
- 4.4. North Africa
- 4.5. South Africa
- 4.6. Rest of Middle East & Africa
-
5. Asia Pacific
- 5.1. China
- 5.2. India
- 5.3. Japan
- 5.4. South Korea
- 5.5. ASEAN
- 5.6. Oceania
- 5.7. Rest of Asia Pacific
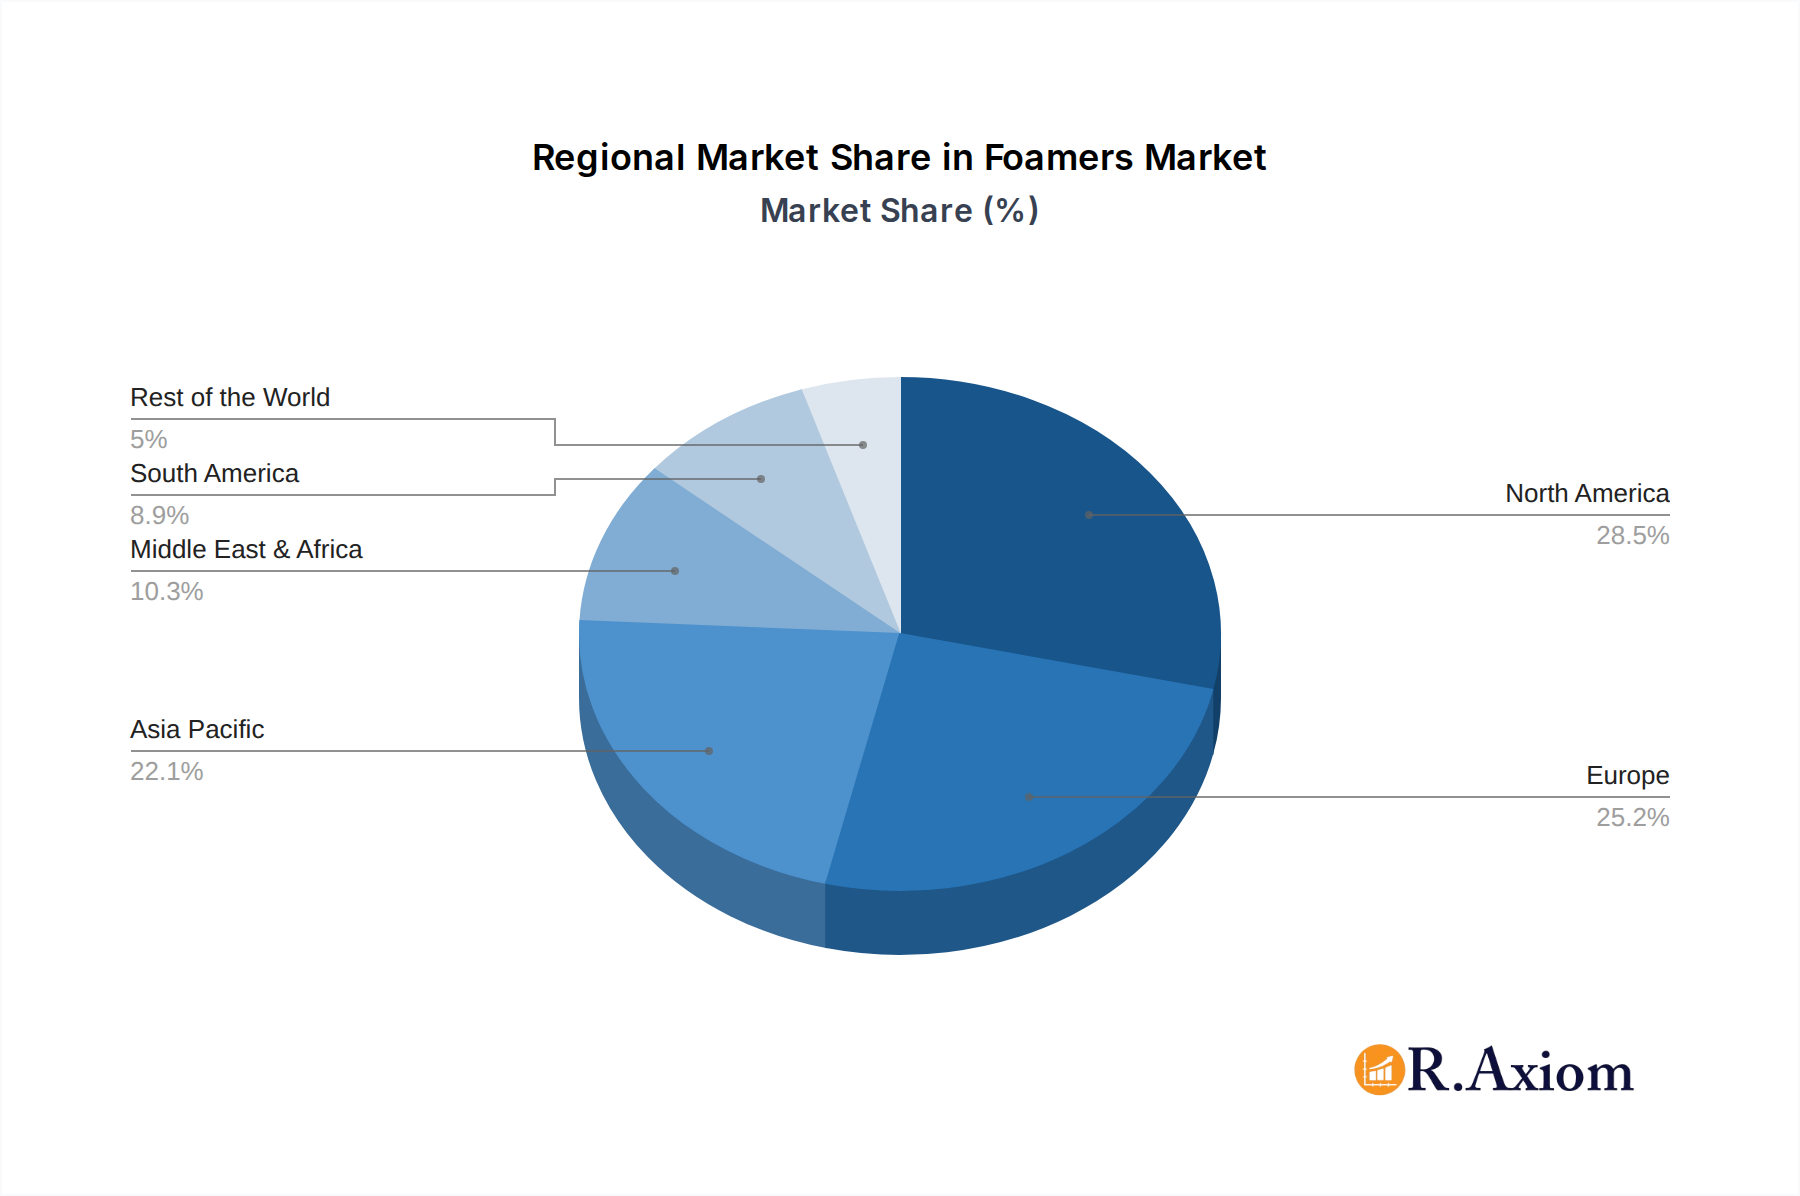
Foamers Regional Market Share
Geographic Coverage of Foamers
Foamers REPORT HIGHLIGHTS
| Aspects | Details |
|---|---|
| Study Period | 2020-2034 |
| Base Year | 2025 |
| Estimated Year | 2026 |
| Forecast Period | 2026-2034 |
| Historical Period | 2020-2025 |
| Growth Rate | CAGR of 4.1% from 2020-2034 |
| Segmentation |
|
Table of Contents
- 1. Introduction
- 1.1. Research Scope
- 1.2. Market Segmentation
- 1.3. Research Objective
- 1.4. Definitions and Assumptions
- 2. Executive Summary
- 2.1. Market Snapshot
- 3. Market Dynamics
- 3.1. Market Drivers
- 3.2. Market Restrains
- 3.3. Market Trends
- 3.4. Market Opportunities
- 4. Market Factor Analysis
- 4.1. Porters Five Forces
- 4.1.1. Bargaining Power of Suppliers
- 4.1.2. Bargaining Power of Buyers
- 4.1.3. Threat of New Entrants
- 4.1.4. Threat of Substitutes
- 4.1.5. Competitive Rivalry
- 4.2. PESTEL analysis
- 4.3. BCG Analysis
- 4.3.1. Stars (High Growth, High Market Share)
- 4.3.2. Cash Cows (Low Growth, High Market Share)
- 4.3.3. Question Mark (High Growth, Low Market Share)
- 4.3.4. Dogs (Low Growth, Low Market Share)
- 4.4. Ansoff Matrix Analysis
- 4.5. Supply Chain Analysis
- 4.6. Regulatory Landscape
- 4.7. Current Market Potential and Opportunity Assessment (TAM–SAM–SOM Framework)
- 4.8. RAX Analyst Note
- 4.1. Porters Five Forces
- 5. Market Analysis, Insights and Forecast 2021-2033
- 5.1. Market Analysis, Insights and Forecast - by Application
- 5.1.1. Chemical Industry
- 5.1.2. Food Service
- 5.1.3. Personal Healthcare & Cosmetics
- 5.1.4. Automotive
- 5.1.5. Furniture
- 5.1.6. Others
- 5.2. Market Analysis, Insights and Forecast - by Types
- 5.2.1. Sanitary Grade
- 5.2.2. Industrial Grade
- 5.3. Market Analysis, Insights and Forecast - by Region
- 5.3.1. North America
- 5.3.2. South America
- 5.3.3. Europe
- 5.3.4. Middle East & Africa
- 5.3.5. Asia Pacific
- 5.1. Market Analysis, Insights and Forecast - by Application
- 6. Global Foamers Analysis, Insights and Forecast, 2021-2033
- 6.1. Market Analysis, Insights and Forecast - by Application
- 6.1.1. Chemical Industry
- 6.1.2. Food Service
- 6.1.3. Personal Healthcare & Cosmetics
- 6.1.4. Automotive
- 6.1.5. Furniture
- 6.1.6. Others
- 6.2. Market Analysis, Insights and Forecast - by Types
- 6.2.1. Sanitary Grade
- 6.2.2. Industrial Grade
- 6.1. Market Analysis, Insights and Forecast - by Application
- 7. North America Foamers Analysis, Insights and Forecast, 2020-2032
- 7.1. Market Analysis, Insights and Forecast - by Application
- 7.1.1. Chemical Industry
- 7.1.2. Food Service
- 7.1.3. Personal Healthcare & Cosmetics
- 7.1.4. Automotive
- 7.1.5. Furniture
- 7.1.6. Others
- 7.2. Market Analysis, Insights and Forecast - by Types
- 7.2.1. Sanitary Grade
- 7.2.2. Industrial Grade
- 7.1. Market Analysis, Insights and Forecast - by Application
- 8. South America Foamers Analysis, Insights and Forecast, 2020-2032
- 8.1. Market Analysis, Insights and Forecast - by Application
- 8.1.1. Chemical Industry
- 8.1.2. Food Service
- 8.1.3. Personal Healthcare & Cosmetics
- 8.1.4. Automotive
- 8.1.5. Furniture
- 8.1.6. Others
- 8.2. Market Analysis, Insights and Forecast - by Types
- 8.2.1. Sanitary Grade
- 8.2.2. Industrial Grade
- 8.1. Market Analysis, Insights and Forecast - by Application
- 9. Europe Foamers Analysis, Insights and Forecast, 2020-2032
- 9.1. Market Analysis, Insights and Forecast - by Application
- 9.1.1. Chemical Industry
- 9.1.2. Food Service
- 9.1.3. Personal Healthcare & Cosmetics
- 9.1.4. Automotive
- 9.1.5. Furniture
- 9.1.6. Others
- 9.2. Market Analysis, Insights and Forecast - by Types
- 9.2.1. Sanitary Grade
- 9.2.2. Industrial Grade
- 9.1. Market Analysis, Insights and Forecast - by Application
- 10. Middle East & Africa Foamers Analysis, Insights and Forecast, 2020-2032
- 10.1. Market Analysis, Insights and Forecast - by Application
- 10.1.1. Chemical Industry
- 10.1.2. Food Service
- 10.1.3. Personal Healthcare & Cosmetics
- 10.1.4. Automotive
- 10.1.5. Furniture
- 10.1.6. Others
- 10.2. Market Analysis, Insights and Forecast - by Types
- 10.2.1. Sanitary Grade
- 10.2.2. Industrial Grade
- 10.1. Market Analysis, Insights and Forecast - by Application
- 11. Asia Pacific Foamers Analysis, Insights and Forecast, 2020-2032
- 11.1. Market Analysis, Insights and Forecast - by Application
- 11.1.1. Chemical Industry
- 11.1.2. Food Service
- 11.1.3. Personal Healthcare & Cosmetics
- 11.1.4. Automotive
- 11.1.5. Furniture
- 11.1.6. Others
- 11.2. Market Analysis, Insights and Forecast - by Types
- 11.2.1. Sanitary Grade
- 11.2.2. Industrial Grade
- 11.1. Market Analysis, Insights and Forecast - by Application
- 12. Competitive Analysis
- 12.1. Company Profiles
- 12.1.1 Procter & Gamble
- 12.1.1.1. Company Overview
- 12.1.1.2. Products
- 12.1.1.3. Company Financials
- 12.1.1.4. SWOT Analysis
- 12.1.2 Griot's Garage
- 12.1.2.1. Company Overview
- 12.1.2.2. Products
- 12.1.2.3. Company Financials
- 12.1.2.4. SWOT Analysis
- 12.1.3 Nelson-Jameson
- 12.1.3.1. Company Overview
- 12.1.3.2. Products
- 12.1.3.3. Company Financials
- 12.1.3.4. SWOT Analysis
- 12.1.4 Ogena Solutions Canada Corp
- 12.1.4.1. Company Overview
- 12.1.4.2. Products
- 12.1.4.3. Company Financials
- 12.1.4.4. SWOT Analysis
- 12.1.5 Vortex Industries Inc
- 12.1.5.1. Company Overview
- 12.1.5.2. Products
- 12.1.5.3. Company Financials
- 12.1.5.4. SWOT Analysis
- 12.1.6 BE POWER EQUIPMENT
- 12.1.6.1. Company Overview
- 12.1.6.2. Products
- 12.1.6.3. Company Financials
- 12.1.6.4. SWOT Analysis
- 12.1.7 Hydro Systems
- 12.1.7.1. Company Overview
- 12.1.7.2. Products
- 12.1.7.3. Company Financials
- 12.1.7.4. SWOT Analysis
- 12.1.8 Gardner Products
- 12.1.8.1. Company Overview
- 12.1.8.2. Products
- 12.1.8.3. Company Financials
- 12.1.8.4. SWOT Analysis
- 12.1.9 Albéa
- 12.1.9.1. Company Overview
- 12.1.9.2. Products
- 12.1.9.3. Company Financials
- 12.1.9.4. SWOT Analysis
- 12.1.10 Swish Maintenance Limited
- 12.1.10.1. Company Overview
- 12.1.10.2. Products
- 12.1.10.3. Company Financials
- 12.1.10.4. SWOT Analysis
- 12.1.11 Avmor Ltd
- 12.1.11.1. Company Overview
- 12.1.11.2. Products
- 12.1.11.3. Company Financials
- 12.1.11.4. SWOT Analysis
- 12.1.1 Procter & Gamble
- 12.2. Market Entropy
- 12.2.1 Company's Key Areas Served
- 12.2.2 Recent Developments
- 12.3. Company Market Share Analysis 2025
- 12.3.1 Top 5 Companies Market Share Analysis
- 12.3.2 Top 3 Companies Market Share Analysis
- 12.4. List of Potential Customers
- 13. Research Methodology
List of Figures
- Figure 1: Global Foamers Revenue Breakdown (undefined, %) by Region 2025 & 2033
- Figure 2: Global Foamers Volume Breakdown (K, %) by Region 2025 & 2033
- Figure 3: North America Foamers Revenue (undefined), by Application 2025 & 2033
- Figure 4: North America Foamers Volume (K), by Application 2025 & 2033
- Figure 5: North America Foamers Revenue Share (%), by Application 2025 & 2033
- Figure 6: North America Foamers Volume Share (%), by Application 2025 & 2033
- Figure 7: North America Foamers Revenue (undefined), by Types 2025 & 2033
- Figure 8: North America Foamers Volume (K), by Types 2025 & 2033
- Figure 9: North America Foamers Revenue Share (%), by Types 2025 & 2033
- Figure 10: North America Foamers Volume Share (%), by Types 2025 & 2033
- Figure 11: North America Foamers Revenue (undefined), by Country 2025 & 2033
- Figure 12: North America Foamers Volume (K), by Country 2025 & 2033
- Figure 13: North America Foamers Revenue Share (%), by Country 2025 & 2033
- Figure 14: North America Foamers Volume Share (%), by Country 2025 & 2033
- Figure 15: South America Foamers Revenue (undefined), by Application 2025 & 2033
- Figure 16: South America Foamers Volume (K), by Application 2025 & 2033
- Figure 17: South America Foamers Revenue Share (%), by Application 2025 & 2033
- Figure 18: South America Foamers Volume Share (%), by Application 2025 & 2033
- Figure 19: South America Foamers Revenue (undefined), by Types 2025 & 2033
- Figure 20: South America Foamers Volume (K), by Types 2025 & 2033
- Figure 21: South America Foamers Revenue Share (%), by Types 2025 & 2033
- Figure 22: South America Foamers Volume Share (%), by Types 2025 & 2033
- Figure 23: South America Foamers Revenue (undefined), by Country 2025 & 2033
- Figure 24: South America Foamers Volume (K), by Country 2025 & 2033
- Figure 25: South America Foamers Revenue Share (%), by Country 2025 & 2033
- Figure 26: South America Foamers Volume Share (%), by Country 2025 & 2033
- Figure 27: Europe Foamers Revenue (undefined), by Application 2025 & 2033
- Figure 28: Europe Foamers Volume (K), by Application 2025 & 2033
- Figure 29: Europe Foamers Revenue Share (%), by Application 2025 & 2033
- Figure 30: Europe Foamers Volume Share (%), by Application 2025 & 2033
- Figure 31: Europe Foamers Revenue (undefined), by Types 2025 & 2033
- Figure 32: Europe Foamers Volume (K), by Types 2025 & 2033
- Figure 33: Europe Foamers Revenue Share (%), by Types 2025 & 2033
- Figure 34: Europe Foamers Volume Share (%), by Types 2025 & 2033
- Figure 35: Europe Foamers Revenue (undefined), by Country 2025 & 2033
- Figure 36: Europe Foamers Volume (K), by Country 2025 & 2033
- Figure 37: Europe Foamers Revenue Share (%), by Country 2025 & 2033
- Figure 38: Europe Foamers Volume Share (%), by Country 2025 & 2033
- Figure 39: Middle East & Africa Foamers Revenue (undefined), by Application 2025 & 2033
- Figure 40: Middle East & Africa Foamers Volume (K), by Application 2025 & 2033
- Figure 41: Middle East & Africa Foamers Revenue Share (%), by Application 2025 & 2033
- Figure 42: Middle East & Africa Foamers Volume Share (%), by Application 2025 & 2033
- Figure 43: Middle East & Africa Foamers Revenue (undefined), by Types 2025 & 2033
- Figure 44: Middle East & Africa Foamers Volume (K), by Types 2025 & 2033
- Figure 45: Middle East & Africa Foamers Revenue Share (%), by Types 2025 & 2033
- Figure 46: Middle East & Africa Foamers Volume Share (%), by Types 2025 & 2033
- Figure 47: Middle East & Africa Foamers Revenue (undefined), by Country 2025 & 2033
- Figure 48: Middle East & Africa Foamers Volume (K), by Country 2025 & 2033
- Figure 49: Middle East & Africa Foamers Revenue Share (%), by Country 2025 & 2033
- Figure 50: Middle East & Africa Foamers Volume Share (%), by Country 2025 & 2033
- Figure 51: Asia Pacific Foamers Revenue (undefined), by Application 2025 & 2033
- Figure 52: Asia Pacific Foamers Volume (K), by Application 2025 & 2033
- Figure 53: Asia Pacific Foamers Revenue Share (%), by Application 2025 & 2033
- Figure 54: Asia Pacific Foamers Volume Share (%), by Application 2025 & 2033
- Figure 55: Asia Pacific Foamers Revenue (undefined), by Types 2025 & 2033
- Figure 56: Asia Pacific Foamers Volume (K), by Types 2025 & 2033
- Figure 57: Asia Pacific Foamers Revenue Share (%), by Types 2025 & 2033
- Figure 58: Asia Pacific Foamers Volume Share (%), by Types 2025 & 2033
- Figure 59: Asia Pacific Foamers Revenue (undefined), by Country 2025 & 2033
- Figure 60: Asia Pacific Foamers Volume (K), by Country 2025 & 2033
- Figure 61: Asia Pacific Foamers Revenue Share (%), by Country 2025 & 2033
- Figure 62: Asia Pacific Foamers Volume Share (%), by Country 2025 & 2033
List of Tables
- Table 1: Global Foamers Revenue undefined Forecast, by Application 2020 & 2033
- Table 2: Global Foamers Volume K Forecast, by Application 2020 & 2033
- Table 3: Global Foamers Revenue undefined Forecast, by Types 2020 & 2033
- Table 4: Global Foamers Volume K Forecast, by Types 2020 & 2033
- Table 5: Global Foamers Revenue undefined Forecast, by Region 2020 & 2033
- Table 6: Global Foamers Volume K Forecast, by Region 2020 & 2033
- Table 7: Global Foamers Revenue undefined Forecast, by Application 2020 & 2033
- Table 8: Global Foamers Volume K Forecast, by Application 2020 & 2033
- Table 9: Global Foamers Revenue undefined Forecast, by Types 2020 & 2033
- Table 10: Global Foamers Volume K Forecast, by Types 2020 & 2033
- Table 11: Global Foamers Revenue undefined Forecast, by Country 2020 & 2033
- Table 12: Global Foamers Volume K Forecast, by Country 2020 & 2033
- Table 13: United States Foamers Revenue (undefined) Forecast, by Application 2020 & 2033
- Table 14: United States Foamers Volume (K) Forecast, by Application 2020 & 2033
- Table 15: Canada Foamers Revenue (undefined) Forecast, by Application 2020 & 2033
- Table 16: Canada Foamers Volume (K) Forecast, by Application 2020 & 2033
- Table 17: Mexico Foamers Revenue (undefined) Forecast, by Application 2020 & 2033
- Table 18: Mexico Foamers Volume (K) Forecast, by Application 2020 & 2033
- Table 19: Global Foamers Revenue undefined Forecast, by Application 2020 & 2033
- Table 20: Global Foamers Volume K Forecast, by Application 2020 & 2033
- Table 21: Global Foamers Revenue undefined Forecast, by Types 2020 & 2033
- Table 22: Global Foamers Volume K Forecast, by Types 2020 & 2033
- Table 23: Global Foamers Revenue undefined Forecast, by Country 2020 & 2033
- Table 24: Global Foamers Volume K Forecast, by Country 2020 & 2033
- Table 25: Brazil Foamers Revenue (undefined) Forecast, by Application 2020 & 2033
- Table 26: Brazil Foamers Volume (K) Forecast, by Application 2020 & 2033
- Table 27: Argentina Foamers Revenue (undefined) Forecast, by Application 2020 & 2033
- Table 28: Argentina Foamers Volume (K) Forecast, by Application 2020 & 2033
- Table 29: Rest of South America Foamers Revenue (undefined) Forecast, by Application 2020 & 2033
- Table 30: Rest of South America Foamers Volume (K) Forecast, by Application 2020 & 2033
- Table 31: Global Foamers Revenue undefined Forecast, by Application 2020 & 2033
- Table 32: Global Foamers Volume K Forecast, by Application 2020 & 2033
- Table 33: Global Foamers Revenue undefined Forecast, by Types 2020 & 2033
- Table 34: Global Foamers Volume K Forecast, by Types 2020 & 2033
- Table 35: Global Foamers Revenue undefined Forecast, by Country 2020 & 2033
- Table 36: Global Foamers Volume K Forecast, by Country 2020 & 2033
- Table 37: United Kingdom Foamers Revenue (undefined) Forecast, by Application 2020 & 2033
- Table 38: United Kingdom Foamers Volume (K) Forecast, by Application 2020 & 2033
- Table 39: Germany Foamers Revenue (undefined) Forecast, by Application 2020 & 2033
- Table 40: Germany Foamers Volume (K) Forecast, by Application 2020 & 2033
- Table 41: France Foamers Revenue (undefined) Forecast, by Application 2020 & 2033
- Table 42: France Foamers Volume (K) Forecast, by Application 2020 & 2033
- Table 43: Italy Foamers Revenue (undefined) Forecast, by Application 2020 & 2033
- Table 44: Italy Foamers Volume (K) Forecast, by Application 2020 & 2033
- Table 45: Spain Foamers Revenue (undefined) Forecast, by Application 2020 & 2033
- Table 46: Spain Foamers Volume (K) Forecast, by Application 2020 & 2033
- Table 47: Russia Foamers Revenue (undefined) Forecast, by Application 2020 & 2033
- Table 48: Russia Foamers Volume (K) Forecast, by Application 2020 & 2033
- Table 49: Benelux Foamers Revenue (undefined) Forecast, by Application 2020 & 2033
- Table 50: Benelux Foamers Volume (K) Forecast, by Application 2020 & 2033
- Table 51: Nordics Foamers Revenue (undefined) Forecast, by Application 2020 & 2033
- Table 52: Nordics Foamers Volume (K) Forecast, by Application 2020 & 2033
- Table 53: Rest of Europe Foamers Revenue (undefined) Forecast, by Application 2020 & 2033
- Table 54: Rest of Europe Foamers Volume (K) Forecast, by Application 2020 & 2033
- Table 55: Global Foamers Revenue undefined Forecast, by Application 2020 & 2033
- Table 56: Global Foamers Volume K Forecast, by Application 2020 & 2033
- Table 57: Global Foamers Revenue undefined Forecast, by Types 2020 & 2033
- Table 58: Global Foamers Volume K Forecast, by Types 2020 & 2033
- Table 59: Global Foamers Revenue undefined Forecast, by Country 2020 & 2033
- Table 60: Global Foamers Volume K Forecast, by Country 2020 & 2033
- Table 61: Turkey Foamers Revenue (undefined) Forecast, by Application 2020 & 2033
- Table 62: Turkey Foamers Volume (K) Forecast, by Application 2020 & 2033
- Table 63: Israel Foamers Revenue (undefined) Forecast, by Application 2020 & 2033
- Table 64: Israel Foamers Volume (K) Forecast, by Application 2020 & 2033
- Table 65: GCC Foamers Revenue (undefined) Forecast, by Application 2020 & 2033
- Table 66: GCC Foamers Volume (K) Forecast, by Application 2020 & 2033
- Table 67: North Africa Foamers Revenue (undefined) Forecast, by Application 2020 & 2033
- Table 68: North Africa Foamers Volume (K) Forecast, by Application 2020 & 2033
- Table 69: South Africa Foamers Revenue (undefined) Forecast, by Application 2020 & 2033
- Table 70: South Africa Foamers Volume (K) Forecast, by Application 2020 & 2033
- Table 71: Rest of Middle East & Africa Foamers Revenue (undefined) Forecast, by Application 2020 & 2033
- Table 72: Rest of Middle East & Africa Foamers Volume (K) Forecast, by Application 2020 & 2033
- Table 73: Global Foamers Revenue undefined Forecast, by Application 2020 & 2033
- Table 74: Global Foamers Volume K Forecast, by Application 2020 & 2033
- Table 75: Global Foamers Revenue undefined Forecast, by Types 2020 & 2033
- Table 76: Global Foamers Volume K Forecast, by Types 2020 & 2033
- Table 77: Global Foamers Revenue undefined Forecast, by Country 2020 & 2033
- Table 78: Global Foamers Volume K Forecast, by Country 2020 & 2033
- Table 79: China Foamers Revenue (undefined) Forecast, by Application 2020 & 2033
- Table 80: China Foamers Volume (K) Forecast, by Application 2020 & 2033
- Table 81: India Foamers Revenue (undefined) Forecast, by Application 2020 & 2033
- Table 82: India Foamers Volume (K) Forecast, by Application 2020 & 2033
- Table 83: Japan Foamers Revenue (undefined) Forecast, by Application 2020 & 2033
- Table 84: Japan Foamers Volume (K) Forecast, by Application 2020 & 2033
- Table 85: South Korea Foamers Revenue (undefined) Forecast, by Application 2020 & 2033
- Table 86: South Korea Foamers Volume (K) Forecast, by Application 2020 & 2033
- Table 87: ASEAN Foamers Revenue (undefined) Forecast, by Application 2020 & 2033
- Table 88: ASEAN Foamers Volume (K) Forecast, by Application 2020 & 2033
- Table 89: Oceania Foamers Revenue (undefined) Forecast, by Application 2020 & 2033
- Table 90: Oceania Foamers Volume (K) Forecast, by Application 2020 & 2033
- Table 91: Rest of Asia Pacific Foamers Revenue (undefined) Forecast, by Application 2020 & 2033
- Table 92: Rest of Asia Pacific Foamers Volume (K) Forecast, by Application 2020 & 2033
Frequently Asked Questions
1. What is the projected Compound Annual Growth Rate (CAGR) of the Foamers?
The projected CAGR is approximately 4.1%.
2. Which companies are prominent players in the Foamers?
Key companies in the market include Procter & Gamble, Griot's Garage, Nelson-Jameson, Ogena Solutions Canada Corp, Vortex Industries Inc, BE POWER EQUIPMENT, Hydro Systems, Gardner Products, Albéa, Swish Maintenance Limited, Avmor Ltd.
3. What are the main segments of the Foamers?
The market segments include Application, Types.
4. Can you provide details about the market size?
The market size is estimated to be USD XXX N/A as of 2022.
5. What are some drivers contributing to market growth?
N/A
6. What are the notable trends driving market growth?
N/A
7. Are there any restraints impacting market growth?
N/A
8. Can you provide examples of recent developments in the market?
N/A
9. What pricing options are available for accessing the report?
Pricing options include single-user, multi-user, and enterprise licenses priced at USD 3350.00, USD 5025.00, and USD 6700.00 respectively.
10. Is the market size provided in terms of value or volume?
The market size is provided in terms of value, measured in N/A and volume, measured in K.
11. Are there any specific market keywords associated with the report?
Yes, the market keyword associated with the report is "Foamers," which aids in identifying and referencing the specific market segment covered.
12. How do I determine which pricing option suits my needs best?
The pricing options vary based on user requirements and access needs. Individual users may opt for single-user licenses, while businesses requiring broader access may choose multi-user or enterprise licenses for cost-effective access to the report.
13. Are there any additional resources or data provided in the Foamers report?
While the report offers comprehensive insights, it's advisable to review the specific contents or supplementary materials provided to ascertain if additional resources or data are available.
14. How can I stay updated on further developments or reports in the Foamers?
To stay informed about further developments, trends, and reports in the Foamers, consider subscribing to industry newsletters, following relevant companies and organizations, or regularly checking reputable industry news sources and publications.
Methodology
Step 1 - Identification of Relevant Samples Size from Population Database


Step 2 - Approaches for Defining Global Market Size (Value, Volume* & Price*)

Note*: In applicable scenarios
Step 3 - Data Sources
Primary Research
- Web Analytics
- Survey Reports
- Research Institute
- Latest Research Reports
- Opinion Leaders
Secondary Research
- Annual Reports
- White Paper
- Latest Press Release
- Industry Association
- Paid Database
- Investor Presentations

Step 4 - Data Triangulation
Involves using different sources of information in order to increase the validity of a study
These sources are likely to be stakeholders in a program - participants, other researchers, program staff, other community members, and so on.
Then we put all data in single framework & apply various statistical tools to find out the dynamic on the market.
During the analysis stage, feedback from the stakeholder groups would be compared to determine areas of agreement as well as areas of divergence