
Key Insights
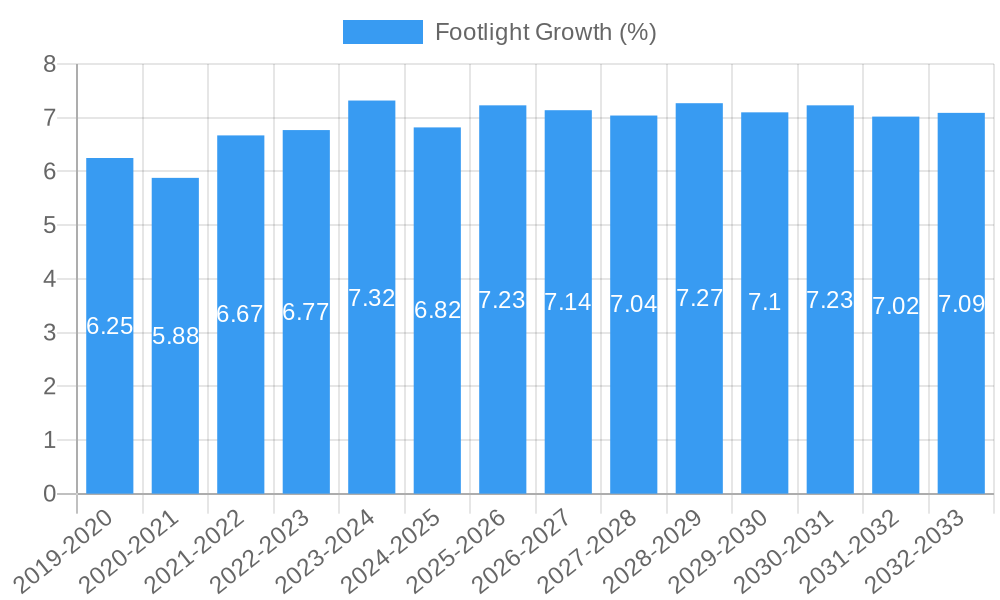
The global Footlight market is poised for significant expansion, projected to reach a substantial market size of approximately $2,500 million by 2025. This growth is fueled by a compelling Compound Annual Growth Rate (CAGR) of around 7.5%, indicating a robust and sustained upward trajectory through 2033. Key drivers of this expansion include the increasing demand for enhanced safety and aesthetic lighting solutions across diverse applications, from illuminating hotel corridors and hospital wards to beautifying city squares and residential spaces. The burgeoning smart home and building automation trends further bolster market prospects, as footlights are increasingly integrated into connected lighting systems for convenience and energy efficiency. Technological advancements, such as the widespread adoption of energy-efficient LED technology and the development of smart, sensor-activated footlights, are also contributing to market vitality.
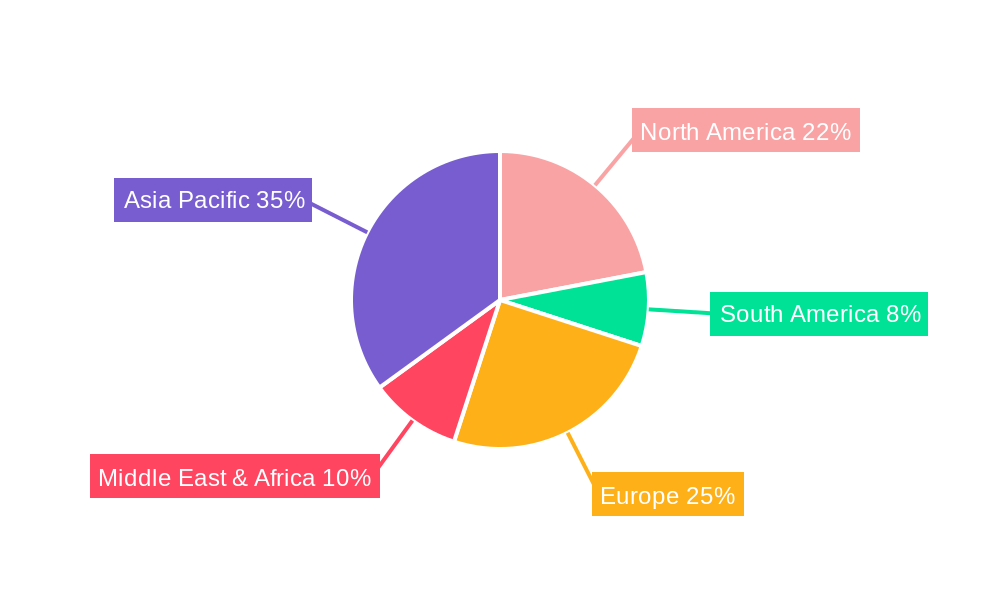
The market is segmented into two primary types: Induction Footlights and Non-induction Footlights. While both play crucial roles, induction footlights, offering enhanced features and longevity, are likely to witness a higher adoption rate in premium applications. The market is also characterized by a dynamic competitive landscape featuring prominent players like Philips, Legrand, Panasonic, and Cree, among others, who are actively innovating and expanding their product portfolios. Geographically, the Asia Pacific region, led by China and India, is expected to emerge as a dominant force due to rapid urbanization, infrastructure development, and a growing middle class with increasing disposable income. North America and Europe also represent significant markets, driven by stringent safety regulations and a strong emphasis on interior design and architectural lighting. Despite strong growth prospects, potential restraints such as the initial cost of installation for advanced systems and the availability of cheaper, less sophisticated alternatives in some segments could pose challenges.
Comprehensive Footlight Market Report: Analysis, Trends, and Strategic Outlook (2019–2033)
This in-depth report provides a comprehensive analysis of the global Footlight market, offering critical insights into its dynamics, growth trajectories, and future potential. Spanning the historical period of 2019–2024, with a base year of 2025 and an extensive forecast period extending to 2033, this study is designed to equip industry stakeholders with actionable intelligence for strategic decision-making. We delve into market concentration, technological innovations, evolving trends, dominant segments, key players, and emerging opportunities, providing a complete understanding of the Footlight landscape.
Footlight Market Concentration & Innovation
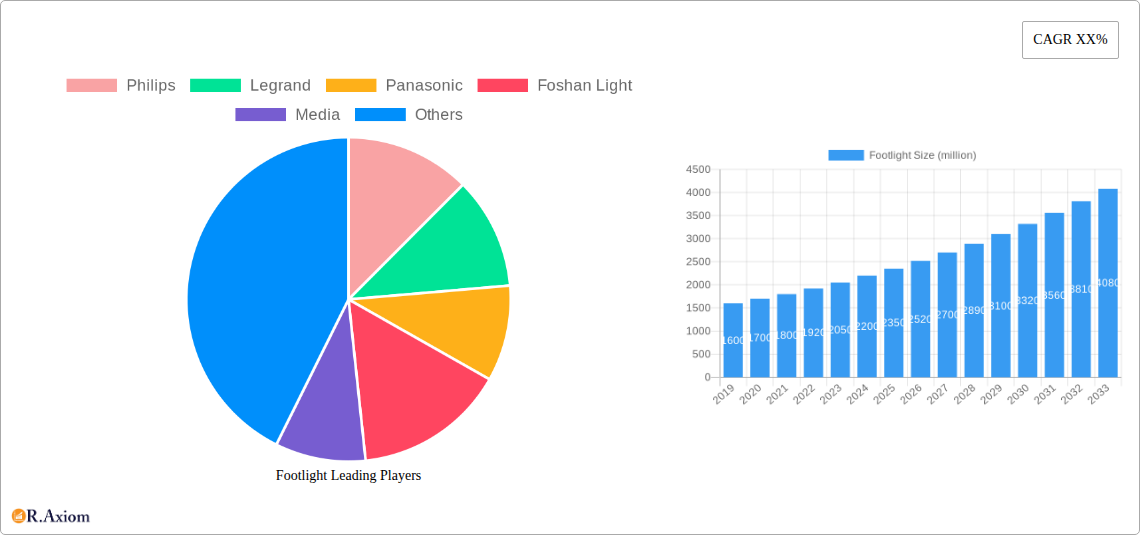
The global Footlight market exhibits a moderate concentration, with key players investing significantly in innovation to gain a competitive edge. Leading companies are focusing on developing energy-efficient, durable, and aesthetically pleasing footlight solutions. Regulatory frameworks, particularly concerning energy consumption and safety standards, are increasingly influencing product development and market entry. Product substitutes, such as integrated lighting solutions and advanced LED technologies in broader architectural lighting, pose a growing challenge. End-user trends are shifting towards smart, connected lighting systems that offer enhanced functionality and user experience. Mergers and acquisitions (M&A) are playing a role in market consolidation, with deal values estimated to be in the hundreds of millions. Innovation drivers include advancements in LED technology, material science, and smart home integration, pushing the market towards more sophisticated and sustainable offerings. The market share of the top five players is estimated at XX million USD.
Footlight Industry Trends & Insights
The Footlight industry is poised for significant growth, driven by an increasing demand for enhanced safety, aesthetic appeal, and energy efficiency in various applications. The market is projected to witness a Compound Annual Growth Rate (CAGR) of approximately XX% during the forecast period (2025–2033). Technological disruptions, primarily the widespread adoption of energy-efficient LED technology, are revolutionizing the footlight landscape. This shift from traditional lighting sources to advanced LED footlights is not only reducing energy consumption but also offering longer lifespans and superior illumination quality. Consumer preferences are increasingly leaning towards smart and connected lighting solutions that can be integrated into broader building management systems. These smart footlights offer features like motion sensing, dimming capabilities, and customizable color temperatures, enhancing user convenience and safety. Competitive dynamics are characterized by intense innovation, with companies striving to differentiate themselves through unique designs, advanced functionalities, and cost-effectiveness. Market penetration of advanced footlight solutions is expected to rise substantially as awareness of their benefits grows and installation costs become more accessible. The global market size is projected to reach XX million USD by 2033.
Dominant Markets & Segments in Footlight
The Hospital segment is a dominant force in the global Footlight market, driven by the critical need for reliable and safe illumination in healthcare environments. Key drivers for this dominance include stringent safety regulations requiring clear pathway identification, the need for patient comfort and reduced light pollution at night, and the growing investment in modern healthcare infrastructure. Economic policies supporting healthcare development and infrastructure upgrades further bolster this segment. The Residential segment is also experiencing robust growth, fueled by the increasing consumer demand for enhanced home aesthetics, safety features like stair lighting, and the integration of smart home technology. The City Square application segment is another significant contributor, where footlights play a crucial role in public safety, urban beautification, and the creation of inviting public spaces. Government initiatives focused on urban development, smart city projects, and tourism promotion are key drivers.
Application Dominance:
- Hospital: High demand for safety, patient care, and compliance with healthcare standards. Key drivers include government healthcare spending and infrastructure modernization. Market share estimated at XX million USD.
- Residential: Driven by aesthetic appeal, home safety, and smart home integration. Growing disposable incomes and urbanization contribute to this segment's expansion.
- City Square: Fueled by urban development, public safety initiatives, and smart city projects. Economic policies promoting tourism and public space enhancement are critical.
- Others (e.g., Commercial Buildings, Hotels): Significant growth potential due to evolving architectural designs and the demand for ambient and functional lighting.
Type Dominance:
- Non-induction Footlight: Currently holds a larger market share due to its cost-effectiveness and widespread availability. Its simplicity and reliability make it a preferred choice for many applications. However, the market share is steadily decreasing year on year.
- Induction Footlight: Gaining traction due to its energy efficiency, longer lifespan, and enhanced performance, particularly in high-traffic or demanding environments. Advancements in induction technology are making it more competitive. Market share is expected to grow substantially.
Footlight Product Developments
Recent product developments in the Footlight market are characterized by a strong emphasis on energy efficiency, smart integration, and enhanced user experience. Manufacturers are introducing advanced LED footlights with sophisticated control systems, including motion sensors and dimming capabilities, for optimized energy consumption and personalized illumination. Innovations in materials science are leading to more durable, weather-resistant, and aesthetically versatile footlight designs. These advancements offer significant competitive advantages by catering to diverse application needs, from subtle pathway lighting in residential areas to robust illumination in public spaces. The focus on sustainability and smart technology integration is a key trend shaping the future of footlight products, ensuring better market fit and higher end-user satisfaction.
Report Scope & Segmentation Analysis
This report provides a granular segmentation of the global Footlight market across key application and type categories.
Application Segments:
- Hotel: Characterized by the need for aesthetic ambiance and enhanced guest experience. Projected market size of XX million USD by 2033, with a CAGR of XX%.
- Hospital: Driven by stringent safety regulations and patient well-being. Projected market size of XX million USD by 2033, with a CAGR of XX%.
- City Square: Focus on public safety, urban aesthetics, and smart city integration. Projected market size of XX million USD by 2033, with a CAGR of XX%.
- Residential: Demand for safety, aesthetics, and smart home convenience. Projected market size of XX million USD by 2033, with a CAGR of XX%.
- Others: Encompasses commercial buildings, public infrastructure, and specialized applications, offering diverse growth opportunities. Projected market size of XX million USD by 2033, with a CAGR of XX%.
Type Segments:
- Induction Footlight: Witnessing significant growth due to its energy efficiency and durability. Projected market size of XX million USD by 2033, with a CAGR of XX%.
- Non-induction Footlight: Still holds a considerable market share but is expected to see a gradual decline as induction technologies advance. Projected market size of XX million USD by 2033, with a CAGR of XX%.
Key Drivers of Footlight Growth
Several factors are propelling the growth of the Footlight market. Technological advancements, particularly in LED efficiency and smart lighting integration, are making footlights more desirable. The increasing global focus on energy conservation and sustainability is driving the adoption of energy-efficient lighting solutions. Furthermore, a growing emphasis on public safety and security in urban and residential areas necessitates effective pathway illumination. Economic growth, leading to increased construction and renovation activities, also contributes significantly. Regulatory support for energy-efficient lighting and smart city initiatives further fuels market expansion.
Challenges in the Footlight Sector
Despite the promising growth trajectory, the Footlight sector faces certain challenges. Intense price competition among manufacturers, especially for standard non-induction footlights, can impact profit margins. Evolving regulatory landscapes and the need for continuous compliance with safety and energy standards can be a burden for smaller players. Supply chain disruptions, as witnessed in recent years, can affect the availability and cost of raw materials and components. The initial investment cost for advanced induction and smart footlights can also be a barrier for some end-users, limiting market penetration in certain price-sensitive segments.
Emerging Opportunities in Footlight
The Footlight market presents several emerging opportunities. The increasing adoption of smart home technologies creates a strong demand for integrated smart footlights that can be controlled remotely and offer personalized lighting experiences. The growing trend of sustainable urban development and smart city initiatives opens up significant opportunities for energy-efficient and aesthetically pleasing footlight solutions in public spaces. Furthermore, the expansion of the hospitality sector and the continuous need for modernization in hotels present a substantial market for decorative and functional footlights. The development of innovative designs that cater to specific architectural styles and user needs also represents a key growth avenue.
Leading Players in the Footlight Market
- Philips
- Legrand
- Panasonic
- Foshan Light
- Media
- Bull Group
- Kingsun
- Delixi Electric
- Havells India Limited
- Cree
- Keey
- Savia Electric
- Opple
- TCL
Key Developments in Footlight Industry
- 2023: Philips launched a new range of smart LED footlights with integrated motion sensing technology, enhancing energy efficiency and user convenience.
- 2023: Legrand expanded its smart home lighting solutions, introducing Wi-Fi enabled footlights for seamless integration with existing home automation systems.
- 2022: Panasonic introduced eco-friendly footlights made from recycled materials, aligning with growing sustainability concerns.
- 2022: Havells India Limited invested in R&D for advanced induction footlight technology to cater to the growing demand for energy-efficient solutions in India.
- 2021: Cree announced breakthroughs in high-efficiency LED chip technology, promising further reductions in energy consumption for footlights.
- 2021: Opple showcased its latest designs for decorative and functional footlights aimed at the hospitality and residential sectors.
- 2020: Delixi Electric focused on developing robust and durable footlights for public infrastructure projects.
Strategic Outlook for Footlight Market
The strategic outlook for the Footlight market is highly positive, driven by innovation, sustainability, and the growing demand for enhanced safety and aesthetics. The continued evolution of LED technology, coupled with the integration of smart capabilities, will be pivotal in shaping future market growth. Manufacturers who can effectively leverage these trends by offering energy-efficient, connected, and aesthetically diverse solutions are well-positioned for success. Strategic partnerships and collaborations, particularly in the smart home and smart city ecosystems, will further amplify market reach and influence. The focus on product differentiation, cost optimization, and addressing specific end-user needs will remain crucial for sustained market leadership.
Footlight Segmentation
-
1. Application
- 1.1. Hotel
- 1.2. Hospital
- 1.3. City Square
- 1.4. Residential
- 1.5. Others
-
2. Types
- 2.1. Induction Footlight
- 2.2. Non-induction Footlight
Footlight Segmentation By Geography
-
1. North America
- 1.1. United States
- 1.2. Canada
- 1.3. Mexico
-
2. South America
- 2.1. Brazil
- 2.2. Argentina
- 2.3. Rest of South America
-
3. Europe
- 3.1. United Kingdom
- 3.2. Germany
- 3.3. France
- 3.4. Italy
- 3.5. Spain
- 3.6. Russia
- 3.7. Benelux
- 3.8. Nordics
- 3.9. Rest of Europe
-
4. Middle East & Africa
- 4.1. Turkey
- 4.2. Israel
- 4.3. GCC
- 4.4. North Africa
- 4.5. South Africa
- 4.6. Rest of Middle East & Africa
-
5. Asia Pacific
- 5.1. China
- 5.2. India
- 5.3. Japan
- 5.4. South Korea
- 5.5. ASEAN
- 5.6. Oceania
- 5.7. Rest of Asia Pacific
Footlight REPORT HIGHLIGHTS
| Aspects | Details |
|---|---|
| Study Period | 2019-2033 |
| Base Year | 2024 |
| Estimated Year | 2025 |
| Forecast Period | 2025-2033 |
| Historical Period | 2019-2024 |
| Growth Rate | CAGR of XX% from 2019-2033 |
| Segmentation |
|
Table of Contents
- 1. Introduction
- 1.1. Research Scope
- 1.2. Market Segmentation
- 1.3. Research Methodology
- 1.4. Definitions and Assumptions
- 2. Executive Summary
- 2.1. Introduction
- 3. Market Dynamics
- 3.1. Introduction
- 3.2. Market Drivers
- 3.3. Market Restrains
- 3.4. Market Trends
- 4. Market Factor Analysis
- 4.1. Porters Five Forces
- 4.2. Supply/Value Chain
- 4.3. PESTEL analysis
- 4.4. Market Entropy
- 4.5. Patent/Trademark Analysis
- 5. Global Footlight Analysis, Insights and Forecast, 2019-2031
- 5.1. Market Analysis, Insights and Forecast - by Application
- 5.1.1. Hotel
- 5.1.2. Hospital
- 5.1.3. City Square
- 5.1.4. Residential
- 5.1.5. Others
- 5.2. Market Analysis, Insights and Forecast - by Types
- 5.2.1. Induction Footlight
- 5.2.2. Non-induction Footlight
- 5.3. Market Analysis, Insights and Forecast - by Region
- 5.3.1. North America
- 5.3.2. South America
- 5.3.3. Europe
- 5.3.4. Middle East & Africa
- 5.3.5. Asia Pacific
- 5.1. Market Analysis, Insights and Forecast - by Application
- 6. North America Footlight Analysis, Insights and Forecast, 2019-2031
- 6.1. Market Analysis, Insights and Forecast - by Application
- 6.1.1. Hotel
- 6.1.2. Hospital
- 6.1.3. City Square
- 6.1.4. Residential
- 6.1.5. Others
- 6.2. Market Analysis, Insights and Forecast - by Types
- 6.2.1. Induction Footlight
- 6.2.2. Non-induction Footlight
- 6.1. Market Analysis, Insights and Forecast - by Application
- 7. South America Footlight Analysis, Insights and Forecast, 2019-2031
- 7.1. Market Analysis, Insights and Forecast - by Application
- 7.1.1. Hotel
- 7.1.2. Hospital
- 7.1.3. City Square
- 7.1.4. Residential
- 7.1.5. Others
- 7.2. Market Analysis, Insights and Forecast - by Types
- 7.2.1. Induction Footlight
- 7.2.2. Non-induction Footlight
- 7.1. Market Analysis, Insights and Forecast - by Application
- 8. Europe Footlight Analysis, Insights and Forecast, 2019-2031
- 8.1. Market Analysis, Insights and Forecast - by Application
- 8.1.1. Hotel
- 8.1.2. Hospital
- 8.1.3. City Square
- 8.1.4. Residential
- 8.1.5. Others
- 8.2. Market Analysis, Insights and Forecast - by Types
- 8.2.1. Induction Footlight
- 8.2.2. Non-induction Footlight
- 8.1. Market Analysis, Insights and Forecast - by Application
- 9. Middle East & Africa Footlight Analysis, Insights and Forecast, 2019-2031
- 9.1. Market Analysis, Insights and Forecast - by Application
- 9.1.1. Hotel
- 9.1.2. Hospital
- 9.1.3. City Square
- 9.1.4. Residential
- 9.1.5. Others
- 9.2. Market Analysis, Insights and Forecast - by Types
- 9.2.1. Induction Footlight
- 9.2.2. Non-induction Footlight
- 9.1. Market Analysis, Insights and Forecast - by Application
- 10. Asia Pacific Footlight Analysis, Insights and Forecast, 2019-2031
- 10.1. Market Analysis, Insights and Forecast - by Application
- 10.1.1. Hotel
- 10.1.2. Hospital
- 10.1.3. City Square
- 10.1.4. Residential
- 10.1.5. Others
- 10.2. Market Analysis, Insights and Forecast - by Types
- 10.2.1. Induction Footlight
- 10.2.2. Non-induction Footlight
- 10.1. Market Analysis, Insights and Forecast - by Application
- 11. Competitive Analysis
- 11.1. Global Market Share Analysis 2024
- 11.2. Company Profiles
- 11.2.1 Philips
- 11.2.1.1. Overview
- 11.2.1.2. Products
- 11.2.1.3. SWOT Analysis
- 11.2.1.4. Recent Developments
- 11.2.1.5. Financials (Based on Availability)
- 11.2.2 Legrand
- 11.2.2.1. Overview
- 11.2.2.2. Products
- 11.2.2.3. SWOT Analysis
- 11.2.2.4. Recent Developments
- 11.2.2.5. Financials (Based on Availability)
- 11.2.3 Panasonic
- 11.2.3.1. Overview
- 11.2.3.2. Products
- 11.2.3.3. SWOT Analysis
- 11.2.3.4. Recent Developments
- 11.2.3.5. Financials (Based on Availability)
- 11.2.4 Foshan Light
- 11.2.4.1. Overview
- 11.2.4.2. Products
- 11.2.4.3. SWOT Analysis
- 11.2.4.4. Recent Developments
- 11.2.4.5. Financials (Based on Availability)
- 11.2.5 Media
- 11.2.5.1. Overview
- 11.2.5.2. Products
- 11.2.5.3. SWOT Analysis
- 11.2.5.4. Recent Developments
- 11.2.5.5. Financials (Based on Availability)
- 11.2.6 Bull Group
- 11.2.6.1. Overview
- 11.2.6.2. Products
- 11.2.6.3. SWOT Analysis
- 11.2.6.4. Recent Developments
- 11.2.6.5. Financials (Based on Availability)
- 11.2.7 Kingsun
- 11.2.7.1. Overview
- 11.2.7.2. Products
- 11.2.7.3. SWOT Analysis
- 11.2.7.4. Recent Developments
- 11.2.7.5. Financials (Based on Availability)
- 11.2.8 Delixi Electric
- 11.2.8.1. Overview
- 11.2.8.2. Products
- 11.2.8.3. SWOT Analysis
- 11.2.8.4. Recent Developments
- 11.2.8.5. Financials (Based on Availability)
- 11.2.9 Havells India Limited
- 11.2.9.1. Overview
- 11.2.9.2. Products
- 11.2.9.3. SWOT Analysis
- 11.2.9.4. Recent Developments
- 11.2.9.5. Financials (Based on Availability)
- 11.2.10 Cree
- 11.2.10.1. Overview
- 11.2.10.2. Products
- 11.2.10.3. SWOT Analysis
- 11.2.10.4. Recent Developments
- 11.2.10.5. Financials (Based on Availability)
- 11.2.11 Keey
- 11.2.11.1. Overview
- 11.2.11.2. Products
- 11.2.11.3. SWOT Analysis
- 11.2.11.4. Recent Developments
- 11.2.11.5. Financials (Based on Availability)
- 11.2.12 Savia Electric
- 11.2.12.1. Overview
- 11.2.12.2. Products
- 11.2.12.3. SWOT Analysis
- 11.2.12.4. Recent Developments
- 11.2.12.5. Financials (Based on Availability)
- 11.2.13 Opple
- 11.2.13.1. Overview
- 11.2.13.2. Products
- 11.2.13.3. SWOT Analysis
- 11.2.13.4. Recent Developments
- 11.2.13.5. Financials (Based on Availability)
- 11.2.14 TCL
- 11.2.14.1. Overview
- 11.2.14.2. Products
- 11.2.14.3. SWOT Analysis
- 11.2.14.4. Recent Developments
- 11.2.14.5. Financials (Based on Availability)
- 11.2.1 Philips
List of Figures
- Figure 1: Global Footlight Revenue Breakdown (million, %) by Region 2024 & 2032
- Figure 2: North America Footlight Revenue (million), by Application 2024 & 2032
- Figure 3: North America Footlight Revenue Share (%), by Application 2024 & 2032
- Figure 4: North America Footlight Revenue (million), by Types 2024 & 2032
- Figure 5: North America Footlight Revenue Share (%), by Types 2024 & 2032
- Figure 6: North America Footlight Revenue (million), by Country 2024 & 2032
- Figure 7: North America Footlight Revenue Share (%), by Country 2024 & 2032
- Figure 8: South America Footlight Revenue (million), by Application 2024 & 2032
- Figure 9: South America Footlight Revenue Share (%), by Application 2024 & 2032
- Figure 10: South America Footlight Revenue (million), by Types 2024 & 2032
- Figure 11: South America Footlight Revenue Share (%), by Types 2024 & 2032
- Figure 12: South America Footlight Revenue (million), by Country 2024 & 2032
- Figure 13: South America Footlight Revenue Share (%), by Country 2024 & 2032
- Figure 14: Europe Footlight Revenue (million), by Application 2024 & 2032
- Figure 15: Europe Footlight Revenue Share (%), by Application 2024 & 2032
- Figure 16: Europe Footlight Revenue (million), by Types 2024 & 2032
- Figure 17: Europe Footlight Revenue Share (%), by Types 2024 & 2032
- Figure 18: Europe Footlight Revenue (million), by Country 2024 & 2032
- Figure 19: Europe Footlight Revenue Share (%), by Country 2024 & 2032
- Figure 20: Middle East & Africa Footlight Revenue (million), by Application 2024 & 2032
- Figure 21: Middle East & Africa Footlight Revenue Share (%), by Application 2024 & 2032
- Figure 22: Middle East & Africa Footlight Revenue (million), by Types 2024 & 2032
- Figure 23: Middle East & Africa Footlight Revenue Share (%), by Types 2024 & 2032
- Figure 24: Middle East & Africa Footlight Revenue (million), by Country 2024 & 2032
- Figure 25: Middle East & Africa Footlight Revenue Share (%), by Country 2024 & 2032
- Figure 26: Asia Pacific Footlight Revenue (million), by Application 2024 & 2032
- Figure 27: Asia Pacific Footlight Revenue Share (%), by Application 2024 & 2032
- Figure 28: Asia Pacific Footlight Revenue (million), by Types 2024 & 2032
- Figure 29: Asia Pacific Footlight Revenue Share (%), by Types 2024 & 2032
- Figure 30: Asia Pacific Footlight Revenue (million), by Country 2024 & 2032
- Figure 31: Asia Pacific Footlight Revenue Share (%), by Country 2024 & 2032
List of Tables
- Table 1: Global Footlight Revenue million Forecast, by Region 2019 & 2032
- Table 2: Global Footlight Revenue million Forecast, by Application 2019 & 2032
- Table 3: Global Footlight Revenue million Forecast, by Types 2019 & 2032
- Table 4: Global Footlight Revenue million Forecast, by Region 2019 & 2032
- Table 5: Global Footlight Revenue million Forecast, by Application 2019 & 2032
- Table 6: Global Footlight Revenue million Forecast, by Types 2019 & 2032
- Table 7: Global Footlight Revenue million Forecast, by Country 2019 & 2032
- Table 8: United States Footlight Revenue (million) Forecast, by Application 2019 & 2032
- Table 9: Canada Footlight Revenue (million) Forecast, by Application 2019 & 2032
- Table 10: Mexico Footlight Revenue (million) Forecast, by Application 2019 & 2032
- Table 11: Global Footlight Revenue million Forecast, by Application 2019 & 2032
- Table 12: Global Footlight Revenue million Forecast, by Types 2019 & 2032
- Table 13: Global Footlight Revenue million Forecast, by Country 2019 & 2032
- Table 14: Brazil Footlight Revenue (million) Forecast, by Application 2019 & 2032
- Table 15: Argentina Footlight Revenue (million) Forecast, by Application 2019 & 2032
- Table 16: Rest of South America Footlight Revenue (million) Forecast, by Application 2019 & 2032
- Table 17: Global Footlight Revenue million Forecast, by Application 2019 & 2032
- Table 18: Global Footlight Revenue million Forecast, by Types 2019 & 2032
- Table 19: Global Footlight Revenue million Forecast, by Country 2019 & 2032
- Table 20: United Kingdom Footlight Revenue (million) Forecast, by Application 2019 & 2032
- Table 21: Germany Footlight Revenue (million) Forecast, by Application 2019 & 2032
- Table 22: France Footlight Revenue (million) Forecast, by Application 2019 & 2032
- Table 23: Italy Footlight Revenue (million) Forecast, by Application 2019 & 2032
- Table 24: Spain Footlight Revenue (million) Forecast, by Application 2019 & 2032
- Table 25: Russia Footlight Revenue (million) Forecast, by Application 2019 & 2032
- Table 26: Benelux Footlight Revenue (million) Forecast, by Application 2019 & 2032
- Table 27: Nordics Footlight Revenue (million) Forecast, by Application 2019 & 2032
- Table 28: Rest of Europe Footlight Revenue (million) Forecast, by Application 2019 & 2032
- Table 29: Global Footlight Revenue million Forecast, by Application 2019 & 2032
- Table 30: Global Footlight Revenue million Forecast, by Types 2019 & 2032
- Table 31: Global Footlight Revenue million Forecast, by Country 2019 & 2032
- Table 32: Turkey Footlight Revenue (million) Forecast, by Application 2019 & 2032
- Table 33: Israel Footlight Revenue (million) Forecast, by Application 2019 & 2032
- Table 34: GCC Footlight Revenue (million) Forecast, by Application 2019 & 2032
- Table 35: North Africa Footlight Revenue (million) Forecast, by Application 2019 & 2032
- Table 36: South Africa Footlight Revenue (million) Forecast, by Application 2019 & 2032
- Table 37: Rest of Middle East & Africa Footlight Revenue (million) Forecast, by Application 2019 & 2032
- Table 38: Global Footlight Revenue million Forecast, by Application 2019 & 2032
- Table 39: Global Footlight Revenue million Forecast, by Types 2019 & 2032
- Table 40: Global Footlight Revenue million Forecast, by Country 2019 & 2032
- Table 41: China Footlight Revenue (million) Forecast, by Application 2019 & 2032
- Table 42: India Footlight Revenue (million) Forecast, by Application 2019 & 2032
- Table 43: Japan Footlight Revenue (million) Forecast, by Application 2019 & 2032
- Table 44: South Korea Footlight Revenue (million) Forecast, by Application 2019 & 2032
- Table 45: ASEAN Footlight Revenue (million) Forecast, by Application 2019 & 2032
- Table 46: Oceania Footlight Revenue (million) Forecast, by Application 2019 & 2032
- Table 47: Rest of Asia Pacific Footlight Revenue (million) Forecast, by Application 2019 & 2032
Frequently Asked Questions
1. What is the projected Compound Annual Growth Rate (CAGR) of the Footlight?
The projected CAGR is approximately XX%.
2. Which companies are prominent players in the Footlight?
Key companies in the market include Philips, Legrand, Panasonic, Foshan Light, Media, Bull Group, Kingsun, Delixi Electric, Havells India Limited, Cree, Keey, Savia Electric, Opple, TCL.
3. What are the main segments of the Footlight?
The market segments include Application, Types.
4. Can you provide details about the market size?
The market size is estimated to be USD XXX million as of 2022.
5. What are some drivers contributing to market growth?
N/A
6. What are the notable trends driving market growth?
N/A
7. Are there any restraints impacting market growth?
N/A
8. Can you provide examples of recent developments in the market?
N/A
9. What pricing options are available for accessing the report?
Pricing options include single-user, multi-user, and enterprise licenses priced at USD 4900.00, USD 7350.00, and USD 9800.00 respectively.
10. Is the market size provided in terms of value or volume?
The market size is provided in terms of value, measured in million.
11. Are there any specific market keywords associated with the report?
Yes, the market keyword associated with the report is "Footlight," which aids in identifying and referencing the specific market segment covered.
12. How do I determine which pricing option suits my needs best?
The pricing options vary based on user requirements and access needs. Individual users may opt for single-user licenses, while businesses requiring broader access may choose multi-user or enterprise licenses for cost-effective access to the report.
13. Are there any additional resources or data provided in the Footlight report?
While the report offers comprehensive insights, it's advisable to review the specific contents or supplementary materials provided to ascertain if additional resources or data are available.
14. How can I stay updated on further developments or reports in the Footlight?
To stay informed about further developments, trends, and reports in the Footlight, consider subscribing to industry newsletters, following relevant companies and organizations, or regularly checking reputable industry news sources and publications.
Methodology
Step 1 - Identification of Relevant Samples Size from Population Database


Step 2 - Approaches for Defining Global Market Size (Value, Volume* & Price*)

Note*: In applicable scenarios
Step 3 - Data Sources
Primary Research
- Web Analytics
- Survey Reports
- Research Institute
- Latest Research Reports
- Opinion Leaders
Secondary Research
- Annual Reports
- White Paper
- Latest Press Release
- Industry Association
- Paid Database
- Investor Presentations

Step 4 - Data Triangulation
Involves using different sources of information in order to increase the validity of a study
These sources are likely to be stakeholders in a program - participants, other researchers, program staff, other community members, and so on.
Then we put all data in single framework & apply various statistical tools to find out the dynamic on the market.
During the analysis stage, feedback from the stakeholder groups would be compared to determine areas of agreement as well as areas of divergence


