Key Insights
The global fresh cherries market, valued at approximately $68 billion in its base year 2025, is projected for significant expansion with a Compound Annual Growth Rate (CAGR) of 6.9% from 2025 to 2033. This growth is propelled by increasing consumer preference for healthy, convenient snack options and the inherent versatility of cherries across diverse culinary applications. Enhanced market accessibility through expanding e-commerce platforms and advancements in agricultural practices contributing to improved yield and quality further support market expansion. Key challenges include seasonal availability, perishability, and price volatility influenced by weather and supply chain disruptions. Segmentation by cherry variety, application, and distribution channel presents opportunities for specialized product development and targeted marketing. North America currently leads market share, while the Asia-Pacific region is poised for substantial growth due to rising disposable incomes and evolving dietary habits in markets like China and India.
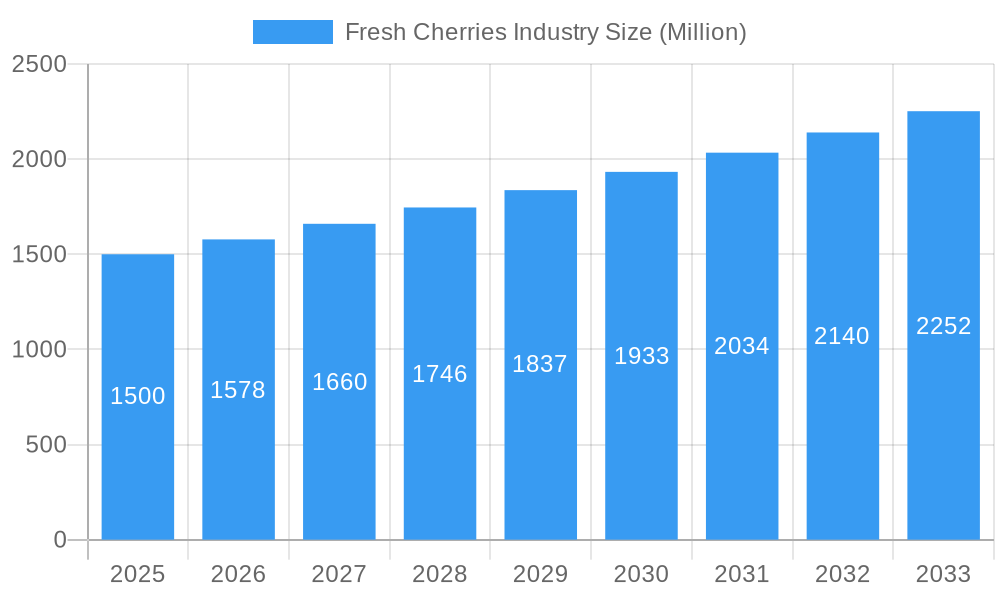
Fresh Cherries Industry Market Size (In Billion)
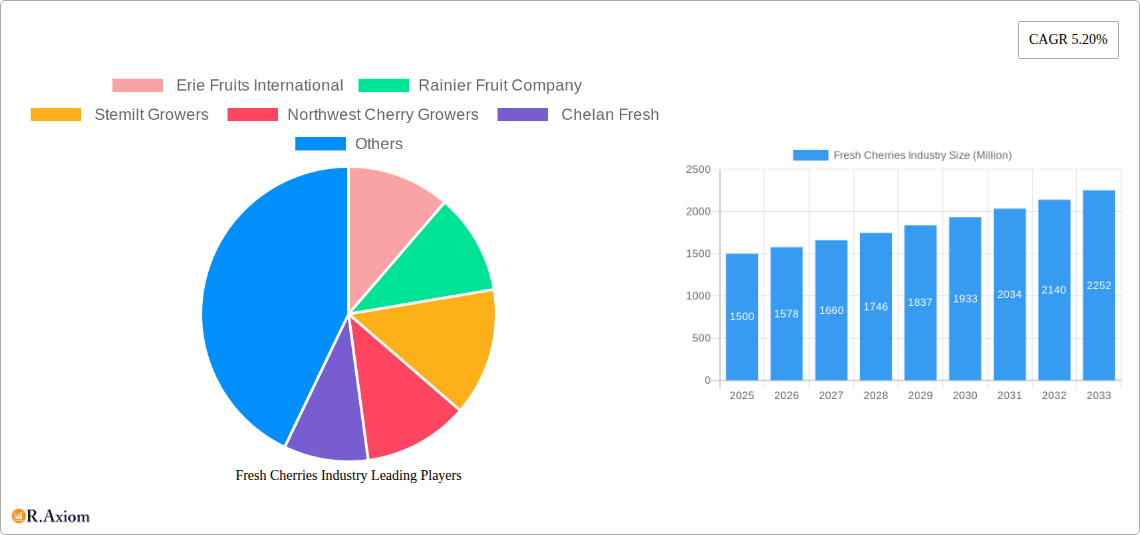
The competitive arena features established producers and regional players. Key companies like Erie Fruits International, Rainier Fruit Company, Stemilt Growers, Northwest Cherry Growers, and Chelan Fresh are actively innovating product offerings, optimizing distribution, and investing in branding to expand market presence. Future success hinges on addressing sustainability concerns, minimizing food waste, and adapting to evolving consumer demands. Strategic initiatives focused on innovative packaging, value-added products, and robust brand building will be critical for market leadership. Industry consolidation and strategic alliances are anticipated to address challenges and capitalize on growth prospects. Further research into extending shelf life and developing novel product applications will bolster market potential.
Fresh Cherries Industry Company Market Share
Fresh Cherries Industry: A Comprehensive Market Report (2019-2033)
This comprehensive report provides an in-depth analysis of the global fresh cherries industry, offering valuable insights for stakeholders, investors, and industry professionals. With a study period spanning 2019-2033, a base year of 2025, and a forecast period of 2025-2033, this report presents a detailed overview of market dynamics, growth drivers, challenges, and emerging opportunities. The report incorporates data from the historical period (2019-2024) and includes detailed segmentation by type (Bing, Rainier, Royal Ann, Montmorency), application (fresh, processed), and distribution channel (supermarkets, hypermarkets, e-commerce). The report also profiles key players like Erie Fruits International, Rainier Fruit Company, Stemilt Growers, Northwest Cherry Growers, and Chelan Fresh, analyzing their market share and strategic initiatives. The projected market size for 2025 is estimated at xx Million.
Fresh Cherries Industry Market Concentration & Innovation
The global fresh cherries market exhibits a moderately concentrated structure, with a few major players holding significant market share. Erie Fruits International, Rainier Fruit Company, and Stemilt Growers are among the leading companies, collectively accounting for an estimated xx% of the market in 2025. However, the market also features a number of smaller, regional players, particularly in emerging cherry-producing regions. Innovation in the industry is driven by factors such as improved farming techniques (e.g., precision agriculture, hydroponics), advanced packaging solutions to extend shelf life, and the development of new cherry varieties with enhanced taste and disease resistance. Regulatory frameworks, including food safety standards and trade policies, significantly influence market dynamics. Product substitutes, such as other berries and stone fruits, pose a competitive threat. End-user trends, such as increasing health consciousness and demand for convenient snack options, are driving market growth. M&A activity in the industry has been relatively moderate, with deal values typically ranging from xx Million to xx Million in recent years. Key examples of M&A activity include (insert examples if available, otherwise state "no significant M&A activity was recorded during the study period").
Fresh Cherries Industry Industry Trends & Insights
The global fresh cherries market is projected to experience robust growth, with a CAGR of xx% during the forecast period (2025-2033). This growth is fueled by several key factors. Rising disposable incomes in developing economies are driving increased demand for premium fruits like cherries. Changing consumer preferences towards healthier and convenient snack options are boosting consumption. Technological advancements in agriculture, such as improved irrigation and pest control methods, are enhancing yields and improving fruit quality. However, the market also faces challenges like fluctuations in weather patterns and increasing competition from other fruit varieties. Market penetration of fresh cherries is currently at xx% globally and is expected to increase to xx% by 2033. The competitive landscape is characterized by both large multinational corporations and smaller, regional players. These players are engaged in intense competition, focusing on factors like product differentiation, branding, and efficient supply chain management. Specific metrics about pricing and market volume would be provided in the full report.
Dominant Markets & Segments in Fresh Cherries Industry
The North American market currently holds the dominant position in the global fresh cherries industry, driven by factors like extensive cherry cultivation areas, established distribution infrastructure, and high consumer demand. Within North America, the United States and Canada are the major consumers.
- Key Drivers for North American Dominance:
- Well-established farming practices and high yields.
- Robust cold chain infrastructure minimizing losses.
- High per capita consumption of fresh fruits.
- Favorable climatic conditions in key growing regions.
Among cherry types, Bing cherries dominate the market due to their widespread appeal and superior taste profile. The fresh application segment leads in terms of market share, although the processed segment is steadily gaining traction with value-added products. Supermarkets and hypermarkets remain the primary distribution channels. E-commerce is also witnessing significant growth, offering consumers a convenient way to purchase fresh cherries.
Fresh Cherries Industry Product Developments
Recent product innovations in the fresh cherries industry have focused on extending shelf life through improved packaging and post-harvest handling techniques. There's a growing emphasis on developing cherry varieties with enhanced flavor profiles, disease resistance, and improved yields. Some companies are also exploring value-added products, such as cherry juices, jams, and dried cherries, to expand market reach and cater to diverse consumer preferences. These advancements are enhancing the competitive advantage of producers, improving market fit, and driving further industry growth.
Report Scope & Segmentation Analysis
This report comprehensively segments the fresh cherries market based on type (Bing, Rainier, Royal Ann, Montmorency), application (fresh, processed), and distribution channel (supermarkets, hypermarkets, e-commerce). Growth projections for each segment are provided in the full report, along with detailed analysis of market size and competitive dynamics. For example, the Bing cherry segment is expected to maintain its dominant position, while the processed segment is projected to experience the fastest growth rate. Similarly, the e-commerce channel is expected to show substantial growth as consumer online shopping habits evolve. Specific data on market size, revenue and other related details are included in the full report.
Key Drivers of Fresh Cherries Industry Growth
The growth of the fresh cherries industry is driven by a combination of factors. Increasing health consciousness among consumers is leading to higher demand for nutritious fruits. Technological advancements in agriculture, such as improved irrigation and pest control techniques, are increasing yields and improving fruit quality. Favorable government policies promoting fruit production and export in key regions also contribute to the market growth. Growing disposable incomes, particularly in emerging economies, are enabling consumers to purchase premium fruits like cherries.
Challenges in the Fresh Cherries Industry Sector
The fresh cherries industry faces several challenges, including climate change, leading to unpredictable weather patterns and impacting yields. Supply chain disruptions, particularly transportation and storage issues, can affect product quality and availability. Intense competition from other fruit varieties and price fluctuations create additional pressure on profitability. Regulatory hurdles related to food safety standards and international trade also present challenges for industry players. These factors can significantly influence market profitability.
Emerging Opportunities in Fresh Cherries Industry
The fresh cherries industry presents numerous emerging opportunities. Expanding into new markets, especially in developing countries with growing middle classes, offers significant potential for growth. Developing new cherry varieties with improved taste, shelf life, and disease resistance can further expand market reach. Exploring innovative packaging solutions to extend shelf life and reduce food waste creates considerable business opportunities. Growing interest in functional foods and health-enhancing products presents further potential for growth in the value-added processed segment.
Leading Players in the Fresh Cherries Industry Market
- Erie Fruits International
- Rainier Fruit Company
- Stemilt Growers
- Northwest Cherry Growers
- Chelan Fresh
Key Developments in Fresh Cherries Industry Industry
- December 2020: ProChile launched a retail promotion campaign ("Cherry-sh Every Moment") to introduce Chilean cherries in the Indian market, highlighting the potential for new export markets.
- July 2021: The emergence of modern intensive cherry orchards in Uzbekistan indicates a potential shift in global supply dynamics and the expansion of cherry production into new regions.
- October 2021: The USDA reported 6,800 metric tons of Chilean cherry imports into the US, signifying the growth of the US market and the diversification of Chilean cherry exports beyond China.
Strategic Outlook for Fresh Cherries Industry Market
The future of the fresh cherries industry looks promising, with continued growth driven by rising consumer demand, technological advancements, and expansion into new markets. Strategic investments in research and development, sustainable farming practices, and innovative marketing campaigns will be crucial for industry players to maintain a competitive edge. Focusing on value-added products and catering to specific consumer segments will also play a vital role in achieving sustained market growth. The industry's ability to address challenges related to climate change, supply chain management, and regulatory compliance will further shape its future trajectory.
Fresh Cherries Industry Segmentation
- 1. Production Analysis
- 2. Consumption Analysis
- 3. Import Market Analysis (Value & Volume)
- 4. Export Market Analysis (Value & Volume)
- 5. Price Trend Analysis
Fresh Cherries Industry Segmentation By Geography
-
1. North America
- 1.1. United States
-
2. Europe
- 2.1. Spain
-
3. Asia Pacific
- 3.1. China
-
4. South America
- 4.1. Chile
-
5. Middle East and Africa
- 5.1. Turkey
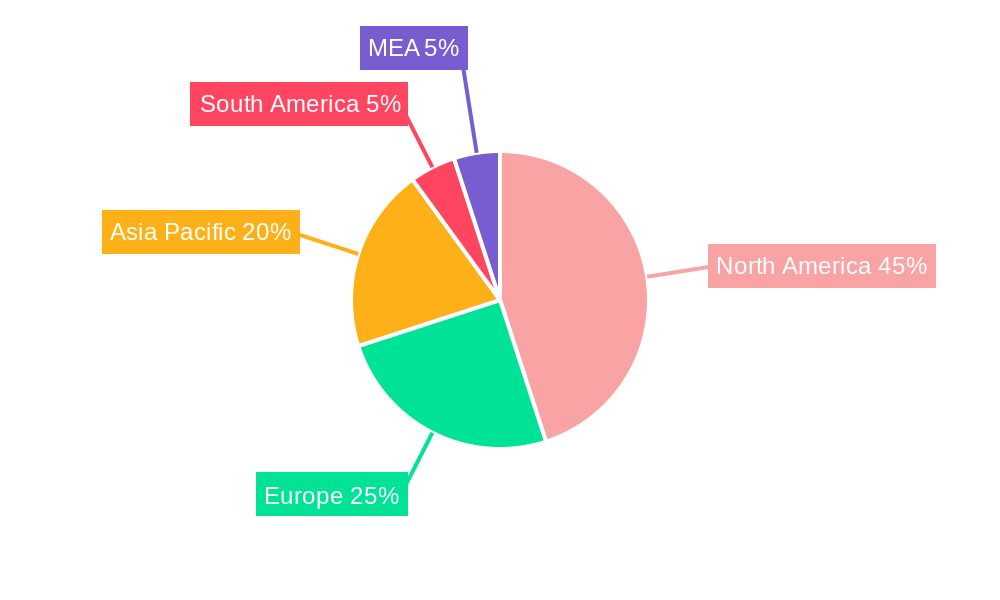
Fresh Cherries Industry Regional Market Share
Geographic Coverage of Fresh Cherries Industry
Fresh Cherries Industry REPORT HIGHLIGHTS
| Aspects | Details |
|---|---|
| Study Period | 2020-2034 |
| Base Year | 2025 |
| Estimated Year | 2026 |
| Forecast Period | 2026-2034 |
| Historical Period | 2020-2025 |
| Growth Rate | CAGR of 6.9% from 2020-2034 |
| Segmentation |
|
Table of Contents
- 1. Introduction
- 1.1. Research Scope
- 1.2. Market Segmentation
- 1.3. Research Objective
- 1.4. Definitions and Assumptions
- 2. Executive Summary
- 2.1. Market Snapshot
- 3. Market Dynamics
- 3.1. Market Drivers
- 3.2. Market Restrains
- 3.3. Market Trends
- 3.4. Market Opportunities
- 4. Market Factor Analysis
- 4.1. Porters Five Forces
- 4.1.1. Bargaining Power of Suppliers
- 4.1.2. Bargaining Power of Buyers
- 4.1.3. Threat of New Entrants
- 4.1.4. Threat of Substitutes
- 4.1.5. Competitive Rivalry
- 4.2. PESTEL analysis
- 4.3. BCG Analysis
- 4.3.1. Stars (High Growth, High Market Share)
- 4.3.2. Cash Cows (Low Growth, High Market Share)
- 4.3.3. Question Mark (High Growth, Low Market Share)
- 4.3.4. Dogs (Low Growth, Low Market Share)
- 4.4. Ansoff Matrix Analysis
- 4.5. Supply Chain Analysis
- 4.6. Regulatory Landscape
- 4.7. Current Market Potential and Opportunity Assessment (TAM–SAM–SOM Framework)
- 4.8. RAX Analyst Note
- 4.1. Porters Five Forces
- 5. Market Analysis, Insights and Forecast 2021-2033
- 5.1. Market Analysis, Insights and Forecast - by Production Analysis
- 5.2. Market Analysis, Insights and Forecast - by Consumption Analysis
- 5.3. Market Analysis, Insights and Forecast - by Import Market Analysis (Value & Volume)
- 5.4. Market Analysis, Insights and Forecast - by Export Market Analysis (Value & Volume)
- 5.5. Market Analysis, Insights and Forecast - by Price Trend Analysis
- 5.6. Market Analysis, Insights and Forecast - by Region
- 5.6.1. North America
- 5.6.2. Europe
- 5.6.3. Asia Pacific
- 5.6.4. South America
- 5.6.5. Middle East and Africa
- 6. Global Fresh Cherries Industry Analysis, Insights and Forecast, 2021-2033
- 6.1. Market Analysis, Insights and Forecast - by Production Analysis
- 6.2. Market Analysis, Insights and Forecast - by Consumption Analysis
- 6.3. Market Analysis, Insights and Forecast - by Import Market Analysis (Value & Volume)
- 6.4. Market Analysis, Insights and Forecast - by Export Market Analysis (Value & Volume)
- 6.5. Market Analysis, Insights and Forecast - by Price Trend Analysis
- 7. North America Fresh Cherries Industry Analysis, Insights and Forecast, 2020-2032
- 7.1. Market Analysis, Insights and Forecast - by Production Analysis
- 7.2. Market Analysis, Insights and Forecast - by Consumption Analysis
- 7.3. Market Analysis, Insights and Forecast - by Import Market Analysis (Value & Volume)
- 7.4. Market Analysis, Insights and Forecast - by Export Market Analysis (Value & Volume)
- 7.5. Market Analysis, Insights and Forecast - by Price Trend Analysis
- 8. Europe Fresh Cherries Industry Analysis, Insights and Forecast, 2020-2032
- 8.1. Market Analysis, Insights and Forecast - by Production Analysis
- 8.2. Market Analysis, Insights and Forecast - by Consumption Analysis
- 8.3. Market Analysis, Insights and Forecast - by Import Market Analysis (Value & Volume)
- 8.4. Market Analysis, Insights and Forecast - by Export Market Analysis (Value & Volume)
- 8.5. Market Analysis, Insights and Forecast - by Price Trend Analysis
- 9. Asia Pacific Fresh Cherries Industry Analysis, Insights and Forecast, 2020-2032
- 9.1. Market Analysis, Insights and Forecast - by Production Analysis
- 9.2. Market Analysis, Insights and Forecast - by Consumption Analysis
- 9.3. Market Analysis, Insights and Forecast - by Import Market Analysis (Value & Volume)
- 9.4. Market Analysis, Insights and Forecast - by Export Market Analysis (Value & Volume)
- 9.5. Market Analysis, Insights and Forecast - by Price Trend Analysis
- 10. South America Fresh Cherries Industry Analysis, Insights and Forecast, 2020-2032
- 10.1. Market Analysis, Insights and Forecast - by Production Analysis
- 10.2. Market Analysis, Insights and Forecast - by Consumption Analysis
- 10.3. Market Analysis, Insights and Forecast - by Import Market Analysis (Value & Volume)
- 10.4. Market Analysis, Insights and Forecast - by Export Market Analysis (Value & Volume)
- 10.5. Market Analysis, Insights and Forecast - by Price Trend Analysis
- 11. Middle East and Africa Fresh Cherries Industry Analysis, Insights and Forecast, 2020-2032
- 11.1. Market Analysis, Insights and Forecast - by Production Analysis
- 11.2. Market Analysis, Insights and Forecast - by Consumption Analysis
- 11.3. Market Analysis, Insights and Forecast - by Import Market Analysis (Value & Volume)
- 11.4. Market Analysis, Insights and Forecast - by Export Market Analysis (Value & Volume)
- 11.5. Market Analysis, Insights and Forecast - by Price Trend Analysis
- 12. Competitive Analysis
- 12.1. Company Profiles
- 12.1.1 Erie Fruits International
- 12.1.1.1. Company Overview
- 12.1.1.2. Products
- 12.1.1.3. Company Financials
- 12.1.1.4. SWOT Analysis
- 12.1.2 Rainier Fruit Company
- 12.1.2.1. Company Overview
- 12.1.2.2. Products
- 12.1.2.3. Company Financials
- 12.1.2.4. SWOT Analysis
- 12.1.3 Stemilt Growers
- 12.1.3.1. Company Overview
- 12.1.3.2. Products
- 12.1.3.3. Company Financials
- 12.1.3.4. SWOT Analysis
- 12.1.4 Northwest Cherry Growers
- 12.1.4.1. Company Overview
- 12.1.4.2. Products
- 12.1.4.3. Company Financials
- 12.1.4.4. SWOT Analysis
- 12.1.5 Chelan Fresh
- 12.1.5.1. Company Overview
- 12.1.5.2. Products
- 12.1.5.3. Company Financials
- 12.1.5.4. SWOT Analysis
- 12.1.1 Erie Fruits International
- 12.2. Market Entropy
- 12.2.1 Company's Key Areas Served
- 12.2.2 Recent Developments
- 12.3. Company Market Share Analysis 2025
- 12.3.1 Top 5 Companies Market Share Analysis
- 12.3.2 Top 3 Companies Market Share Analysis
- 12.4. List of Potential Customers
- 13. Research Methodology
List of Figures
- Figure 1: Global Fresh Cherries Industry Revenue Breakdown (billion, %) by Region 2025 & 2033
- Figure 2: Global Fresh Cherries Industry Volume Breakdown (Metric Tons, %) by Region 2025 & 2033
- Figure 3: North America Fresh Cherries Industry Revenue (billion), by Production Analysis 2025 & 2033
- Figure 4: North America Fresh Cherries Industry Volume (Metric Tons), by Production Analysis 2025 & 2033
- Figure 5: North America Fresh Cherries Industry Revenue Share (%), by Production Analysis 2025 & 2033
- Figure 6: North America Fresh Cherries Industry Volume Share (%), by Production Analysis 2025 & 2033
- Figure 7: North America Fresh Cherries Industry Revenue (billion), by Consumption Analysis 2025 & 2033
- Figure 8: North America Fresh Cherries Industry Volume (Metric Tons), by Consumption Analysis 2025 & 2033
- Figure 9: North America Fresh Cherries Industry Revenue Share (%), by Consumption Analysis 2025 & 2033
- Figure 10: North America Fresh Cherries Industry Volume Share (%), by Consumption Analysis 2025 & 2033
- Figure 11: North America Fresh Cherries Industry Revenue (billion), by Import Market Analysis (Value & Volume) 2025 & 2033
- Figure 12: North America Fresh Cherries Industry Volume (Metric Tons), by Import Market Analysis (Value & Volume) 2025 & 2033
- Figure 13: North America Fresh Cherries Industry Revenue Share (%), by Import Market Analysis (Value & Volume) 2025 & 2033
- Figure 14: North America Fresh Cherries Industry Volume Share (%), by Import Market Analysis (Value & Volume) 2025 & 2033
- Figure 15: North America Fresh Cherries Industry Revenue (billion), by Export Market Analysis (Value & Volume) 2025 & 2033
- Figure 16: North America Fresh Cherries Industry Volume (Metric Tons), by Export Market Analysis (Value & Volume) 2025 & 2033
- Figure 17: North America Fresh Cherries Industry Revenue Share (%), by Export Market Analysis (Value & Volume) 2025 & 2033
- Figure 18: North America Fresh Cherries Industry Volume Share (%), by Export Market Analysis (Value & Volume) 2025 & 2033
- Figure 19: North America Fresh Cherries Industry Revenue (billion), by Price Trend Analysis 2025 & 2033
- Figure 20: North America Fresh Cherries Industry Volume (Metric Tons), by Price Trend Analysis 2025 & 2033
- Figure 21: North America Fresh Cherries Industry Revenue Share (%), by Price Trend Analysis 2025 & 2033
- Figure 22: North America Fresh Cherries Industry Volume Share (%), by Price Trend Analysis 2025 & 2033
- Figure 23: North America Fresh Cherries Industry Revenue (billion), by Country 2025 & 2033
- Figure 24: North America Fresh Cherries Industry Volume (Metric Tons), by Country 2025 & 2033
- Figure 25: North America Fresh Cherries Industry Revenue Share (%), by Country 2025 & 2033
- Figure 26: North America Fresh Cherries Industry Volume Share (%), by Country 2025 & 2033
- Figure 27: Europe Fresh Cherries Industry Revenue (billion), by Production Analysis 2025 & 2033
- Figure 28: Europe Fresh Cherries Industry Volume (Metric Tons), by Production Analysis 2025 & 2033
- Figure 29: Europe Fresh Cherries Industry Revenue Share (%), by Production Analysis 2025 & 2033
- Figure 30: Europe Fresh Cherries Industry Volume Share (%), by Production Analysis 2025 & 2033
- Figure 31: Europe Fresh Cherries Industry Revenue (billion), by Consumption Analysis 2025 & 2033
- Figure 32: Europe Fresh Cherries Industry Volume (Metric Tons), by Consumption Analysis 2025 & 2033
- Figure 33: Europe Fresh Cherries Industry Revenue Share (%), by Consumption Analysis 2025 & 2033
- Figure 34: Europe Fresh Cherries Industry Volume Share (%), by Consumption Analysis 2025 & 2033
- Figure 35: Europe Fresh Cherries Industry Revenue (billion), by Import Market Analysis (Value & Volume) 2025 & 2033
- Figure 36: Europe Fresh Cherries Industry Volume (Metric Tons), by Import Market Analysis (Value & Volume) 2025 & 2033
- Figure 37: Europe Fresh Cherries Industry Revenue Share (%), by Import Market Analysis (Value & Volume) 2025 & 2033
- Figure 38: Europe Fresh Cherries Industry Volume Share (%), by Import Market Analysis (Value & Volume) 2025 & 2033
- Figure 39: Europe Fresh Cherries Industry Revenue (billion), by Export Market Analysis (Value & Volume) 2025 & 2033
- Figure 40: Europe Fresh Cherries Industry Volume (Metric Tons), by Export Market Analysis (Value & Volume) 2025 & 2033
- Figure 41: Europe Fresh Cherries Industry Revenue Share (%), by Export Market Analysis (Value & Volume) 2025 & 2033
- Figure 42: Europe Fresh Cherries Industry Volume Share (%), by Export Market Analysis (Value & Volume) 2025 & 2033
- Figure 43: Europe Fresh Cherries Industry Revenue (billion), by Price Trend Analysis 2025 & 2033
- Figure 44: Europe Fresh Cherries Industry Volume (Metric Tons), by Price Trend Analysis 2025 & 2033
- Figure 45: Europe Fresh Cherries Industry Revenue Share (%), by Price Trend Analysis 2025 & 2033
- Figure 46: Europe Fresh Cherries Industry Volume Share (%), by Price Trend Analysis 2025 & 2033
- Figure 47: Europe Fresh Cherries Industry Revenue (billion), by Country 2025 & 2033
- Figure 48: Europe Fresh Cherries Industry Volume (Metric Tons), by Country 2025 & 2033
- Figure 49: Europe Fresh Cherries Industry Revenue Share (%), by Country 2025 & 2033
- Figure 50: Europe Fresh Cherries Industry Volume Share (%), by Country 2025 & 2033
- Figure 51: Asia Pacific Fresh Cherries Industry Revenue (billion), by Production Analysis 2025 & 2033
- Figure 52: Asia Pacific Fresh Cherries Industry Volume (Metric Tons), by Production Analysis 2025 & 2033
- Figure 53: Asia Pacific Fresh Cherries Industry Revenue Share (%), by Production Analysis 2025 & 2033
- Figure 54: Asia Pacific Fresh Cherries Industry Volume Share (%), by Production Analysis 2025 & 2033
- Figure 55: Asia Pacific Fresh Cherries Industry Revenue (billion), by Consumption Analysis 2025 & 2033
- Figure 56: Asia Pacific Fresh Cherries Industry Volume (Metric Tons), by Consumption Analysis 2025 & 2033
- Figure 57: Asia Pacific Fresh Cherries Industry Revenue Share (%), by Consumption Analysis 2025 & 2033
- Figure 58: Asia Pacific Fresh Cherries Industry Volume Share (%), by Consumption Analysis 2025 & 2033
- Figure 59: Asia Pacific Fresh Cherries Industry Revenue (billion), by Import Market Analysis (Value & Volume) 2025 & 2033
- Figure 60: Asia Pacific Fresh Cherries Industry Volume (Metric Tons), by Import Market Analysis (Value & Volume) 2025 & 2033
- Figure 61: Asia Pacific Fresh Cherries Industry Revenue Share (%), by Import Market Analysis (Value & Volume) 2025 & 2033
- Figure 62: Asia Pacific Fresh Cherries Industry Volume Share (%), by Import Market Analysis (Value & Volume) 2025 & 2033
- Figure 63: Asia Pacific Fresh Cherries Industry Revenue (billion), by Export Market Analysis (Value & Volume) 2025 & 2033
- Figure 64: Asia Pacific Fresh Cherries Industry Volume (Metric Tons), by Export Market Analysis (Value & Volume) 2025 & 2033
- Figure 65: Asia Pacific Fresh Cherries Industry Revenue Share (%), by Export Market Analysis (Value & Volume) 2025 & 2033
- Figure 66: Asia Pacific Fresh Cherries Industry Volume Share (%), by Export Market Analysis (Value & Volume) 2025 & 2033
- Figure 67: Asia Pacific Fresh Cherries Industry Revenue (billion), by Price Trend Analysis 2025 & 2033
- Figure 68: Asia Pacific Fresh Cherries Industry Volume (Metric Tons), by Price Trend Analysis 2025 & 2033
- Figure 69: Asia Pacific Fresh Cherries Industry Revenue Share (%), by Price Trend Analysis 2025 & 2033
- Figure 70: Asia Pacific Fresh Cherries Industry Volume Share (%), by Price Trend Analysis 2025 & 2033
- Figure 71: Asia Pacific Fresh Cherries Industry Revenue (billion), by Country 2025 & 2033
- Figure 72: Asia Pacific Fresh Cherries Industry Volume (Metric Tons), by Country 2025 & 2033
- Figure 73: Asia Pacific Fresh Cherries Industry Revenue Share (%), by Country 2025 & 2033
- Figure 74: Asia Pacific Fresh Cherries Industry Volume Share (%), by Country 2025 & 2033
- Figure 75: South America Fresh Cherries Industry Revenue (billion), by Production Analysis 2025 & 2033
- Figure 76: South America Fresh Cherries Industry Volume (Metric Tons), by Production Analysis 2025 & 2033
- Figure 77: South America Fresh Cherries Industry Revenue Share (%), by Production Analysis 2025 & 2033
- Figure 78: South America Fresh Cherries Industry Volume Share (%), by Production Analysis 2025 & 2033
- Figure 79: South America Fresh Cherries Industry Revenue (billion), by Consumption Analysis 2025 & 2033
- Figure 80: South America Fresh Cherries Industry Volume (Metric Tons), by Consumption Analysis 2025 & 2033
- Figure 81: South America Fresh Cherries Industry Revenue Share (%), by Consumption Analysis 2025 & 2033
- Figure 82: South America Fresh Cherries Industry Volume Share (%), by Consumption Analysis 2025 & 2033
- Figure 83: South America Fresh Cherries Industry Revenue (billion), by Import Market Analysis (Value & Volume) 2025 & 2033
- Figure 84: South America Fresh Cherries Industry Volume (Metric Tons), by Import Market Analysis (Value & Volume) 2025 & 2033
- Figure 85: South America Fresh Cherries Industry Revenue Share (%), by Import Market Analysis (Value & Volume) 2025 & 2033
- Figure 86: South America Fresh Cherries Industry Volume Share (%), by Import Market Analysis (Value & Volume) 2025 & 2033
- Figure 87: South America Fresh Cherries Industry Revenue (billion), by Export Market Analysis (Value & Volume) 2025 & 2033
- Figure 88: South America Fresh Cherries Industry Volume (Metric Tons), by Export Market Analysis (Value & Volume) 2025 & 2033
- Figure 89: South America Fresh Cherries Industry Revenue Share (%), by Export Market Analysis (Value & Volume) 2025 & 2033
- Figure 90: South America Fresh Cherries Industry Volume Share (%), by Export Market Analysis (Value & Volume) 2025 & 2033
- Figure 91: South America Fresh Cherries Industry Revenue (billion), by Price Trend Analysis 2025 & 2033
- Figure 92: South America Fresh Cherries Industry Volume (Metric Tons), by Price Trend Analysis 2025 & 2033
- Figure 93: South America Fresh Cherries Industry Revenue Share (%), by Price Trend Analysis 2025 & 2033
- Figure 94: South America Fresh Cherries Industry Volume Share (%), by Price Trend Analysis 2025 & 2033
- Figure 95: South America Fresh Cherries Industry Revenue (billion), by Country 2025 & 2033
- Figure 96: South America Fresh Cherries Industry Volume (Metric Tons), by Country 2025 & 2033
- Figure 97: South America Fresh Cherries Industry Revenue Share (%), by Country 2025 & 2033
- Figure 98: South America Fresh Cherries Industry Volume Share (%), by Country 2025 & 2033
- Figure 99: Middle East and Africa Fresh Cherries Industry Revenue (billion), by Production Analysis 2025 & 2033
- Figure 100: Middle East and Africa Fresh Cherries Industry Volume (Metric Tons), by Production Analysis 2025 & 2033
- Figure 101: Middle East and Africa Fresh Cherries Industry Revenue Share (%), by Production Analysis 2025 & 2033
- Figure 102: Middle East and Africa Fresh Cherries Industry Volume Share (%), by Production Analysis 2025 & 2033
- Figure 103: Middle East and Africa Fresh Cherries Industry Revenue (billion), by Consumption Analysis 2025 & 2033
- Figure 104: Middle East and Africa Fresh Cherries Industry Volume (Metric Tons), by Consumption Analysis 2025 & 2033
- Figure 105: Middle East and Africa Fresh Cherries Industry Revenue Share (%), by Consumption Analysis 2025 & 2033
- Figure 106: Middle East and Africa Fresh Cherries Industry Volume Share (%), by Consumption Analysis 2025 & 2033
- Figure 107: Middle East and Africa Fresh Cherries Industry Revenue (billion), by Import Market Analysis (Value & Volume) 2025 & 2033
- Figure 108: Middle East and Africa Fresh Cherries Industry Volume (Metric Tons), by Import Market Analysis (Value & Volume) 2025 & 2033
- Figure 109: Middle East and Africa Fresh Cherries Industry Revenue Share (%), by Import Market Analysis (Value & Volume) 2025 & 2033
- Figure 110: Middle East and Africa Fresh Cherries Industry Volume Share (%), by Import Market Analysis (Value & Volume) 2025 & 2033
- Figure 111: Middle East and Africa Fresh Cherries Industry Revenue (billion), by Export Market Analysis (Value & Volume) 2025 & 2033
- Figure 112: Middle East and Africa Fresh Cherries Industry Volume (Metric Tons), by Export Market Analysis (Value & Volume) 2025 & 2033
- Figure 113: Middle East and Africa Fresh Cherries Industry Revenue Share (%), by Export Market Analysis (Value & Volume) 2025 & 2033
- Figure 114: Middle East and Africa Fresh Cherries Industry Volume Share (%), by Export Market Analysis (Value & Volume) 2025 & 2033
- Figure 115: Middle East and Africa Fresh Cherries Industry Revenue (billion), by Price Trend Analysis 2025 & 2033
- Figure 116: Middle East and Africa Fresh Cherries Industry Volume (Metric Tons), by Price Trend Analysis 2025 & 2033
- Figure 117: Middle East and Africa Fresh Cherries Industry Revenue Share (%), by Price Trend Analysis 2025 & 2033
- Figure 118: Middle East and Africa Fresh Cherries Industry Volume Share (%), by Price Trend Analysis 2025 & 2033
- Figure 119: Middle East and Africa Fresh Cherries Industry Revenue (billion), by Country 2025 & 2033
- Figure 120: Middle East and Africa Fresh Cherries Industry Volume (Metric Tons), by Country 2025 & 2033
- Figure 121: Middle East and Africa Fresh Cherries Industry Revenue Share (%), by Country 2025 & 2033
- Figure 122: Middle East and Africa Fresh Cherries Industry Volume Share (%), by Country 2025 & 2033
List of Tables
- Table 1: Global Fresh Cherries Industry Revenue billion Forecast, by Production Analysis 2020 & 2033
- Table 2: Global Fresh Cherries Industry Volume Metric Tons Forecast, by Production Analysis 2020 & 2033
- Table 3: Global Fresh Cherries Industry Revenue billion Forecast, by Consumption Analysis 2020 & 2033
- Table 4: Global Fresh Cherries Industry Volume Metric Tons Forecast, by Consumption Analysis 2020 & 2033
- Table 5: Global Fresh Cherries Industry Revenue billion Forecast, by Import Market Analysis (Value & Volume) 2020 & 2033
- Table 6: Global Fresh Cherries Industry Volume Metric Tons Forecast, by Import Market Analysis (Value & Volume) 2020 & 2033
- Table 7: Global Fresh Cherries Industry Revenue billion Forecast, by Export Market Analysis (Value & Volume) 2020 & 2033
- Table 8: Global Fresh Cherries Industry Volume Metric Tons Forecast, by Export Market Analysis (Value & Volume) 2020 & 2033
- Table 9: Global Fresh Cherries Industry Revenue billion Forecast, by Price Trend Analysis 2020 & 2033
- Table 10: Global Fresh Cherries Industry Volume Metric Tons Forecast, by Price Trend Analysis 2020 & 2033
- Table 11: Global Fresh Cherries Industry Revenue billion Forecast, by Region 2020 & 2033
- Table 12: Global Fresh Cherries Industry Volume Metric Tons Forecast, by Region 2020 & 2033
- Table 13: Global Fresh Cherries Industry Revenue billion Forecast, by Production Analysis 2020 & 2033
- Table 14: Global Fresh Cherries Industry Volume Metric Tons Forecast, by Production Analysis 2020 & 2033
- Table 15: Global Fresh Cherries Industry Revenue billion Forecast, by Consumption Analysis 2020 & 2033
- Table 16: Global Fresh Cherries Industry Volume Metric Tons Forecast, by Consumption Analysis 2020 & 2033
- Table 17: Global Fresh Cherries Industry Revenue billion Forecast, by Import Market Analysis (Value & Volume) 2020 & 2033
- Table 18: Global Fresh Cherries Industry Volume Metric Tons Forecast, by Import Market Analysis (Value & Volume) 2020 & 2033
- Table 19: Global Fresh Cherries Industry Revenue billion Forecast, by Export Market Analysis (Value & Volume) 2020 & 2033
- Table 20: Global Fresh Cherries Industry Volume Metric Tons Forecast, by Export Market Analysis (Value & Volume) 2020 & 2033
- Table 21: Global Fresh Cherries Industry Revenue billion Forecast, by Price Trend Analysis 2020 & 2033
- Table 22: Global Fresh Cherries Industry Volume Metric Tons Forecast, by Price Trend Analysis 2020 & 2033
- Table 23: Global Fresh Cherries Industry Revenue billion Forecast, by Country 2020 & 2033
- Table 24: Global Fresh Cherries Industry Volume Metric Tons Forecast, by Country 2020 & 2033
- Table 25: United States Fresh Cherries Industry Revenue (billion) Forecast, by Application 2020 & 2033
- Table 26: United States Fresh Cherries Industry Volume (Metric Tons) Forecast, by Application 2020 & 2033
- Table 27: Global Fresh Cherries Industry Revenue billion Forecast, by Production Analysis 2020 & 2033
- Table 28: Global Fresh Cherries Industry Volume Metric Tons Forecast, by Production Analysis 2020 & 2033
- Table 29: Global Fresh Cherries Industry Revenue billion Forecast, by Consumption Analysis 2020 & 2033
- Table 30: Global Fresh Cherries Industry Volume Metric Tons Forecast, by Consumption Analysis 2020 & 2033
- Table 31: Global Fresh Cherries Industry Revenue billion Forecast, by Import Market Analysis (Value & Volume) 2020 & 2033
- Table 32: Global Fresh Cherries Industry Volume Metric Tons Forecast, by Import Market Analysis (Value & Volume) 2020 & 2033
- Table 33: Global Fresh Cherries Industry Revenue billion Forecast, by Export Market Analysis (Value & Volume) 2020 & 2033
- Table 34: Global Fresh Cherries Industry Volume Metric Tons Forecast, by Export Market Analysis (Value & Volume) 2020 & 2033
- Table 35: Global Fresh Cherries Industry Revenue billion Forecast, by Price Trend Analysis 2020 & 2033
- Table 36: Global Fresh Cherries Industry Volume Metric Tons Forecast, by Price Trend Analysis 2020 & 2033
- Table 37: Global Fresh Cherries Industry Revenue billion Forecast, by Country 2020 & 2033
- Table 38: Global Fresh Cherries Industry Volume Metric Tons Forecast, by Country 2020 & 2033
- Table 39: Spain Fresh Cherries Industry Revenue (billion) Forecast, by Application 2020 & 2033
- Table 40: Spain Fresh Cherries Industry Volume (Metric Tons) Forecast, by Application 2020 & 2033
- Table 41: Global Fresh Cherries Industry Revenue billion Forecast, by Production Analysis 2020 & 2033
- Table 42: Global Fresh Cherries Industry Volume Metric Tons Forecast, by Production Analysis 2020 & 2033
- Table 43: Global Fresh Cherries Industry Revenue billion Forecast, by Consumption Analysis 2020 & 2033
- Table 44: Global Fresh Cherries Industry Volume Metric Tons Forecast, by Consumption Analysis 2020 & 2033
- Table 45: Global Fresh Cherries Industry Revenue billion Forecast, by Import Market Analysis (Value & Volume) 2020 & 2033
- Table 46: Global Fresh Cherries Industry Volume Metric Tons Forecast, by Import Market Analysis (Value & Volume) 2020 & 2033
- Table 47: Global Fresh Cherries Industry Revenue billion Forecast, by Export Market Analysis (Value & Volume) 2020 & 2033
- Table 48: Global Fresh Cherries Industry Volume Metric Tons Forecast, by Export Market Analysis (Value & Volume) 2020 & 2033
- Table 49: Global Fresh Cherries Industry Revenue billion Forecast, by Price Trend Analysis 2020 & 2033
- Table 50: Global Fresh Cherries Industry Volume Metric Tons Forecast, by Price Trend Analysis 2020 & 2033
- Table 51: Global Fresh Cherries Industry Revenue billion Forecast, by Country 2020 & 2033
- Table 52: Global Fresh Cherries Industry Volume Metric Tons Forecast, by Country 2020 & 2033
- Table 53: China Fresh Cherries Industry Revenue (billion) Forecast, by Application 2020 & 2033
- Table 54: China Fresh Cherries Industry Volume (Metric Tons) Forecast, by Application 2020 & 2033
- Table 55: Global Fresh Cherries Industry Revenue billion Forecast, by Production Analysis 2020 & 2033
- Table 56: Global Fresh Cherries Industry Volume Metric Tons Forecast, by Production Analysis 2020 & 2033
- Table 57: Global Fresh Cherries Industry Revenue billion Forecast, by Consumption Analysis 2020 & 2033
- Table 58: Global Fresh Cherries Industry Volume Metric Tons Forecast, by Consumption Analysis 2020 & 2033
- Table 59: Global Fresh Cherries Industry Revenue billion Forecast, by Import Market Analysis (Value & Volume) 2020 & 2033
- Table 60: Global Fresh Cherries Industry Volume Metric Tons Forecast, by Import Market Analysis (Value & Volume) 2020 & 2033
- Table 61: Global Fresh Cherries Industry Revenue billion Forecast, by Export Market Analysis (Value & Volume) 2020 & 2033
- Table 62: Global Fresh Cherries Industry Volume Metric Tons Forecast, by Export Market Analysis (Value & Volume) 2020 & 2033
- Table 63: Global Fresh Cherries Industry Revenue billion Forecast, by Price Trend Analysis 2020 & 2033
- Table 64: Global Fresh Cherries Industry Volume Metric Tons Forecast, by Price Trend Analysis 2020 & 2033
- Table 65: Global Fresh Cherries Industry Revenue billion Forecast, by Country 2020 & 2033
- Table 66: Global Fresh Cherries Industry Volume Metric Tons Forecast, by Country 2020 & 2033
- Table 67: Chile Fresh Cherries Industry Revenue (billion) Forecast, by Application 2020 & 2033
- Table 68: Chile Fresh Cherries Industry Volume (Metric Tons) Forecast, by Application 2020 & 2033
- Table 69: Global Fresh Cherries Industry Revenue billion Forecast, by Production Analysis 2020 & 2033
- Table 70: Global Fresh Cherries Industry Volume Metric Tons Forecast, by Production Analysis 2020 & 2033
- Table 71: Global Fresh Cherries Industry Revenue billion Forecast, by Consumption Analysis 2020 & 2033
- Table 72: Global Fresh Cherries Industry Volume Metric Tons Forecast, by Consumption Analysis 2020 & 2033
- Table 73: Global Fresh Cherries Industry Revenue billion Forecast, by Import Market Analysis (Value & Volume) 2020 & 2033
- Table 74: Global Fresh Cherries Industry Volume Metric Tons Forecast, by Import Market Analysis (Value & Volume) 2020 & 2033
- Table 75: Global Fresh Cherries Industry Revenue billion Forecast, by Export Market Analysis (Value & Volume) 2020 & 2033
- Table 76: Global Fresh Cherries Industry Volume Metric Tons Forecast, by Export Market Analysis (Value & Volume) 2020 & 2033
- Table 77: Global Fresh Cherries Industry Revenue billion Forecast, by Price Trend Analysis 2020 & 2033
- Table 78: Global Fresh Cherries Industry Volume Metric Tons Forecast, by Price Trend Analysis 2020 & 2033
- Table 79: Global Fresh Cherries Industry Revenue billion Forecast, by Country 2020 & 2033
- Table 80: Global Fresh Cherries Industry Volume Metric Tons Forecast, by Country 2020 & 2033
- Table 81: Turkey Fresh Cherries Industry Revenue (billion) Forecast, by Application 2020 & 2033
- Table 82: Turkey Fresh Cherries Industry Volume (Metric Tons) Forecast, by Application 2020 & 2033
Frequently Asked Questions
1. What is the projected Compound Annual Growth Rate (CAGR) of the Fresh Cherries Industry?
The projected CAGR is approximately 6.9%.
2. Which companies are prominent players in the Fresh Cherries Industry?
Key companies in the market include Erie Fruits International, Rainier Fruit Company , Stemilt Growers , Northwest Cherry Growers , Chelan Fresh .
3. What are the main segments of the Fresh Cherries Industry?
The market segments include Production Analysis, Consumption Analysis, Import Market Analysis (Value & Volume), Export Market Analysis (Value & Volume), Price Trend Analysis.
4. Can you provide details about the market size?
The market size is estimated to be USD 68 billion as of 2022.
5. What are some drivers contributing to market growth?
; Awareness About Health Benefits Associated With Pecan Consumption; Wide Application of Pecan.
6. What are the notable trends driving market growth?
Increasing Demand for Imported Sweet Cherries.
7. Are there any restraints impacting market growth?
; Volatility in the Prices; Adverse Weather Conditions Affecting Yield.
8. Can you provide examples of recent developments in the market?
October 2021: For the 2020-21 season, the United States Department of Agriculture (USDA) reported that US imports of Chilean cherries totaled about 6,800 metric tons. While China has been the main receiver of Chilean cherries, the industry is working diligently to develop other markets, including the United States.
9. What pricing options are available for accessing the report?
Pricing options include single-user, multi-user, and enterprise licenses priced at USD 4750, USD 5250, and USD 8750 respectively.
10. Is the market size provided in terms of value or volume?
The market size is provided in terms of value, measured in billion and volume, measured in Metric Tons.
11. Are there any specific market keywords associated with the report?
Yes, the market keyword associated with the report is "Fresh Cherries Industry," which aids in identifying and referencing the specific market segment covered.
12. How do I determine which pricing option suits my needs best?
The pricing options vary based on user requirements and access needs. Individual users may opt for single-user licenses, while businesses requiring broader access may choose multi-user or enterprise licenses for cost-effective access to the report.
13. Are there any additional resources or data provided in the Fresh Cherries Industry report?
While the report offers comprehensive insights, it's advisable to review the specific contents or supplementary materials provided to ascertain if additional resources or data are available.
14. How can I stay updated on further developments or reports in the Fresh Cherries Industry?
To stay informed about further developments, trends, and reports in the Fresh Cherries Industry, consider subscribing to industry newsletters, following relevant companies and organizations, or regularly checking reputable industry news sources and publications.
Methodology
Step 1 - Identification of Relevant Samples Size from Population Database


Step 2 - Approaches for Defining Global Market Size (Value, Volume* & Price*)

Note*: In applicable scenarios
Step 3 - Data Sources
Primary Research
- Web Analytics
- Survey Reports
- Research Institute
- Latest Research Reports
- Opinion Leaders
Secondary Research
- Annual Reports
- White Paper
- Latest Press Release
- Industry Association
- Paid Database
- Investor Presentations

Step 4 - Data Triangulation
Involves using different sources of information in order to increase the validity of a study
These sources are likely to be stakeholders in a program - participants, other researchers, program staff, other community members, and so on.
Then we put all data in single framework & apply various statistical tools to find out the dynamic on the market.
During the analysis stage, feedback from the stakeholder groups would be compared to determine areas of agreement as well as areas of divergence

