

Key Insights
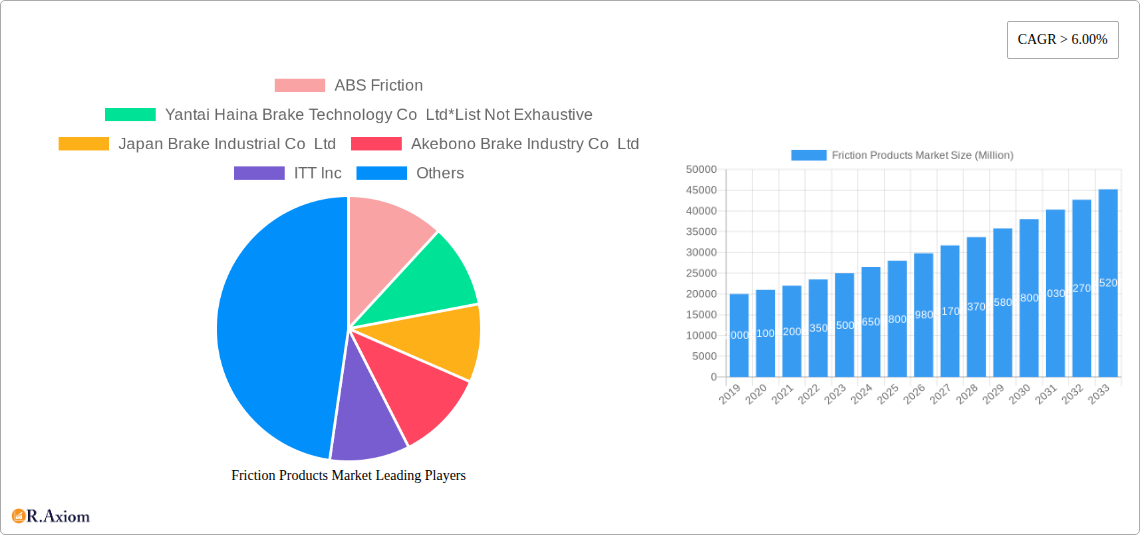
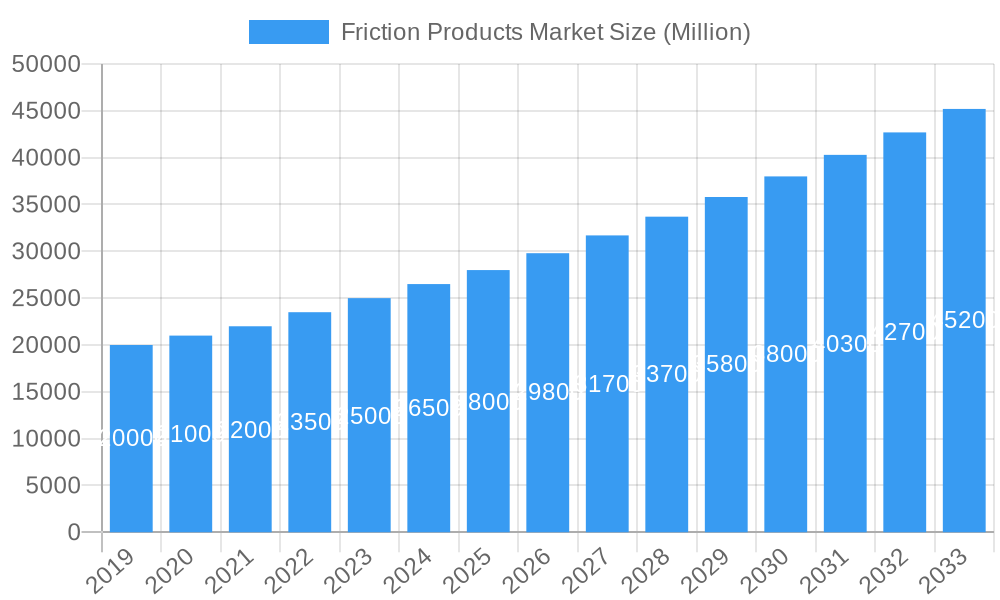
The global Friction Products Market is poised for significant expansion, projected to reach a market size of approximately $28,000 million by 2025, with a robust Compound Annual Growth Rate (CAGR) exceeding 6.00% through 2033. This growth is primarily fueled by the escalating demand for advanced braking and clutching systems across a spectrum of end-user industries, notably automotive, railway, and aerospace. The automotive sector, in particular, continues to be the dominant force, driven by increasing vehicle production, a growing fleet of older vehicles requiring component replacements, and the integration of sophisticated friction materials in both conventional and electric vehicles. Advancements in material science, leading to the development of high-performance ceramic, semi-metallic, and sintered metal friction components, are key enablers of this market expansion. These materials offer superior durability, reduced wear, and enhanced thermal management, crucial for meeting stringent safety and performance standards. Furthermore, evolving regulatory landscapes mandating stricter emission controls and safety features are indirectly spurring innovation and demand for more efficient friction solutions.
Friction Products Market Market Size (In Billion)
The market's trajectory is further shaped by distinct trends and drivers. Key drivers include the increasing global automotive production, particularly in emerging economies, and the substantial aftermarket demand for replacement friction parts. The rising adoption of electric vehicles (EVs) presents both opportunities and challenges; while regenerative braking in EVs can reduce the reliance on traditional friction brakes, the need for fail-safe braking systems and specialized friction materials for EV applications remains critical. Emerging trends include the development of quieter, dust-free friction materials, enhanced friction coefficient consistency under varying conditions, and the integration of smart sensor technologies for predictive maintenance. However, the market faces restraints such as the fluctuating raw material prices, intense competition leading to price pressures, and the inherent lifecycle limitations of certain friction materials. The Asia Pacific region is anticipated to lead the market in terms of both production and consumption, owing to its massive automotive manufacturing base and burgeoning transportation infrastructure.
Friction Products Market Company Market Share
Friction Products Market: Comprehensive Analysis and Future Outlook (2019–2033)
Report Description:
This in-depth report provides a definitive analysis of the global Friction Products Market, encompassing a comprehensive study from 2019 to 2033. With a base year of 2025 and a forecast period extending to 2033, this research delves into market dynamics, key growth drivers, emerging trends, and the competitive landscape. We dissect the market by product type (Discs, Pads, Blocks, Linings, Other Types), material composition (Ceramic, Asbestos, Semi-metallic, Sintered Metals, Aramid Fibers, Other Materials), application (Clutch and Brake Systems, Gear Tooth Systems, Other Applications), and end-user industries (Automotive, Railway, Aerospace, Mining, Other End-user Industries). The report offers actionable insights for stakeholders, including manufacturers, suppliers, investors, and industry professionals, to navigate the evolving friction products industry.
This report meticulously examines market concentration, innovation strategies, evolving regulatory frameworks, the threat of product substitutes, and critical end-user trends. It quantifies the impact of mergers and acquisitions (M&A), with a projected M&A deal value of over USD 5,000 Million in the forecast period, and analyzes the market share of leading players. Key developments, such as ABS Friction's innovative composite materials and Yantai Haina Brake Technology Co Ltd's advancements in high-performance brake pads, are highlighted. The report also scrutinizes the influence of regulatory bodies on product development and market entry, providing a holistic view of the competitive ecosystem.
The Friction Products Market is projected to experience a robust Compound Annual Growth Rate (CAGR) of approximately 6.5% from 2025 to 2033, reaching a market size estimated at over USD 150,000 Million in 2025 and projected to exceed USD 250,000 Million by 2033. This growth is fueled by increasing vehicle production worldwide, stringent safety regulations demanding advanced braking solutions, and the rising adoption of electric vehicles (EVs) which, despite regenerative braking, still require conventional friction systems for primary and emergency stopping. Technological advancements are continuously pushing the boundaries of performance, durability, and environmental compliance, with a growing emphasis on noise, vibration, and harshness (NVH) reduction. Consumer preferences are also shifting towards quieter, more efficient, and sustainable friction materials. Market penetration for high-performance ceramic and semi-metallic friction materials is on the rise, driven by their superior thermal stability and longevity.
The Automotive sector currently dominates the Friction Products Market, accounting for an estimated 70% of the global market share. Within this segment, brake pads represent the largest product category due to their frequent replacement needs. The increasing global vehicle parc, coupled with rising disposable incomes in emerging economies, is a significant driver for automotive friction product demand. Asia Pacific, particularly China and India, is emerging as the fastest-growing regional market, driven by aggressive automotive manufacturing expansion and supportive government policies. The introduction of stricter safety standards, such as advanced emergency braking systems (AEBS), further propels the demand for high-quality friction components. In the materials segment, semi-metallic friction materials continue to hold a substantial share due to their cost-effectiveness and performance balance, while ceramic friction materials are gaining traction in the premium automotive segment and for EV applications due to their low dust emission and quiet operation.
Product innovations in the Friction Products Market are primarily focused on enhancing performance, durability, and environmental sustainability. Leading companies are investing heavily in research and development to create advanced friction materials that offer superior braking performance under diverse conditions, reduce wear, and minimize noise and dust emissions. For instance, the development of low-copper and copper-free brake pads aligns with stringent environmental regulations. The integration of intelligent braking systems also necessitates friction products with consistent and predictable performance characteristics, offering a competitive advantage to manufacturers who can deliver such solutions.
The Friction Products Market is segmented across various product types, materials, applications, and end-user industries. The "Discs" segment is expected to witness significant growth, driven by advancements in disc materials and designs for enhanced heat dissipation and longevity. "Ceramic" friction materials are projected to capture a larger market share due to their eco-friendly properties and high performance in specialized applications. The "Automotive" end-user industry will continue to be the primary revenue generator, with strong growth anticipated in the "Clutch and Brake Systems" application. The "Railway" sector is also a crucial segment, demanding robust and reliable friction solutions for heavy-duty applications, with market sizes estimated to reach over USD 15,000 Million by 2033.
Key drivers fueling the growth of the Friction Products Market include stringent automotive safety regulations mandating advanced braking systems and improved vehicle performance. The escalating global vehicle production, particularly in emerging economies, directly translates to higher demand for replacement and original equipment friction parts. Furthermore, the rapid expansion of the electric vehicle (EV) market, while featuring regenerative braking, still necessitates robust friction braking systems, creating a unique demand dynamic. Technological innovations in material science, leading to quieter, more durable, and environmentally friendly friction products, also act as significant growth catalysts.
The Friction Products Market faces several challenges, including the volatility of raw material prices, particularly for metals used in semi-metallic and sintered metal friction products. The increasing stringency of environmental regulations, especially concerning the use of certain chemicals and the disposal of worn-out friction materials, presents ongoing compliance hurdles. Intense competition among numerous global and regional players can lead to price pressures and reduced profit margins. Supply chain disruptions, as witnessed in recent years, also pose a significant challenge to consistent production and timely delivery of friction products.
Emerging opportunities in the Friction Products Market lie in the development of friction materials for autonomous driving systems, which require highly precise and predictable braking performance. The growing demand for lightweight friction components to improve fuel efficiency in conventional vehicles and extend range in EVs also presents a significant avenue for innovation. The aftermarket segment, particularly in developing regions with a large and aging vehicle parc, offers substantial growth potential. Furthermore, the increasing focus on sustainable manufacturing practices and the development of biodegradable friction materials represent a long-term opportunity.
Leading Players in the Friction Products Market Market:
- ABS Friction
- Yantai Haina Brake Technology Co Ltd
- Japan Brake Industrial Co Ltd
- Akebono Brake Industry Co Ltd
- ITT Inc
- ANAND Group
- Miba AG
- Tenneco Inc
- Brembo SpA
- Nisshinbo Holdings Inc
Key Developments in Friction Products Market Industry:
- 2023: Akebono Brake Industry Co Ltd launched a new generation of friction materials for electric vehicles, focusing on reduced wear and improved NVH characteristics.
- 2022: Brembo SpA announced a strategic partnership with an EV manufacturer to develop bespoke braking solutions, highlighting their commitment to the EV sector.
- 2021: ABS Friction invested significantly in R&D to develop advanced composite friction materials, aiming to offer lighter and more durable alternatives.
- 2020: Yantai Haina Brake Technology Co Ltd expanded its production capacity to meet the growing demand for its high-performance brake pads in the Asian market.
- 2019: Nisshinbo Holdings Inc acquired a key supplier of friction material compounds, strengthening its vertical integration and supply chain.
Friction Products Market Market Concentration & Innovation
The Friction Products Market exhibits a moderate to high level of market concentration, with a mix of large multinational corporations and several regional and specialized manufacturers. Major players like Akebono Brake Industry Co Ltd and Brembo SpA hold significant market share, driven by their extensive product portfolios, global distribution networks, and strong brand recognition. Innovation in this sector is a critical differentiator, primarily driven by the increasing demand for enhanced safety, performance, and environmental sustainability. Key innovation drivers include the development of advanced composite materials, such as ceramics and aramid fibers, which offer superior thermal resistance, reduced wear, and lower noise and dust emissions compared to traditional semi-metallic and asbestos-based products. Regulatory frameworks, particularly those focused on reducing particulate matter emissions and improving vehicle safety standards (e.g., Euro 7 emissions standards, ADAS integration), are continuously pushing manufacturers to innovate. For example, the phasing out of copper in friction materials in certain regions necessitates the development of new formulations. Product substitutes are relatively limited, with advancements primarily focused on improving existing friction technologies rather than entirely replacing them. End-user trends, such as the growing preference for quieter and cleaner vehicles, are directly influencing R&D efforts. Mergers and Acquisition (M&A) activities are prevalent as companies seek to consolidate market share, acquire new technologies, and expand their geographical reach. The M&A deal value is projected to exceed USD 5,000 Million during the forecast period, indicating significant strategic consolidation within the industry.
Friction Products Market Industry Trends & Insights
The global Friction Products Market is characterized by dynamic growth, technological evolution, and shifting consumer preferences. The market's trajectory is significantly influenced by the automotive industry's transformation, including the burgeoning electric vehicle (EV) segment. While EVs utilize regenerative braking, the reliance on traditional friction brakes for primary stopping power and emergency situations remains crucial, thus sustaining demand for friction products. Furthermore, the increasing adoption of Advanced Driver-Assistance Systems (ADAS) necessitates friction components with highly predictable and consistent performance across a wide range of operating conditions, driving innovation in precision engineering and material science. The market penetration of advanced materials like ceramics and semi-metallics is on an upward trend, displacing older technologies due to their superior performance characteristics, such as enhanced thermal stability, reduced noise, vibration, and harshness (NVH), and improved durability. This shift is further accelerated by stringent environmental regulations, particularly in North America and Europe, which are progressively limiting the use of certain chemicals and metals in friction materials. The CAGR for the Friction Products Market is robust, estimated at approximately 6.5% from 2025 to 2033, reflecting a healthy expansion driven by both new vehicle sales and the substantial aftermarket for replacements. Consumer demand for quieter, cleaner, and longer-lasting braking solutions is becoming a paramount consideration, pushing manufacturers to invest in R&D that addresses these specific concerns. The competitive landscape is intense, with established global players continually vying for market dominance through product innovation, strategic partnerships, and efficient manufacturing processes. The ongoing trend of vehicle electrification, alongside the continuous improvement of internal combustion engine (ICE) vehicles, ensures a sustained and evolving demand for advanced friction products across diverse automotive applications. Beyond the automotive sector, the railway, aerospace, and mining industries also contribute significantly to market growth, each with its unique set of performance and durability requirements, further diversifying the market's revenue streams.
Dominant Markets & Segments in Friction Products Market
The Automotive sector stands as the undisputed dominant end-user industry in the Friction Products Market, commanding an estimated 70% of the global market share. This dominance is propelled by the sheer volume of vehicles produced and the constant need for brake pad and disc replacements. Within the automotive application, Clutch and Brake Systems are paramount, with brake systems alone representing the largest segment. The growth drivers in this dominant segment are multifaceted.
- Increasing Global Vehicle Parc: The rising number of vehicles on the road globally, particularly in emerging economies like Asia Pacific, directly translates to a higher demand for both original equipment (OE) and aftermarket friction products.
- Stringent Safety Regulations: Mandates for advanced braking systems, such as Electronic Stability Control (ESC) and Autonomous Emergency Braking (AEB), necessitate the use of high-performance, reliable friction materials, boosting the demand for premium products.
- Growth of Electric Vehicles (EVs): Despite regenerative braking, EVs still require conventional friction brakes for full stopping power and emergency situations. The development of specialized friction materials for EVs, optimized for lower wear and reduced dust, is a significant growth area.
- Aftermarket Demand: The aging vehicle population in developed nations fuels a substantial aftermarket for replacement friction parts, providing a consistent revenue stream.
In terms of product types, Pads are the leading segment within the automotive application, accounting for a substantial portion of the market due to their high wear rate and frequent replacement necessity. However, the Discs segment is also experiencing robust growth, driven by advancements in materials and designs that enhance heat dissipation and durability, particularly in high-performance and heavy-duty vehicles.
The material composition landscape is dynamic. Semi-metallic friction materials continue to hold a significant market share due to their cost-effectiveness and balanced performance across a wide range of temperatures. However, Ceramic friction materials are rapidly gaining traction, especially in the premium and EV segments, owing to their advantages in low dust emission, quiet operation, and longevity. Regulatory pressures to reduce copper and other harmful substances are further accelerating the adoption of ceramic and advanced semi-metallic formulations.
Geographically, Asia Pacific is emerging as the fastest-growing regional market for friction products. This growth is primarily attributed to the massive automotive manufacturing hubs in countries like China, India, and Southeast Asian nations, coupled with increasing disposable incomes and a rising middle class that drives vehicle ownership. Supportive government policies promoting domestic manufacturing and infrastructure development further bolster this trend.
Friction Products Market Product Developments
Product development in the Friction Products Market is centered on enhancing braking efficiency, durability, and environmental compatibility. Manufacturers are actively innovating with advanced material composites, such as high-performance ceramics and specialized semi-metallic formulations, to offer superior friction coefficients, extended product life, and reduced wear. A key trend is the development of low-dust and noise-free friction materials, responding to consumer demand for cleaner vehicles and improved cabin comfort. Furthermore, the integration of friction products with evolving vehicle technologies, including electric and autonomous systems, is driving the creation of components with precisely controlled performance characteristics, offering a significant competitive advantage to those who can meet these sophisticated requirements.
Report Scope & Segmentation Analysis
This report provides a comprehensive segmentation of the Friction Products Market. It analyzes the market across Type, including Discs, Pads, Blocks, Linings, and Other Types, with a focus on the growing demand for high-performance discs and pads. The Material segmentation covers Ceramic, Asbestos, Semi-metallic, Sintered Metals, Aramid Fibers, and Other Materials, highlighting the shift towards ceramic and advanced semi-metallic options due to environmental regulations and performance demands. The Application segmentation delves into Clutch and Brake Systems, Gear Tooth Systems, and Other Applications, with Clutch and Brake Systems being the dominant segment. Finally, the End-user Industry segmentation examines Automotive, Railway, Aerospace, Mining, and Other End-user Industries, with the Automotive sector holding the largest market share and the Railway sector showing steady growth for heavy-duty applications. Each segment is analyzed for its market size, growth projections, and competitive dynamics.
Key Drivers of Friction Products Market Growth
The Friction Products Market is propelled by several key drivers. Firstly, the continuous growth in global vehicle production, both for new vehicles and the aftermarket, directly fuels demand. Secondly, stringent automotive safety regulations worldwide necessitate advanced braking systems, leading to a higher demand for superior friction components. The burgeoning electric vehicle (EV) market, while employing regenerative braking, still relies on friction brakes, creating a unique demand dynamic. Technological advancements in material science, focusing on durability, reduced noise and dust, and enhanced thermal performance, are crucial in driving innovation and market expansion. Furthermore, increasing urbanization and infrastructure development in emerging economies are contributing to a rise in vehicle ownership, further boosting market growth.
Challenges in the Friction Products Market Sector
The Friction Products Market faces significant challenges. Fluctuations in the prices of key raw materials, such as copper, iron, and rare earth elements, can impact manufacturing costs and profitability. Increasingly stringent environmental regulations regarding emissions and the composition of friction materials (e.g., phasing out of certain metals) require substantial R&D investment for compliance. The highly competitive nature of the market leads to intense price pressures, particularly in the aftermarket segment. Supply chain disruptions, geopolitical uncertainties, and trade policies can also affect the availability and cost of raw materials and finished goods, posing operational challenges for manufacturers.
Emerging Opportunities in Friction Products Market
Emerging opportunities in the Friction Products Market lie in the development of specialized friction materials for autonomous vehicles, requiring unprecedented levels of precision and consistency. The growing demand for lightweight friction components to enhance fuel efficiency in conventional vehicles and extend the range of EVs presents a significant avenue for innovation. The expanding aftermarket in developing regions with large and aging vehicle fleets offers substantial growth potential. Moreover, the increasing global focus on sustainability is creating opportunities for biodegradable and eco-friendly friction materials. The development of intelligent braking systems that integrate friction components with sensors and control units will also unlock new market possibilities.
Key Developments in Friction Products Market Industry
- 2023: Akebono Brake Industry Co Ltd introduced its new "Pro-ACT Ultra-Premium" brake pads, engineered for enhanced durability and reduced noise, targeting the high-performance aftermarket.
- 2022: Brembo SpA unveiled its "B-M8" brake caliper system, designed for high-performance SUVs and pickup trucks, demonstrating their commitment to expanding their product range for larger vehicles.
- 2021: ABS Friction announced a strategic investment in advanced composite materials research to develop next-generation friction solutions for both automotive and industrial applications.
- 2020: Yantai Haina Brake Technology Co Ltd successfully obtained ISO 37001 certification for its anti-bribery management system, underscoring its commitment to ethical business practices.
- 2019: Nisshinbo Holdings Inc expanded its manufacturing capabilities in Southeast Asia to cater to the growing demand from automotive OEMs in the region.
Strategic Outlook for Friction Products Market Market
The strategic outlook for the Friction Products Market remains positive, driven by continuous innovation and expanding applications. The transition towards electric mobility, while presenting unique challenges, also offers significant opportunities for specialized friction solutions. Manufacturers focusing on R&D for quieter, cleaner, and more durable friction materials will be well-positioned for growth. The increasing stringency of global safety and environmental regulations will continue to be a key catalyst for product development and market adoption of advanced materials. Strategic collaborations and mergers will likely continue as companies seek to enhance their technological capabilities and market reach. The aftermarket segment, particularly in emerging economies, presents a stable and growing revenue stream. Companies that can effectively balance cost-competitiveness with high-performance and sustainable product offerings will thrive in this evolving market.
Friction Products Market Segmentation
-
1. Type
- 1.1. Discs
- 1.2. Pads
- 1.3. Blocks
- 1.4. Linings
- 1.5. Other Types
-
2. Material
- 2.1. Ceramic
- 2.2. Asbestos
- 2.3. Semi-metallic
- 2.4. Sintered Metals
- 2.5. Aramid Fibers
- 2.6. Other Materials
-
3. Application
- 3.1. Clutch and Brake Systems
- 3.2. Gear Tooth Systems
- 3.3. Other Applications
-
4. End-user Industry
- 4.1. Automotive
- 4.2. Railway
- 4.3. Aerospace
- 4.4. Mining
- 4.5. Other End-user Industries
Friction Products Market Segmentation By Geography
-
1. Asia Pacific
- 1.1. China
- 1.2. India
- 1.3. Japan
- 1.4. South Korea
- 1.5. Rest of Asia Pacific
-
2. North America
- 2.1. United States
- 2.2. Canada
- 2.3. Mexico
-
3. Europe
- 3.1. Germany
- 3.2. United Kingdom
- 3.3. France
- 3.4. Italy
- 3.5. Rest of Europe
-
4. South America
- 4.1. Brazil
- 4.2. Argentina
- 4.3. Rest of South America
-
5. Middle East and Africa
- 5.1. Saudi Arabia
- 5.2. South Africa
- 5.3. Rest of Middle East and Africa
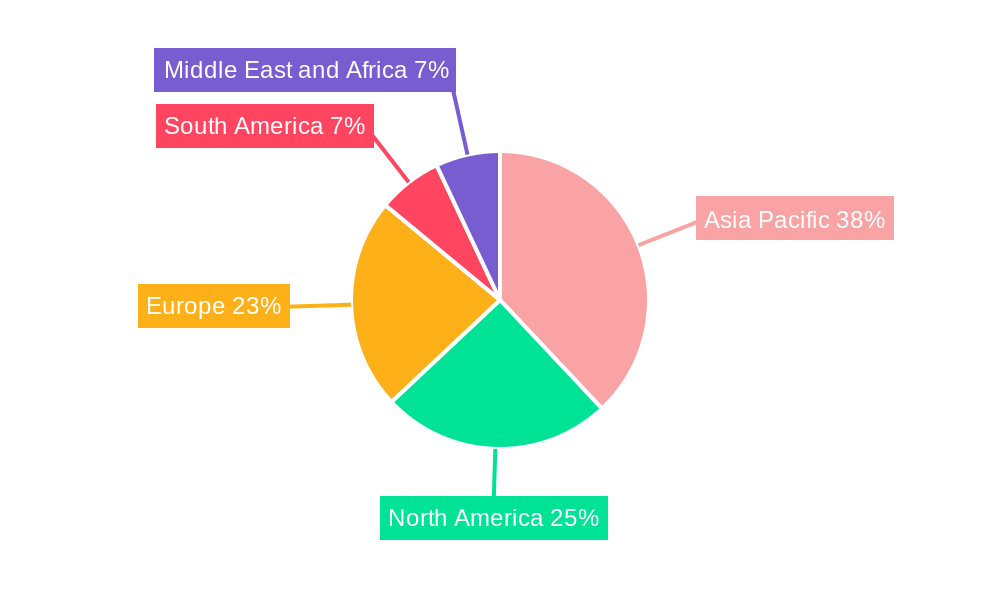
Friction Products Market Regional Market Share
Geographic Coverage of Friction Products Market
Friction Products Market REPORT HIGHLIGHTS
| Aspects | Details |
|---|---|
| Study Period | 2020-2034 |
| Base Year | 2025 |
| Estimated Year | 2026 |
| Forecast Period | 2026-2034 |
| Historical Period | 2020-2025 |
| Growth Rate | CAGR of 2.2% from 2020-2034 |
| Segmentation |
|
Table of Contents
- 1. Introduction
- 1.1. Research Scope
- 1.2. Market Segmentation
- 1.3. Research Objective
- 1.4. Definitions and Assumptions
- 2. Executive Summary
- 2.1. Market Snapshot
- 3. Market Dynamics
- 3.1. Market Drivers
- 3.2. Market Restrains
- 3.3. Market Trends
- 3.4. Market Opportunities
- 4. Market Factor Analysis
- 4.1. Porters Five Forces
- 4.1.1. Bargaining Power of Suppliers
- 4.1.2. Bargaining Power of Buyers
- 4.1.3. Threat of New Entrants
- 4.1.4. Threat of Substitutes
- 4.1.5. Competitive Rivalry
- 4.2. PESTEL analysis
- 4.3. BCG Analysis
- 4.3.1. Stars (High Growth, High Market Share)
- 4.3.2. Cash Cows (Low Growth, High Market Share)
- 4.3.3. Question Mark (High Growth, Low Market Share)
- 4.3.4. Dogs (Low Growth, Low Market Share)
- 4.4. Ansoff Matrix Analysis
- 4.5. Supply Chain Analysis
- 4.6. Regulatory Landscape
- 4.7. Current Market Potential and Opportunity Assessment (TAM–SAM–SOM Framework)
- 4.8. RAX Analyst Note
- 4.1. Porters Five Forces
- 5. Market Analysis, Insights and Forecast 2021-2033
- 5.1. Market Analysis, Insights and Forecast - by Type
- 5.1.1. Discs
- 5.1.2. Pads
- 5.1.3. Blocks
- 5.1.4. Linings
- 5.1.5. Other Types
- 5.2. Market Analysis, Insights and Forecast - by Material
- 5.2.1. Ceramic
- 5.2.2. Asbestos
- 5.2.3. Semi-metallic
- 5.2.4. Sintered Metals
- 5.2.5. Aramid Fibers
- 5.2.6. Other Materials
- 5.3. Market Analysis, Insights and Forecast - by Application
- 5.3.1. Clutch and Brake Systems
- 5.3.2. Gear Tooth Systems
- 5.3.3. Other Applications
- 5.4. Market Analysis, Insights and Forecast - by End-user Industry
- 5.4.1. Automotive
- 5.4.2. Railway
- 5.4.3. Aerospace
- 5.4.4. Mining
- 5.4.5. Other End-user Industries
- 5.5. Market Analysis, Insights and Forecast - by Region
- 5.5.1. Asia Pacific
- 5.5.2. North America
- 5.5.3. Europe
- 5.5.4. South America
- 5.5.5. Middle East and Africa
- 5.1. Market Analysis, Insights and Forecast - by Type
- 6. Global Friction Products Market Analysis, Insights and Forecast, 2021-2033
- 6.1. Market Analysis, Insights and Forecast - by Type
- 6.1.1. Discs
- 6.1.2. Pads
- 6.1.3. Blocks
- 6.1.4. Linings
- 6.1.5. Other Types
- 6.2. Market Analysis, Insights and Forecast - by Material
- 6.2.1. Ceramic
- 6.2.2. Asbestos
- 6.2.3. Semi-metallic
- 6.2.4. Sintered Metals
- 6.2.5. Aramid Fibers
- 6.2.6. Other Materials
- 6.3. Market Analysis, Insights and Forecast - by Application
- 6.3.1. Clutch and Brake Systems
- 6.3.2. Gear Tooth Systems
- 6.3.3. Other Applications
- 6.4. Market Analysis, Insights and Forecast - by End-user Industry
- 6.4.1. Automotive
- 6.4.2. Railway
- 6.4.3. Aerospace
- 6.4.4. Mining
- 6.4.5. Other End-user Industries
- 6.1. Market Analysis, Insights and Forecast - by Type
- 7. Asia Pacific Friction Products Market Analysis, Insights and Forecast, 2020-2032
- 7.1. Market Analysis, Insights and Forecast - by Type
- 7.1.1. Discs
- 7.1.2. Pads
- 7.1.3. Blocks
- 7.1.4. Linings
- 7.1.5. Other Types
- 7.2. Market Analysis, Insights and Forecast - by Material
- 7.2.1. Ceramic
- 7.2.2. Asbestos
- 7.2.3. Semi-metallic
- 7.2.4. Sintered Metals
- 7.2.5. Aramid Fibers
- 7.2.6. Other Materials
- 7.3. Market Analysis, Insights and Forecast - by Application
- 7.3.1. Clutch and Brake Systems
- 7.3.2. Gear Tooth Systems
- 7.3.3. Other Applications
- 7.4. Market Analysis, Insights and Forecast - by End-user Industry
- 7.4.1. Automotive
- 7.4.2. Railway
- 7.4.3. Aerospace
- 7.4.4. Mining
- 7.4.5. Other End-user Industries
- 7.1. Market Analysis, Insights and Forecast - by Type
- 8. North America Friction Products Market Analysis, Insights and Forecast, 2020-2032
- 8.1. Market Analysis, Insights and Forecast - by Type
- 8.1.1. Discs
- 8.1.2. Pads
- 8.1.3. Blocks
- 8.1.4. Linings
- 8.1.5. Other Types
- 8.2. Market Analysis, Insights and Forecast - by Material
- 8.2.1. Ceramic
- 8.2.2. Asbestos
- 8.2.3. Semi-metallic
- 8.2.4. Sintered Metals
- 8.2.5. Aramid Fibers
- 8.2.6. Other Materials
- 8.3. Market Analysis, Insights and Forecast - by Application
- 8.3.1. Clutch and Brake Systems
- 8.3.2. Gear Tooth Systems
- 8.3.3. Other Applications
- 8.4. Market Analysis, Insights and Forecast - by End-user Industry
- 8.4.1. Automotive
- 8.4.2. Railway
- 8.4.3. Aerospace
- 8.4.4. Mining
- 8.4.5. Other End-user Industries
- 8.1. Market Analysis, Insights and Forecast - by Type
- 9. Europe Friction Products Market Analysis, Insights and Forecast, 2020-2032
- 9.1. Market Analysis, Insights and Forecast - by Type
- 9.1.1. Discs
- 9.1.2. Pads
- 9.1.3. Blocks
- 9.1.4. Linings
- 9.1.5. Other Types
- 9.2. Market Analysis, Insights and Forecast - by Material
- 9.2.1. Ceramic
- 9.2.2. Asbestos
- 9.2.3. Semi-metallic
- 9.2.4. Sintered Metals
- 9.2.5. Aramid Fibers
- 9.2.6. Other Materials
- 9.3. Market Analysis, Insights and Forecast - by Application
- 9.3.1. Clutch and Brake Systems
- 9.3.2. Gear Tooth Systems
- 9.3.3. Other Applications
- 9.4. Market Analysis, Insights and Forecast - by End-user Industry
- 9.4.1. Automotive
- 9.4.2. Railway
- 9.4.3. Aerospace
- 9.4.4. Mining
- 9.4.5. Other End-user Industries
- 9.1. Market Analysis, Insights and Forecast - by Type
- 10. South America Friction Products Market Analysis, Insights and Forecast, 2020-2032
- 10.1. Market Analysis, Insights and Forecast - by Type
- 10.1.1. Discs
- 10.1.2. Pads
- 10.1.3. Blocks
- 10.1.4. Linings
- 10.1.5. Other Types
- 10.2. Market Analysis, Insights and Forecast - by Material
- 10.2.1. Ceramic
- 10.2.2. Asbestos
- 10.2.3. Semi-metallic
- 10.2.4. Sintered Metals
- 10.2.5. Aramid Fibers
- 10.2.6. Other Materials
- 10.3. Market Analysis, Insights and Forecast - by Application
- 10.3.1. Clutch and Brake Systems
- 10.3.2. Gear Tooth Systems
- 10.3.3. Other Applications
- 10.4. Market Analysis, Insights and Forecast - by End-user Industry
- 10.4.1. Automotive
- 10.4.2. Railway
- 10.4.3. Aerospace
- 10.4.4. Mining
- 10.4.5. Other End-user Industries
- 10.1. Market Analysis, Insights and Forecast - by Type
- 11. Middle East and Africa Friction Products Market Analysis, Insights and Forecast, 2020-2032
- 11.1. Market Analysis, Insights and Forecast - by Type
- 11.1.1. Discs
- 11.1.2. Pads
- 11.1.3. Blocks
- 11.1.4. Linings
- 11.1.5. Other Types
- 11.2. Market Analysis, Insights and Forecast - by Material
- 11.2.1. Ceramic
- 11.2.2. Asbestos
- 11.2.3. Semi-metallic
- 11.2.4. Sintered Metals
- 11.2.5. Aramid Fibers
- 11.2.6. Other Materials
- 11.3. Market Analysis, Insights and Forecast - by Application
- 11.3.1. Clutch and Brake Systems
- 11.3.2. Gear Tooth Systems
- 11.3.3. Other Applications
- 11.4. Market Analysis, Insights and Forecast - by End-user Industry
- 11.4.1. Automotive
- 11.4.2. Railway
- 11.4.3. Aerospace
- 11.4.4. Mining
- 11.4.5. Other End-user Industries
- 11.1. Market Analysis, Insights and Forecast - by Type
- 12. Competitive Analysis
- 12.1. Company Profiles
- 12.1.1 ABS Friction
- 12.1.1.1. Company Overview
- 12.1.1.2. Products
- 12.1.1.3. Company Financials
- 12.1.1.4. SWOT Analysis
- 12.1.2 Yantai Haina Brake Technology Co Ltd*List Not Exhaustive
- 12.1.2.1. Company Overview
- 12.1.2.2. Products
- 12.1.2.3. Company Financials
- 12.1.2.4. SWOT Analysis
- 12.1.3 Japan Brake Industrial Co Ltd
- 12.1.3.1. Company Overview
- 12.1.3.2. Products
- 12.1.3.3. Company Financials
- 12.1.3.4. SWOT Analysis
- 12.1.4 Akebono Brake Industry Co Ltd
- 12.1.4.1. Company Overview
- 12.1.4.2. Products
- 12.1.4.3. Company Financials
- 12.1.4.4. SWOT Analysis
- 12.1.5 ITT Inc
- 12.1.5.1. Company Overview
- 12.1.5.2. Products
- 12.1.5.3. Company Financials
- 12.1.5.4. SWOT Analysis
- 12.1.6 ANAND Group
- 12.1.6.1. Company Overview
- 12.1.6.2. Products
- 12.1.6.3. Company Financials
- 12.1.6.4. SWOT Analysis
- 12.1.7 Miba AG
- 12.1.7.1. Company Overview
- 12.1.7.2. Products
- 12.1.7.3. Company Financials
- 12.1.7.4. SWOT Analysis
- 12.1.8 Tenneco Inc
- 12.1.8.1. Company Overview
- 12.1.8.2. Products
- 12.1.8.3. Company Financials
- 12.1.8.4. SWOT Analysis
- 12.1.9 Brembo SpA
- 12.1.9.1. Company Overview
- 12.1.9.2. Products
- 12.1.9.3. Company Financials
- 12.1.9.4. SWOT Analysis
- 12.1.10 Nisshinbo Holdings Inc
- 12.1.10.1. Company Overview
- 12.1.10.2. Products
- 12.1.10.3. Company Financials
- 12.1.10.4. SWOT Analysis
- 12.1.1 ABS Friction
- 12.2. Market Entropy
- 12.2.1 Company's Key Areas Served
- 12.2.2 Recent Developments
- 12.3. Company Market Share Analysis 2025
- 12.3.1 Top 5 Companies Market Share Analysis
- 12.3.2 Top 3 Companies Market Share Analysis
- 12.4. List of Potential Customers
- 13. Research Methodology
List of Figures
- Figure 1: Global Friction Products Market Revenue Breakdown (billion, %) by Region 2025 & 2033
- Figure 2: Asia Pacific Friction Products Market Revenue (billion), by Type 2025 & 2033
- Figure 3: Asia Pacific Friction Products Market Revenue Share (%), by Type 2025 & 2033
- Figure 4: Asia Pacific Friction Products Market Revenue (billion), by Material 2025 & 2033
- Figure 5: Asia Pacific Friction Products Market Revenue Share (%), by Material 2025 & 2033
- Figure 6: Asia Pacific Friction Products Market Revenue (billion), by Application 2025 & 2033
- Figure 7: Asia Pacific Friction Products Market Revenue Share (%), by Application 2025 & 2033
- Figure 8: Asia Pacific Friction Products Market Revenue (billion), by End-user Industry 2025 & 2033
- Figure 9: Asia Pacific Friction Products Market Revenue Share (%), by End-user Industry 2025 & 2033
- Figure 10: Asia Pacific Friction Products Market Revenue (billion), by Country 2025 & 2033
- Figure 11: Asia Pacific Friction Products Market Revenue Share (%), by Country 2025 & 2033
- Figure 12: North America Friction Products Market Revenue (billion), by Type 2025 & 2033
- Figure 13: North America Friction Products Market Revenue Share (%), by Type 2025 & 2033
- Figure 14: North America Friction Products Market Revenue (billion), by Material 2025 & 2033
- Figure 15: North America Friction Products Market Revenue Share (%), by Material 2025 & 2033
- Figure 16: North America Friction Products Market Revenue (billion), by Application 2025 & 2033
- Figure 17: North America Friction Products Market Revenue Share (%), by Application 2025 & 2033
- Figure 18: North America Friction Products Market Revenue (billion), by End-user Industry 2025 & 2033
- Figure 19: North America Friction Products Market Revenue Share (%), by End-user Industry 2025 & 2033
- Figure 20: North America Friction Products Market Revenue (billion), by Country 2025 & 2033
- Figure 21: North America Friction Products Market Revenue Share (%), by Country 2025 & 2033
- Figure 22: Europe Friction Products Market Revenue (billion), by Type 2025 & 2033
- Figure 23: Europe Friction Products Market Revenue Share (%), by Type 2025 & 2033
- Figure 24: Europe Friction Products Market Revenue (billion), by Material 2025 & 2033
- Figure 25: Europe Friction Products Market Revenue Share (%), by Material 2025 & 2033
- Figure 26: Europe Friction Products Market Revenue (billion), by Application 2025 & 2033
- Figure 27: Europe Friction Products Market Revenue Share (%), by Application 2025 & 2033
- Figure 28: Europe Friction Products Market Revenue (billion), by End-user Industry 2025 & 2033
- Figure 29: Europe Friction Products Market Revenue Share (%), by End-user Industry 2025 & 2033
- Figure 30: Europe Friction Products Market Revenue (billion), by Country 2025 & 2033
- Figure 31: Europe Friction Products Market Revenue Share (%), by Country 2025 & 2033
- Figure 32: South America Friction Products Market Revenue (billion), by Type 2025 & 2033
- Figure 33: South America Friction Products Market Revenue Share (%), by Type 2025 & 2033
- Figure 34: South America Friction Products Market Revenue (billion), by Material 2025 & 2033
- Figure 35: South America Friction Products Market Revenue Share (%), by Material 2025 & 2033
- Figure 36: South America Friction Products Market Revenue (billion), by Application 2025 & 2033
- Figure 37: South America Friction Products Market Revenue Share (%), by Application 2025 & 2033
- Figure 38: South America Friction Products Market Revenue (billion), by End-user Industry 2025 & 2033
- Figure 39: South America Friction Products Market Revenue Share (%), by End-user Industry 2025 & 2033
- Figure 40: South America Friction Products Market Revenue (billion), by Country 2025 & 2033
- Figure 41: South America Friction Products Market Revenue Share (%), by Country 2025 & 2033
- Figure 42: Middle East and Africa Friction Products Market Revenue (billion), by Type 2025 & 2033
- Figure 43: Middle East and Africa Friction Products Market Revenue Share (%), by Type 2025 & 2033
- Figure 44: Middle East and Africa Friction Products Market Revenue (billion), by Material 2025 & 2033
- Figure 45: Middle East and Africa Friction Products Market Revenue Share (%), by Material 2025 & 2033
- Figure 46: Middle East and Africa Friction Products Market Revenue (billion), by Application 2025 & 2033
- Figure 47: Middle East and Africa Friction Products Market Revenue Share (%), by Application 2025 & 2033
- Figure 48: Middle East and Africa Friction Products Market Revenue (billion), by End-user Industry 2025 & 2033
- Figure 49: Middle East and Africa Friction Products Market Revenue Share (%), by End-user Industry 2025 & 2033
- Figure 50: Middle East and Africa Friction Products Market Revenue (billion), by Country 2025 & 2033
- Figure 51: Middle East and Africa Friction Products Market Revenue Share (%), by Country 2025 & 2033
List of Tables
- Table 1: Global Friction Products Market Revenue billion Forecast, by Type 2020 & 2033
- Table 2: Global Friction Products Market Revenue billion Forecast, by Material 2020 & 2033
- Table 3: Global Friction Products Market Revenue billion Forecast, by Application 2020 & 2033
- Table 4: Global Friction Products Market Revenue billion Forecast, by End-user Industry 2020 & 2033
- Table 5: Global Friction Products Market Revenue billion Forecast, by Region 2020 & 2033
- Table 6: Global Friction Products Market Revenue billion Forecast, by Type 2020 & 2033
- Table 7: Global Friction Products Market Revenue billion Forecast, by Material 2020 & 2033
- Table 8: Global Friction Products Market Revenue billion Forecast, by Application 2020 & 2033
- Table 9: Global Friction Products Market Revenue billion Forecast, by End-user Industry 2020 & 2033
- Table 10: Global Friction Products Market Revenue billion Forecast, by Country 2020 & 2033
- Table 11: China Friction Products Market Revenue (billion) Forecast, by Application 2020 & 2033
- Table 12: India Friction Products Market Revenue (billion) Forecast, by Application 2020 & 2033
- Table 13: Japan Friction Products Market Revenue (billion) Forecast, by Application 2020 & 2033
- Table 14: South Korea Friction Products Market Revenue (billion) Forecast, by Application 2020 & 2033
- Table 15: Rest of Asia Pacific Friction Products Market Revenue (billion) Forecast, by Application 2020 & 2033
- Table 16: Global Friction Products Market Revenue billion Forecast, by Type 2020 & 2033
- Table 17: Global Friction Products Market Revenue billion Forecast, by Material 2020 & 2033
- Table 18: Global Friction Products Market Revenue billion Forecast, by Application 2020 & 2033
- Table 19: Global Friction Products Market Revenue billion Forecast, by End-user Industry 2020 & 2033
- Table 20: Global Friction Products Market Revenue billion Forecast, by Country 2020 & 2033
- Table 21: United States Friction Products Market Revenue (billion) Forecast, by Application 2020 & 2033
- Table 22: Canada Friction Products Market Revenue (billion) Forecast, by Application 2020 & 2033
- Table 23: Mexico Friction Products Market Revenue (billion) Forecast, by Application 2020 & 2033
- Table 24: Global Friction Products Market Revenue billion Forecast, by Type 2020 & 2033
- Table 25: Global Friction Products Market Revenue billion Forecast, by Material 2020 & 2033
- Table 26: Global Friction Products Market Revenue billion Forecast, by Application 2020 & 2033
- Table 27: Global Friction Products Market Revenue billion Forecast, by End-user Industry 2020 & 2033
- Table 28: Global Friction Products Market Revenue billion Forecast, by Country 2020 & 2033
- Table 29: Germany Friction Products Market Revenue (billion) Forecast, by Application 2020 & 2033
- Table 30: United Kingdom Friction Products Market Revenue (billion) Forecast, by Application 2020 & 2033
- Table 31: France Friction Products Market Revenue (billion) Forecast, by Application 2020 & 2033
- Table 32: Italy Friction Products Market Revenue (billion) Forecast, by Application 2020 & 2033
- Table 33: Rest of Europe Friction Products Market Revenue (billion) Forecast, by Application 2020 & 2033
- Table 34: Global Friction Products Market Revenue billion Forecast, by Type 2020 & 2033
- Table 35: Global Friction Products Market Revenue billion Forecast, by Material 2020 & 2033
- Table 36: Global Friction Products Market Revenue billion Forecast, by Application 2020 & 2033
- Table 37: Global Friction Products Market Revenue billion Forecast, by End-user Industry 2020 & 2033
- Table 38: Global Friction Products Market Revenue billion Forecast, by Country 2020 & 2033
- Table 39: Brazil Friction Products Market Revenue (billion) Forecast, by Application 2020 & 2033
- Table 40: Argentina Friction Products Market Revenue (billion) Forecast, by Application 2020 & 2033
- Table 41: Rest of South America Friction Products Market Revenue (billion) Forecast, by Application 2020 & 2033
- Table 42: Global Friction Products Market Revenue billion Forecast, by Type 2020 & 2033
- Table 43: Global Friction Products Market Revenue billion Forecast, by Material 2020 & 2033
- Table 44: Global Friction Products Market Revenue billion Forecast, by Application 2020 & 2033
- Table 45: Global Friction Products Market Revenue billion Forecast, by End-user Industry 2020 & 2033
- Table 46: Global Friction Products Market Revenue billion Forecast, by Country 2020 & 2033
- Table 47: Saudi Arabia Friction Products Market Revenue (billion) Forecast, by Application 2020 & 2033
- Table 48: South Africa Friction Products Market Revenue (billion) Forecast, by Application 2020 & 2033
- Table 49: Rest of Middle East and Africa Friction Products Market Revenue (billion) Forecast, by Application 2020 & 2033
Frequently Asked Questions
1. What is the projected Compound Annual Growth Rate (CAGR) of the Friction Products Market?
The projected CAGR is approximately 2.2%.
2. Which companies are prominent players in the Friction Products Market?
Key companies in the market include ABS Friction, Yantai Haina Brake Technology Co Ltd*List Not Exhaustive, Japan Brake Industrial Co Ltd, Akebono Brake Industry Co Ltd, ITT Inc, ANAND Group, Miba AG, Tenneco Inc, Brembo SpA, Nisshinbo Holdings Inc.
3. What are the main segments of the Friction Products Market?
The market segments include Type, Material, Application, End-user Industry.
4. Can you provide details about the market size?
The market size is estimated to be USD 13.32 billion as of 2022.
5. What are some drivers contributing to market growth?
Growing Need for Industrial Machinery; Other Drivers.
6. What are the notable trends driving market growth?
The Automotive Industry Dominates the Market.
7. Are there any restraints impacting market growth?
High Maintenance and Cost of Friction Materials; Impact of COVID-19 Outbreak; Other Restraints.
8. Can you provide examples of recent developments in the market?
N/A
9. What pricing options are available for accessing the report?
Pricing options include single-user, multi-user, and enterprise licenses priced at USD 4750, USD 5250, and USD 8750 respectively.
10. Is the market size provided in terms of value or volume?
The market size is provided in terms of value, measured in billion.
11. Are there any specific market keywords associated with the report?
Yes, the market keyword associated with the report is "Friction Products Market," which aids in identifying and referencing the specific market segment covered.
12. How do I determine which pricing option suits my needs best?
The pricing options vary based on user requirements and access needs. Individual users may opt for single-user licenses, while businesses requiring broader access may choose multi-user or enterprise licenses for cost-effective access to the report.
13. Are there any additional resources or data provided in the Friction Products Market report?
While the report offers comprehensive insights, it's advisable to review the specific contents or supplementary materials provided to ascertain if additional resources or data are available.
14. How can I stay updated on further developments or reports in the Friction Products Market?
To stay informed about further developments, trends, and reports in the Friction Products Market, consider subscribing to industry newsletters, following relevant companies and organizations, or regularly checking reputable industry news sources and publications.
Methodology
Step 1 - Identification of Relevant Samples Size from Population Database


Step 2 - Approaches for Defining Global Market Size (Value, Volume* & Price*)

Note*: In applicable scenarios
Step 3 - Data Sources
Primary Research
- Web Analytics
- Survey Reports
- Research Institute
- Latest Research Reports
- Opinion Leaders
Secondary Research
- Annual Reports
- White Paper
- Latest Press Release
- Industry Association
- Paid Database
- Investor Presentations

Step 4 - Data Triangulation
Involves using different sources of information in order to increase the validity of a study
These sources are likely to be stakeholders in a program - participants, other researchers, program staff, other community members, and so on.
Then we put all data in single framework & apply various statistical tools to find out the dynamic on the market.
During the analysis stage, feedback from the stakeholder groups would be compared to determine areas of agreement as well as areas of divergence