

Key Insights
The global Fruits & Vegetables Processing market is set for robust expansion, with an estimated size of $10.06 billion in 2024. The industry is projected to grow at a Compound Annual Growth Rate (CAGR) of 6.5% from 2024 to 2033, reaching a significant market value by the end of the forecast period. This growth is driven by evolving consumer preferences for health and convenience, coupled with advancements in processing technologies. The increasing demand for convenient, year-round access to processed produce is a key market driver. Innovations in processing equipment, from washing to packaging, enhance efficiency and product quality, further stimulating market growth. The sector includes fresh, fresh-cut, canned, frozen, and dried fruits and vegetables, serving diverse consumer needs.
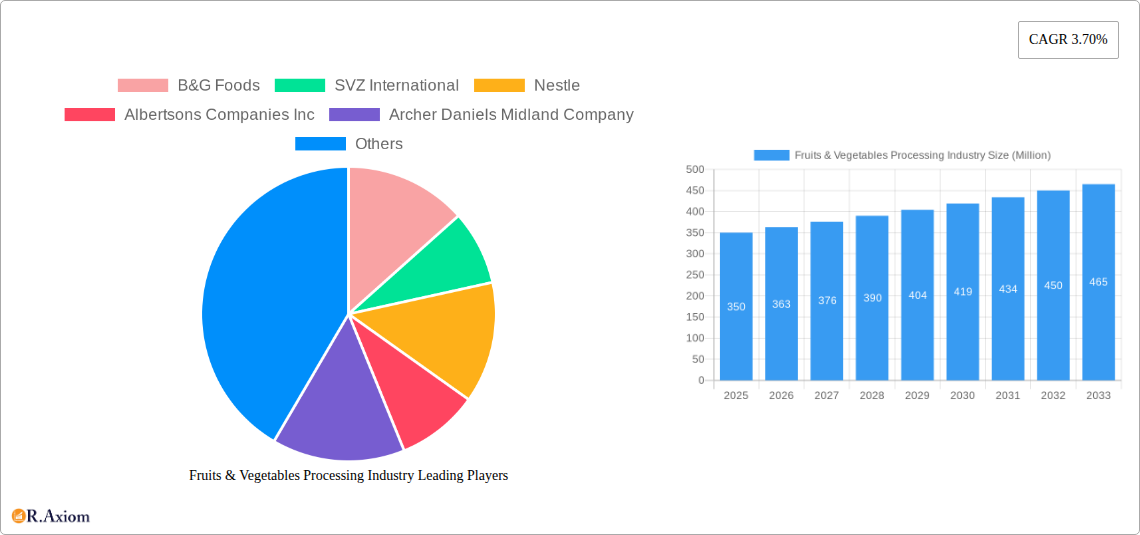
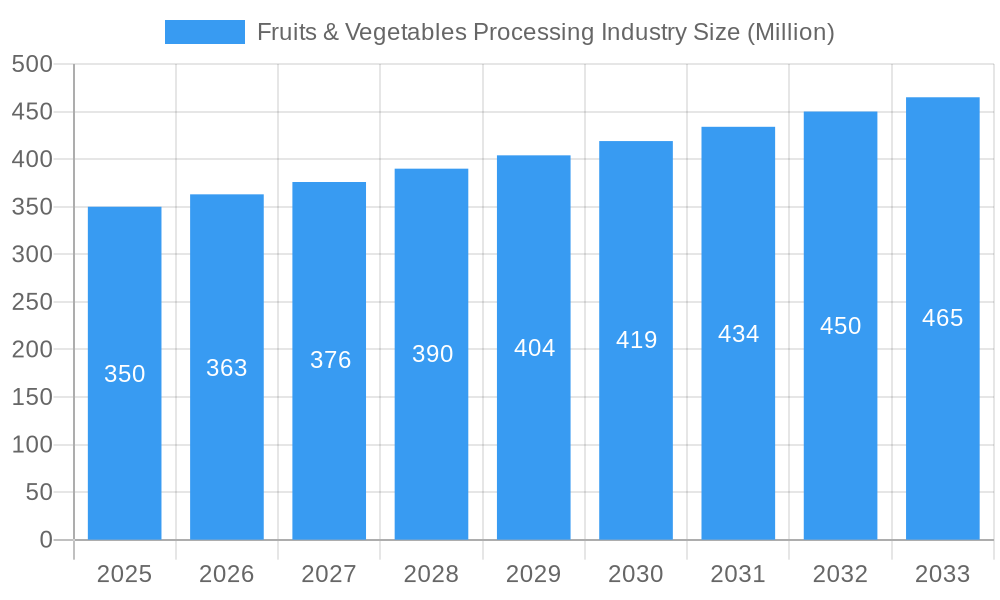
Fruits & Vegetables Processing Industry Market Size (In Billion)
Key trends shaping the Fruits & Vegetables Processing market include the rising popularity of frozen and fresh-cut produce for their extended shelf life and convenience. Consumers are increasingly prioritizing minimally processed options that preserve nutritional value and natural taste. Sustainable packaging and a focus on reducing food waste are also gaining traction. Challenges include price volatility of raw materials due to seasonality and climate change, and stringent food safety regulations requiring continuous compliance investment. Leading companies are investing in R&D to innovate and expand their product offerings. The Asia Pacific region, particularly China and India, is anticipated to be a major growth hub due to its large population and rising disposable incomes, fueling demand for processed fruits and vegetables.
Fruits & Vegetables Processing Industry Company Market Share
Fruits & Vegetables Processing Industry Market Concentration & Innovation
The global fruits and vegetables processing industry is characterized by a moderate to high market concentration, with a significant share held by a few large multinational corporations alongside a robust segment of regional and specialized players. Innovation acts as a primary catalyst, driving differentiation and market penetration across various product categories. Key innovation drivers include advancements in processing equipment, such as sophisticated sorting and inspection technologies like Sorma Group's HyperVision platform, which promises enhanced quality control. Furthermore, a growing consumer demand for convenience and healthier options fuels innovation in fresh-cut produce, ready-to-eat meals, and minimally processed products. Regulatory frameworks, particularly concerning food safety standards and labeling requirements, play a crucial role in shaping market dynamics and encouraging investments in advanced processing techniques. Product substitutes, such as the increasing availability of plant-based protein alternatives and home-grown produce, pose a challenge, necessitating continuous product development and value addition in the processed fruits and vegetables sector. End-user trends are heavily influenced by growing health consciousness, a desire for sustainable sourcing, and the demand for exotic and novel flavors. Mergers and acquisitions (M&A) activity is a significant indicator of market consolidation and strategic expansion. For instance, The Kraft Heinz Company's acquisition of 'Hemmer' in September 2021 for an undisclosed but substantial sum highlights a strategic move to bolster its presence in emerging markets and expand its product portfolio. Similarly, Agrana's acquisition of Taiyo Kagaku's fruit preparations business in March 2021 underscores the trend of global players seeking to strengthen their foothold in key geographical regions. These M&A activities, estimated to represent billions in deal value over the study period, reshape market shares and foster competitive advantages.
Fruits & Vegetables Processing Industry Industry Trends & Insights
The global fruits and vegetables processing industry is poised for robust growth, driven by a confluence of escalating consumer demand for convenient, healthy, and sustainably sourced food products. This expansive market is projected to experience a Compound Annual Growth Rate (CAGR) of approximately 7.2% from 2025 to 2033, reaching an estimated market value of over $1,500,000 million by the end of the forecast period. The base year of 2025 estimates the market at over $900,000 million. A pivotal trend shaping the industry is the increasing consumer preference for health and wellness, leading to a surge in demand for minimally processed fruits and vegetables, frozen options, and nutrient-rich juices and smoothies. This shift is directly impacting the market penetration of fresh-cut and frozen segments, which are experiencing significant expansion as consumers seek to incorporate more plant-based foods into their diets without compromising on convenience. Technological disruptions are continuously redefining operational efficiencies and product quality. Advancements in processing equipment, including automated washing systems, precision filling technologies, and advanced packaging solutions that extend shelf life and preserve nutritional value, are becoming increasingly crucial. For example, the development of sophisticated sorting technologies like Sorma Group's HyperVision platform in January 2021 is revolutionizing quality control, enabling faster and more accurate identification of produce defects. Furthermore, the integration of artificial intelligence and machine learning in processing lines is optimizing resource utilization and minimizing waste, contributing to more sustainable operations. Competitive dynamics are intensifying, with both established players and emerging startups vying for market share. Strategic alliances, mergers, and acquisitions, such as The Kraft Heinz Company's agreement to acquire 'Hemmer' in September 2021 and Agrana's acquisition of Taiyo Kagaku's fruit preparations business in March 2021, are key strategies employed by leading companies to expand their geographical reach, diversify their product offerings, and enhance their competitive edge. The growing emphasis on traceability and transparency in the food supply chain is also compelling processors to invest in advanced tracking systems and sustainable sourcing practices, further influencing consumer purchasing decisions and market dynamics. The global market penetration for processed fruits and vegetables is estimated to reach over 65% by 2033.
Dominant Markets & Segments in Fruits & Vegetables Processing Industry
The global fruits and vegetables processing industry exhibits distinct dominance across various segments and geographical regions, driven by a complex interplay of economic policies, infrastructure development, consumer demand, and supply chain efficiencies.
Dominant Product Segments:
- Vegetables: Vegetables processing commands a larger market share, estimated at over 55% of the total market value in 2025. This dominance is attributed to their widespread culinary applications, year-round availability through cultivation and processing, and their integral role in various cuisines worldwide.
- Frozen Products: The frozen segment is a leading contributor, projected to hold approximately 30% of the market value by 2025. The extended shelf life, preserved nutritional value, and convenience of frozen fruits and vegetables align perfectly with modern consumer lifestyles.
- Fresh-cut Produce: Experiencing rapid growth, the fresh-cut segment is increasingly dominating consumer preference for immediate consumption, estimated to grow at a CAGR of over 8% during the forecast period. This segment offers unparalleled convenience and accessibility for busy consumers.
Dominant Geographical Markets:
- North America: This region leads in market value, accounting for an estimated 30% of the global market in 2025. This dominance is fueled by high disposable incomes, a strong demand for convenience foods, advanced processing infrastructure, and significant investments in food technology.
- Europe: Following closely, Europe represents approximately 28% of the market share. The region benefits from a well-established food processing industry, a strong emphasis on health and safety regulations, and a growing consumer inclination towards organic and sustainably produced food items.
Key Drivers of Dominance:
- Economic Policies: Favorable government policies supporting agricultural output, food processing investments, and export incentives in regions like North America and Europe significantly bolster their dominant positions.
- Infrastructure Development: Robust cold chain logistics, efficient transportation networks, and widespread availability of advanced processing facilities are critical enablers for market leaders.
- Consumer Preferences: Evolving consumer tastes, a growing awareness of health benefits associated with fruits and vegetables, and a demand for diverse product offerings drive the expansion of key segments.
- Technological Advancements: Continuous innovation in processing equipment, packaging technologies, and quality control systems allows dominant players to offer superior products and maintain a competitive edge.
- Supply Chain Efficiency: Integrated supply chains, from sourcing to distribution, ensure consistent availability and quality, further solidifying the market presence of dominant regions and companies.
Fruits & Vegetables Processing Industry Product Developments
Product development in the fruits and vegetables processing industry is increasingly focused on enhancing convenience, nutritional value, and sustainability. Innovations include the creation of shelf-stable, ready-to-eat fruit and vegetable bowls, nutrient-fortified vegetable chips, and plant-based meat alternatives derived from vegetable proteins. Advanced processing techniques are employed to minimize nutrient loss and maintain the natural taste and texture of produce, catering to the growing demand for healthy and minimally processed foods. The development of smart packaging solutions that extend shelf life and provide real-time freshness indicators offers a significant competitive advantage.
Report Scope & Segmentation Analysis
The Fruits & Vegetables Processing Industry report offers a comprehensive analysis across several key segmentation dimensions to provide granular insights into market dynamics.
- Type: The market is segmented into Fruits and Vegetables, each with distinct processing demands and consumer bases. Growth projections indicate a steady expansion in both, with vegetables currently holding a larger market share.
- Product: Segmentation includes Fresh, Fresh-cut, Canned, Frozen, and Dried products. The Fresh-cut and Frozen segments are experiencing the most dynamic growth due to convenience and extended shelf life, respectively.
- Processing Equipment: Analysis extends to Pre-processing, Washing, Filling, Seasoning, and Packaging equipment. Investments in advanced automation and hygiene technologies within these sub-segments are critical for operational efficiency and product quality, with the packaging segment projected for significant growth owing to innovative preservation solutions.
Key Drivers of Fruits & Vegetables Processing Industry Growth
Several potent drivers are fueling the expansion of the fruits and vegetables processing industry.
- Growing Health Consciousness: Increasing consumer awareness about the health benefits of fruits and vegetables is a primary driver, boosting demand for processed and value-added products.
- Convenience Demand: The rising global demand for convenient, ready-to-eat, and minimally processed food options driven by busy lifestyles significantly propels market growth.
- Technological Advancements: Innovations in processing, packaging, and preservation technologies are enhancing product quality, extending shelf life, and improving efficiency, thereby stimulating market expansion.
- Emerging Market Growth: Rapid urbanization and rising disposable incomes in developing economies are creating substantial opportunities for processed fruits and vegetables.
- Government Support and Initiatives: Favorable policies, subsidies, and investments in food processing infrastructure by governments worldwide are also contributing to the industry's upward trajectory.
Challenges in the Fruits & Vegetables Processing Industry Sector
Despite its robust growth prospects, the fruits and vegetables processing industry faces several significant challenges.
- Perishability and Supply Chain Volatility: The inherent perishable nature of raw materials necessitates stringent supply chain management and cold chain infrastructure, which can be costly and prone to disruptions from climate change and logistical issues.
- Regulatory Hurdles: Stringent food safety regulations, labeling requirements, and quality standards across different regions can pose compliance challenges and increase operational costs for processors.
- Price Volatility of Raw Materials: Fluctuations in the prices of fruits and vegetables due to seasonal variations, weather conditions, and agricultural output can impact profit margins for processors.
- Intense Competition: The market is highly competitive, with numerous players vying for market share, leading to price pressures and the need for continuous innovation to maintain a competitive edge.
- Consumer Skepticism towards Processed Foods: A segment of consumers remains skeptical about the health implications of processed foods, demanding greater transparency and "clean label" products.
Emerging Opportunities in Fruits & Vegetables Processing Industry
The fruits and vegetables processing industry is ripe with emerging opportunities driven by evolving consumer preferences and technological advancements.
- Plant-Based Alternatives: The booming demand for plant-based diets presents a significant opportunity for processors to develop innovative meat and dairy alternatives derived from fruits and vegetables.
- Functional Foods and Nutraceuticals: Incorporating health-promoting ingredients and creating functional food products fortified with vitamins, minerals, and antioxidants offers a high-growth avenue.
- Sustainable and Eco-Friendly Packaging: The increasing consumer demand for sustainable packaging solutions, such as biodegradable and recyclable materials, presents an opportunity for innovation and market differentiation.
- Geographical Expansion: Untapped markets in emerging economies, particularly in Asia and Africa, offer substantial growth potential due to rising incomes and evolving dietary habits.
- Upcycled Ingredients: Utilizing by-products and waste streams from fruit and vegetable processing to create value-added ingredients or products aligns with sustainability trends and opens new revenue streams.
Leading Players in the Fruits & Vegetables Processing Industry Market
- B&G Foods
- SVZ International
- Nestle
- Albertsons Companies Inc
- Archer Daniels Midland Company
- OLAM International
- Conagra Foods
- Agrana
- Kraft Heinz Company
Key Developments in Fruits & Vegetables Processing Industry Industry
- September 2021: The Kraft Heinz Company entered an agreement to acquire 'Hemmer,' a Brazilian company focused on condiments and sauces. This acquisition aims to expand consumers' taste options in Brazil and bolster Kraft Heinz's strategy for its International Taste Elevation product platform and presence in emerging markets.
- March 2021: Austrian food company Agrana expanded its presence in the Asian market by acquiring the fruit preparations business from Japan-based Taiyo Kagaku Co. This deal also included the acquisition of Taiyo Kagaku's fruit preparation plant in Yokkaichi, southern Japan.
- January 2021: Sorma Group developed the HyperVision platform, a cutting-edge, multi-wavelength lighting solution designed for superior fruit sorting. This advanced technology can analyze up to 15 pieces of fruit per second, enhancing efficiency and quality control in the industry.
Strategic Outlook for Fruits & Vegetables Processing Industry Market
The strategic outlook for the fruits and vegetables processing industry remains exceptionally positive, driven by a sustained global shift towards healthier eating habits and an increasing reliance on convenient food solutions. Investments in automation and smart processing technologies will be critical for enhancing operational efficiency and reducing costs. The growing demand for plant-based products and functional foods presents a significant avenue for innovation and market expansion. Furthermore, the industry will witness a continued trend of consolidation through strategic mergers and acquisitions as leading players seek to strengthen their global presence and diversify their product portfolios. Companies that prioritize sustainability, ethical sourcing, and transparent labeling will likely gain a competitive advantage and resonate with an increasingly conscious consumer base. The focus on reducing food waste and developing value-added products from by-products will also be a key strategic imperative.
Fruits & Vegetables Processing Industry Segmentation
-
1. Type
- 1.1. Fruits
- 1.2. Vegetables
-
2. Product
- 2.1. Fresh
- 2.2. Fresh-cut
- 2.3. Canned
- 2.4. Frozen
- 2.5. Dried
-
3. Processing Equipment
- 3.1. Pre-processing
- 3.2. Washing
- 3.3. Filling
- 3.4. Seasoning
- 3.5. Packaging
Fruits & Vegetables Processing Industry Segmentation By Geography
-
1. North America
- 1.1. United States
- 1.2. Canada
- 1.3. Mexico
- 1.4. Rest of North America
-
2. Europe
- 2.1. Spain
- 2.2. United Kingdom
- 2.3. Germany
- 2.4. France
- 2.5. Italy
- 2.6. Russia
- 2.7. Rest of Europe
-
3. Asia Pacific
- 3.1. China
- 3.2. Japan
- 3.3. India
- 3.4. Australia
- 3.5. Rest of Asia Pacific
-
4. South America
- 4.1. Brazil
- 4.2. Argentina
- 4.3. Rest of South America
-
5. Middle East and Africa
- 5.1. South Africa
- 5.2. United Arab Emirates
- 5.3. Rest of Middle East and Africa
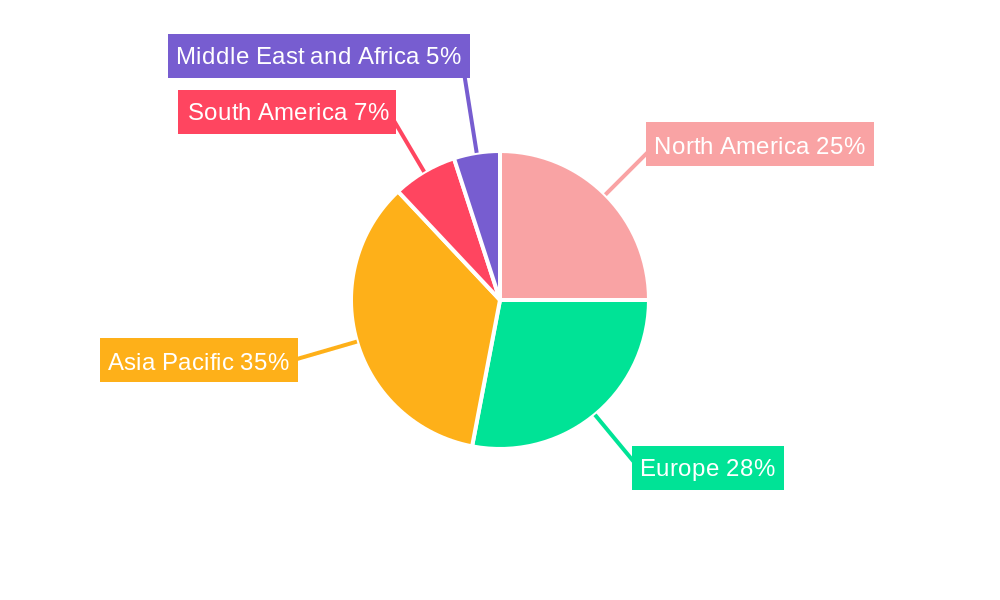
Fruits & Vegetables Processing Industry Regional Market Share
Geographic Coverage of Fruits & Vegetables Processing Industry
Fruits & Vegetables Processing Industry REPORT HIGHLIGHTS
| Aspects | Details |
|---|---|
| Study Period | 2020-2034 |
| Base Year | 2025 |
| Estimated Year | 2026 |
| Forecast Period | 2026-2034 |
| Historical Period | 2020-2025 |
| Growth Rate | CAGR of 6.5% from 2020-2034 |
| Segmentation |
|
Table of Contents
- 1. Introduction
- 1.1. Research Scope
- 1.2. Market Segmentation
- 1.3. Research Objective
- 1.4. Definitions and Assumptions
- 2. Executive Summary
- 2.1. Market Snapshot
- 3. Market Dynamics
- 3.1. Market Drivers
- 3.2. Market Restrains
- 3.3. Market Trends
- 3.4. Market Opportunities
- 4. Market Factor Analysis
- 4.1. Porters Five Forces
- 4.1.1. Bargaining Power of Suppliers
- 4.1.2. Bargaining Power of Buyers
- 4.1.3. Threat of New Entrants
- 4.1.4. Threat of Substitutes
- 4.1.5. Competitive Rivalry
- 4.2. PESTEL analysis
- 4.3. BCG Analysis
- 4.3.1. Stars (High Growth, High Market Share)
- 4.3.2. Cash Cows (Low Growth, High Market Share)
- 4.3.3. Question Mark (High Growth, Low Market Share)
- 4.3.4. Dogs (Low Growth, Low Market Share)
- 4.4. Ansoff Matrix Analysis
- 4.5. Supply Chain Analysis
- 4.6. Regulatory Landscape
- 4.7. Current Market Potential and Opportunity Assessment (TAM–SAM–SOM Framework)
- 4.8. RAX Analyst Note
- 4.1. Porters Five Forces
- 5. Market Analysis, Insights and Forecast 2021-2033
- 5.1. Market Analysis, Insights and Forecast - by Type
- 5.1.1. Fruits
- 5.1.2. Vegetables
- 5.2. Market Analysis, Insights and Forecast - by Product
- 5.2.1. Fresh
- 5.2.2. Fresh-cut
- 5.2.3. Canned
- 5.2.4. Frozen
- 5.2.5. Dried
- 5.3. Market Analysis, Insights and Forecast - by Processing Equipment
- 5.3.1. Pre-processing
- 5.3.2. Washing
- 5.3.3. Filling
- 5.3.4. Seasoning
- 5.3.5. Packaging
- 5.4. Market Analysis, Insights and Forecast - by Region
- 5.4.1. North America
- 5.4.2. Europe
- 5.4.3. Asia Pacific
- 5.4.4. South America
- 5.4.5. Middle East and Africa
- 5.1. Market Analysis, Insights and Forecast - by Type
- 6. Global Fruits & Vegetables Processing Industry Analysis, Insights and Forecast, 2021-2033
- 6.1. Market Analysis, Insights and Forecast - by Type
- 6.1.1. Fruits
- 6.1.2. Vegetables
- 6.2. Market Analysis, Insights and Forecast - by Product
- 6.2.1. Fresh
- 6.2.2. Fresh-cut
- 6.2.3. Canned
- 6.2.4. Frozen
- 6.2.5. Dried
- 6.3. Market Analysis, Insights and Forecast - by Processing Equipment
- 6.3.1. Pre-processing
- 6.3.2. Washing
- 6.3.3. Filling
- 6.3.4. Seasoning
- 6.3.5. Packaging
- 6.1. Market Analysis, Insights and Forecast - by Type
- 7. North America Fruits & Vegetables Processing Industry Analysis, Insights and Forecast, 2020-2032
- 7.1. Market Analysis, Insights and Forecast - by Type
- 7.1.1. Fruits
- 7.1.2. Vegetables
- 7.2. Market Analysis, Insights and Forecast - by Product
- 7.2.1. Fresh
- 7.2.2. Fresh-cut
- 7.2.3. Canned
- 7.2.4. Frozen
- 7.2.5. Dried
- 7.3. Market Analysis, Insights and Forecast - by Processing Equipment
- 7.3.1. Pre-processing
- 7.3.2. Washing
- 7.3.3. Filling
- 7.3.4. Seasoning
- 7.3.5. Packaging
- 7.1. Market Analysis, Insights and Forecast - by Type
- 8. Europe Fruits & Vegetables Processing Industry Analysis, Insights and Forecast, 2020-2032
- 8.1. Market Analysis, Insights and Forecast - by Type
- 8.1.1. Fruits
- 8.1.2. Vegetables
- 8.2. Market Analysis, Insights and Forecast - by Product
- 8.2.1. Fresh
- 8.2.2. Fresh-cut
- 8.2.3. Canned
- 8.2.4. Frozen
- 8.2.5. Dried
- 8.3. Market Analysis, Insights and Forecast - by Processing Equipment
- 8.3.1. Pre-processing
- 8.3.2. Washing
- 8.3.3. Filling
- 8.3.4. Seasoning
- 8.3.5. Packaging
- 8.1. Market Analysis, Insights and Forecast - by Type
- 9. Asia Pacific Fruits & Vegetables Processing Industry Analysis, Insights and Forecast, 2020-2032
- 9.1. Market Analysis, Insights and Forecast - by Type
- 9.1.1. Fruits
- 9.1.2. Vegetables
- 9.2. Market Analysis, Insights and Forecast - by Product
- 9.2.1. Fresh
- 9.2.2. Fresh-cut
- 9.2.3. Canned
- 9.2.4. Frozen
- 9.2.5. Dried
- 9.3. Market Analysis, Insights and Forecast - by Processing Equipment
- 9.3.1. Pre-processing
- 9.3.2. Washing
- 9.3.3. Filling
- 9.3.4. Seasoning
- 9.3.5. Packaging
- 9.1. Market Analysis, Insights and Forecast - by Type
- 10. South America Fruits & Vegetables Processing Industry Analysis, Insights and Forecast, 2020-2032
- 10.1. Market Analysis, Insights and Forecast - by Type
- 10.1.1. Fruits
- 10.1.2. Vegetables
- 10.2. Market Analysis, Insights and Forecast - by Product
- 10.2.1. Fresh
- 10.2.2. Fresh-cut
- 10.2.3. Canned
- 10.2.4. Frozen
- 10.2.5. Dried
- 10.3. Market Analysis, Insights and Forecast - by Processing Equipment
- 10.3.1. Pre-processing
- 10.3.2. Washing
- 10.3.3. Filling
- 10.3.4. Seasoning
- 10.3.5. Packaging
- 10.1. Market Analysis, Insights and Forecast - by Type
- 11. Middle East and Africa Fruits & Vegetables Processing Industry Analysis, Insights and Forecast, 2020-2032
- 11.1. Market Analysis, Insights and Forecast - by Type
- 11.1.1. Fruits
- 11.1.2. Vegetables
- 11.2. Market Analysis, Insights and Forecast - by Product
- 11.2.1. Fresh
- 11.2.2. Fresh-cut
- 11.2.3. Canned
- 11.2.4. Frozen
- 11.2.5. Dried
- 11.3. Market Analysis, Insights and Forecast - by Processing Equipment
- 11.3.1. Pre-processing
- 11.3.2. Washing
- 11.3.3. Filling
- 11.3.4. Seasoning
- 11.3.5. Packaging
- 11.1. Market Analysis, Insights and Forecast - by Type
- 12. Competitive Analysis
- 12.1. Company Profiles
- 12.1.1 B&G Foods
- 12.1.1.1. Company Overview
- 12.1.1.2. Products
- 12.1.1.3. Company Financials
- 12.1.1.4. SWOT Analysis
- 12.1.2 SVZ International
- 12.1.2.1. Company Overview
- 12.1.2.2. Products
- 12.1.2.3. Company Financials
- 12.1.2.4. SWOT Analysis
- 12.1.3 Nestle
- 12.1.3.1. Company Overview
- 12.1.3.2. Products
- 12.1.3.3. Company Financials
- 12.1.3.4. SWOT Analysis
- 12.1.4 Albertsons Companies Inc
- 12.1.4.1. Company Overview
- 12.1.4.2. Products
- 12.1.4.3. Company Financials
- 12.1.4.4. SWOT Analysis
- 12.1.5 Archer Daniels Midland Company
- 12.1.5.1. Company Overview
- 12.1.5.2. Products
- 12.1.5.3. Company Financials
- 12.1.5.4. SWOT Analysis
- 12.1.6 OLAM International*List Not Exhaustive
- 12.1.6.1. Company Overview
- 12.1.6.2. Products
- 12.1.6.3. Company Financials
- 12.1.6.4. SWOT Analysis
- 12.1.7 Conagra Foods
- 12.1.7.1. Company Overview
- 12.1.7.2. Products
- 12.1.7.3. Company Financials
- 12.1.7.4. SWOT Analysis
- 12.1.8 Agrana
- 12.1.8.1. Company Overview
- 12.1.8.2. Products
- 12.1.8.3. Company Financials
- 12.1.8.4. SWOT Analysis
- 12.1.9 Kraft Heinz Company
- 12.1.9.1. Company Overview
- 12.1.9.2. Products
- 12.1.9.3. Company Financials
- 12.1.9.4. SWOT Analysis
- 12.1.1 B&G Foods
- 12.2. Market Entropy
- 12.2.1 Company's Key Areas Served
- 12.2.2 Recent Developments
- 12.3. Company Market Share Analysis 2025
- 12.3.1 Top 5 Companies Market Share Analysis
- 12.3.2 Top 3 Companies Market Share Analysis
- 12.4. List of Potential Customers
- 13. Research Methodology
List of Figures
- Figure 1: Global Fruits & Vegetables Processing Industry Revenue Breakdown (billion, %) by Region 2025 & 2033
- Figure 2: Global Fruits & Vegetables Processing Industry Volume Breakdown (K Units, %) by Region 2025 & 2033
- Figure 3: North America Fruits & Vegetables Processing Industry Revenue (billion), by Type 2025 & 2033
- Figure 4: North America Fruits & Vegetables Processing Industry Volume (K Units), by Type 2025 & 2033
- Figure 5: North America Fruits & Vegetables Processing Industry Revenue Share (%), by Type 2025 & 2033
- Figure 6: North America Fruits & Vegetables Processing Industry Volume Share (%), by Type 2025 & 2033
- Figure 7: North America Fruits & Vegetables Processing Industry Revenue (billion), by Product 2025 & 2033
- Figure 8: North America Fruits & Vegetables Processing Industry Volume (K Units), by Product 2025 & 2033
- Figure 9: North America Fruits & Vegetables Processing Industry Revenue Share (%), by Product 2025 & 2033
- Figure 10: North America Fruits & Vegetables Processing Industry Volume Share (%), by Product 2025 & 2033
- Figure 11: North America Fruits & Vegetables Processing Industry Revenue (billion), by Processing Equipment 2025 & 2033
- Figure 12: North America Fruits & Vegetables Processing Industry Volume (K Units), by Processing Equipment 2025 & 2033
- Figure 13: North America Fruits & Vegetables Processing Industry Revenue Share (%), by Processing Equipment 2025 & 2033
- Figure 14: North America Fruits & Vegetables Processing Industry Volume Share (%), by Processing Equipment 2025 & 2033
- Figure 15: North America Fruits & Vegetables Processing Industry Revenue (billion), by Country 2025 & 2033
- Figure 16: North America Fruits & Vegetables Processing Industry Volume (K Units), by Country 2025 & 2033
- Figure 17: North America Fruits & Vegetables Processing Industry Revenue Share (%), by Country 2025 & 2033
- Figure 18: North America Fruits & Vegetables Processing Industry Volume Share (%), by Country 2025 & 2033
- Figure 19: Europe Fruits & Vegetables Processing Industry Revenue (billion), by Type 2025 & 2033
- Figure 20: Europe Fruits & Vegetables Processing Industry Volume (K Units), by Type 2025 & 2033
- Figure 21: Europe Fruits & Vegetables Processing Industry Revenue Share (%), by Type 2025 & 2033
- Figure 22: Europe Fruits & Vegetables Processing Industry Volume Share (%), by Type 2025 & 2033
- Figure 23: Europe Fruits & Vegetables Processing Industry Revenue (billion), by Product 2025 & 2033
- Figure 24: Europe Fruits & Vegetables Processing Industry Volume (K Units), by Product 2025 & 2033
- Figure 25: Europe Fruits & Vegetables Processing Industry Revenue Share (%), by Product 2025 & 2033
- Figure 26: Europe Fruits & Vegetables Processing Industry Volume Share (%), by Product 2025 & 2033
- Figure 27: Europe Fruits & Vegetables Processing Industry Revenue (billion), by Processing Equipment 2025 & 2033
- Figure 28: Europe Fruits & Vegetables Processing Industry Volume (K Units), by Processing Equipment 2025 & 2033
- Figure 29: Europe Fruits & Vegetables Processing Industry Revenue Share (%), by Processing Equipment 2025 & 2033
- Figure 30: Europe Fruits & Vegetables Processing Industry Volume Share (%), by Processing Equipment 2025 & 2033
- Figure 31: Europe Fruits & Vegetables Processing Industry Revenue (billion), by Country 2025 & 2033
- Figure 32: Europe Fruits & Vegetables Processing Industry Volume (K Units), by Country 2025 & 2033
- Figure 33: Europe Fruits & Vegetables Processing Industry Revenue Share (%), by Country 2025 & 2033
- Figure 34: Europe Fruits & Vegetables Processing Industry Volume Share (%), by Country 2025 & 2033
- Figure 35: Asia Pacific Fruits & Vegetables Processing Industry Revenue (billion), by Type 2025 & 2033
- Figure 36: Asia Pacific Fruits & Vegetables Processing Industry Volume (K Units), by Type 2025 & 2033
- Figure 37: Asia Pacific Fruits & Vegetables Processing Industry Revenue Share (%), by Type 2025 & 2033
- Figure 38: Asia Pacific Fruits & Vegetables Processing Industry Volume Share (%), by Type 2025 & 2033
- Figure 39: Asia Pacific Fruits & Vegetables Processing Industry Revenue (billion), by Product 2025 & 2033
- Figure 40: Asia Pacific Fruits & Vegetables Processing Industry Volume (K Units), by Product 2025 & 2033
- Figure 41: Asia Pacific Fruits & Vegetables Processing Industry Revenue Share (%), by Product 2025 & 2033
- Figure 42: Asia Pacific Fruits & Vegetables Processing Industry Volume Share (%), by Product 2025 & 2033
- Figure 43: Asia Pacific Fruits & Vegetables Processing Industry Revenue (billion), by Processing Equipment 2025 & 2033
- Figure 44: Asia Pacific Fruits & Vegetables Processing Industry Volume (K Units), by Processing Equipment 2025 & 2033
- Figure 45: Asia Pacific Fruits & Vegetables Processing Industry Revenue Share (%), by Processing Equipment 2025 & 2033
- Figure 46: Asia Pacific Fruits & Vegetables Processing Industry Volume Share (%), by Processing Equipment 2025 & 2033
- Figure 47: Asia Pacific Fruits & Vegetables Processing Industry Revenue (billion), by Country 2025 & 2033
- Figure 48: Asia Pacific Fruits & Vegetables Processing Industry Volume (K Units), by Country 2025 & 2033
- Figure 49: Asia Pacific Fruits & Vegetables Processing Industry Revenue Share (%), by Country 2025 & 2033
- Figure 50: Asia Pacific Fruits & Vegetables Processing Industry Volume Share (%), by Country 2025 & 2033
- Figure 51: South America Fruits & Vegetables Processing Industry Revenue (billion), by Type 2025 & 2033
- Figure 52: South America Fruits & Vegetables Processing Industry Volume (K Units), by Type 2025 & 2033
- Figure 53: South America Fruits & Vegetables Processing Industry Revenue Share (%), by Type 2025 & 2033
- Figure 54: South America Fruits & Vegetables Processing Industry Volume Share (%), by Type 2025 & 2033
- Figure 55: South America Fruits & Vegetables Processing Industry Revenue (billion), by Product 2025 & 2033
- Figure 56: South America Fruits & Vegetables Processing Industry Volume (K Units), by Product 2025 & 2033
- Figure 57: South America Fruits & Vegetables Processing Industry Revenue Share (%), by Product 2025 & 2033
- Figure 58: South America Fruits & Vegetables Processing Industry Volume Share (%), by Product 2025 & 2033
- Figure 59: South America Fruits & Vegetables Processing Industry Revenue (billion), by Processing Equipment 2025 & 2033
- Figure 60: South America Fruits & Vegetables Processing Industry Volume (K Units), by Processing Equipment 2025 & 2033
- Figure 61: South America Fruits & Vegetables Processing Industry Revenue Share (%), by Processing Equipment 2025 & 2033
- Figure 62: South America Fruits & Vegetables Processing Industry Volume Share (%), by Processing Equipment 2025 & 2033
- Figure 63: South America Fruits & Vegetables Processing Industry Revenue (billion), by Country 2025 & 2033
- Figure 64: South America Fruits & Vegetables Processing Industry Volume (K Units), by Country 2025 & 2033
- Figure 65: South America Fruits & Vegetables Processing Industry Revenue Share (%), by Country 2025 & 2033
- Figure 66: South America Fruits & Vegetables Processing Industry Volume Share (%), by Country 2025 & 2033
- Figure 67: Middle East and Africa Fruits & Vegetables Processing Industry Revenue (billion), by Type 2025 & 2033
- Figure 68: Middle East and Africa Fruits & Vegetables Processing Industry Volume (K Units), by Type 2025 & 2033
- Figure 69: Middle East and Africa Fruits & Vegetables Processing Industry Revenue Share (%), by Type 2025 & 2033
- Figure 70: Middle East and Africa Fruits & Vegetables Processing Industry Volume Share (%), by Type 2025 & 2033
- Figure 71: Middle East and Africa Fruits & Vegetables Processing Industry Revenue (billion), by Product 2025 & 2033
- Figure 72: Middle East and Africa Fruits & Vegetables Processing Industry Volume (K Units), by Product 2025 & 2033
- Figure 73: Middle East and Africa Fruits & Vegetables Processing Industry Revenue Share (%), by Product 2025 & 2033
- Figure 74: Middle East and Africa Fruits & Vegetables Processing Industry Volume Share (%), by Product 2025 & 2033
- Figure 75: Middle East and Africa Fruits & Vegetables Processing Industry Revenue (billion), by Processing Equipment 2025 & 2033
- Figure 76: Middle East and Africa Fruits & Vegetables Processing Industry Volume (K Units), by Processing Equipment 2025 & 2033
- Figure 77: Middle East and Africa Fruits & Vegetables Processing Industry Revenue Share (%), by Processing Equipment 2025 & 2033
- Figure 78: Middle East and Africa Fruits & Vegetables Processing Industry Volume Share (%), by Processing Equipment 2025 & 2033
- Figure 79: Middle East and Africa Fruits & Vegetables Processing Industry Revenue (billion), by Country 2025 & 2033
- Figure 80: Middle East and Africa Fruits & Vegetables Processing Industry Volume (K Units), by Country 2025 & 2033
- Figure 81: Middle East and Africa Fruits & Vegetables Processing Industry Revenue Share (%), by Country 2025 & 2033
- Figure 82: Middle East and Africa Fruits & Vegetables Processing Industry Volume Share (%), by Country 2025 & 2033
List of Tables
- Table 1: Global Fruits & Vegetables Processing Industry Revenue billion Forecast, by Type 2020 & 2033
- Table 2: Global Fruits & Vegetables Processing Industry Volume K Units Forecast, by Type 2020 & 2033
- Table 3: Global Fruits & Vegetables Processing Industry Revenue billion Forecast, by Product 2020 & 2033
- Table 4: Global Fruits & Vegetables Processing Industry Volume K Units Forecast, by Product 2020 & 2033
- Table 5: Global Fruits & Vegetables Processing Industry Revenue billion Forecast, by Processing Equipment 2020 & 2033
- Table 6: Global Fruits & Vegetables Processing Industry Volume K Units Forecast, by Processing Equipment 2020 & 2033
- Table 7: Global Fruits & Vegetables Processing Industry Revenue billion Forecast, by Region 2020 & 2033
- Table 8: Global Fruits & Vegetables Processing Industry Volume K Units Forecast, by Region 2020 & 2033
- Table 9: Global Fruits & Vegetables Processing Industry Revenue billion Forecast, by Type 2020 & 2033
- Table 10: Global Fruits & Vegetables Processing Industry Volume K Units Forecast, by Type 2020 & 2033
- Table 11: Global Fruits & Vegetables Processing Industry Revenue billion Forecast, by Product 2020 & 2033
- Table 12: Global Fruits & Vegetables Processing Industry Volume K Units Forecast, by Product 2020 & 2033
- Table 13: Global Fruits & Vegetables Processing Industry Revenue billion Forecast, by Processing Equipment 2020 & 2033
- Table 14: Global Fruits & Vegetables Processing Industry Volume K Units Forecast, by Processing Equipment 2020 & 2033
- Table 15: Global Fruits & Vegetables Processing Industry Revenue billion Forecast, by Country 2020 & 2033
- Table 16: Global Fruits & Vegetables Processing Industry Volume K Units Forecast, by Country 2020 & 2033
- Table 17: United States Fruits & Vegetables Processing Industry Revenue (billion) Forecast, by Application 2020 & 2033
- Table 18: United States Fruits & Vegetables Processing Industry Volume (K Units) Forecast, by Application 2020 & 2033
- Table 19: Canada Fruits & Vegetables Processing Industry Revenue (billion) Forecast, by Application 2020 & 2033
- Table 20: Canada Fruits & Vegetables Processing Industry Volume (K Units) Forecast, by Application 2020 & 2033
- Table 21: Mexico Fruits & Vegetables Processing Industry Revenue (billion) Forecast, by Application 2020 & 2033
- Table 22: Mexico Fruits & Vegetables Processing Industry Volume (K Units) Forecast, by Application 2020 & 2033
- Table 23: Rest of North America Fruits & Vegetables Processing Industry Revenue (billion) Forecast, by Application 2020 & 2033
- Table 24: Rest of North America Fruits & Vegetables Processing Industry Volume (K Units) Forecast, by Application 2020 & 2033
- Table 25: Global Fruits & Vegetables Processing Industry Revenue billion Forecast, by Type 2020 & 2033
- Table 26: Global Fruits & Vegetables Processing Industry Volume K Units Forecast, by Type 2020 & 2033
- Table 27: Global Fruits & Vegetables Processing Industry Revenue billion Forecast, by Product 2020 & 2033
- Table 28: Global Fruits & Vegetables Processing Industry Volume K Units Forecast, by Product 2020 & 2033
- Table 29: Global Fruits & Vegetables Processing Industry Revenue billion Forecast, by Processing Equipment 2020 & 2033
- Table 30: Global Fruits & Vegetables Processing Industry Volume K Units Forecast, by Processing Equipment 2020 & 2033
- Table 31: Global Fruits & Vegetables Processing Industry Revenue billion Forecast, by Country 2020 & 2033
- Table 32: Global Fruits & Vegetables Processing Industry Volume K Units Forecast, by Country 2020 & 2033
- Table 33: Spain Fruits & Vegetables Processing Industry Revenue (billion) Forecast, by Application 2020 & 2033
- Table 34: Spain Fruits & Vegetables Processing Industry Volume (K Units) Forecast, by Application 2020 & 2033
- Table 35: United Kingdom Fruits & Vegetables Processing Industry Revenue (billion) Forecast, by Application 2020 & 2033
- Table 36: United Kingdom Fruits & Vegetables Processing Industry Volume (K Units) Forecast, by Application 2020 & 2033
- Table 37: Germany Fruits & Vegetables Processing Industry Revenue (billion) Forecast, by Application 2020 & 2033
- Table 38: Germany Fruits & Vegetables Processing Industry Volume (K Units) Forecast, by Application 2020 & 2033
- Table 39: France Fruits & Vegetables Processing Industry Revenue (billion) Forecast, by Application 2020 & 2033
- Table 40: France Fruits & Vegetables Processing Industry Volume (K Units) Forecast, by Application 2020 & 2033
- Table 41: Italy Fruits & Vegetables Processing Industry Revenue (billion) Forecast, by Application 2020 & 2033
- Table 42: Italy Fruits & Vegetables Processing Industry Volume (K Units) Forecast, by Application 2020 & 2033
- Table 43: Russia Fruits & Vegetables Processing Industry Revenue (billion) Forecast, by Application 2020 & 2033
- Table 44: Russia Fruits & Vegetables Processing Industry Volume (K Units) Forecast, by Application 2020 & 2033
- Table 45: Rest of Europe Fruits & Vegetables Processing Industry Revenue (billion) Forecast, by Application 2020 & 2033
- Table 46: Rest of Europe Fruits & Vegetables Processing Industry Volume (K Units) Forecast, by Application 2020 & 2033
- Table 47: Global Fruits & Vegetables Processing Industry Revenue billion Forecast, by Type 2020 & 2033
- Table 48: Global Fruits & Vegetables Processing Industry Volume K Units Forecast, by Type 2020 & 2033
- Table 49: Global Fruits & Vegetables Processing Industry Revenue billion Forecast, by Product 2020 & 2033
- Table 50: Global Fruits & Vegetables Processing Industry Volume K Units Forecast, by Product 2020 & 2033
- Table 51: Global Fruits & Vegetables Processing Industry Revenue billion Forecast, by Processing Equipment 2020 & 2033
- Table 52: Global Fruits & Vegetables Processing Industry Volume K Units Forecast, by Processing Equipment 2020 & 2033
- Table 53: Global Fruits & Vegetables Processing Industry Revenue billion Forecast, by Country 2020 & 2033
- Table 54: Global Fruits & Vegetables Processing Industry Volume K Units Forecast, by Country 2020 & 2033
- Table 55: China Fruits & Vegetables Processing Industry Revenue (billion) Forecast, by Application 2020 & 2033
- Table 56: China Fruits & Vegetables Processing Industry Volume (K Units) Forecast, by Application 2020 & 2033
- Table 57: Japan Fruits & Vegetables Processing Industry Revenue (billion) Forecast, by Application 2020 & 2033
- Table 58: Japan Fruits & Vegetables Processing Industry Volume (K Units) Forecast, by Application 2020 & 2033
- Table 59: India Fruits & Vegetables Processing Industry Revenue (billion) Forecast, by Application 2020 & 2033
- Table 60: India Fruits & Vegetables Processing Industry Volume (K Units) Forecast, by Application 2020 & 2033
- Table 61: Australia Fruits & Vegetables Processing Industry Revenue (billion) Forecast, by Application 2020 & 2033
- Table 62: Australia Fruits & Vegetables Processing Industry Volume (K Units) Forecast, by Application 2020 & 2033
- Table 63: Rest of Asia Pacific Fruits & Vegetables Processing Industry Revenue (billion) Forecast, by Application 2020 & 2033
- Table 64: Rest of Asia Pacific Fruits & Vegetables Processing Industry Volume (K Units) Forecast, by Application 2020 & 2033
- Table 65: Global Fruits & Vegetables Processing Industry Revenue billion Forecast, by Type 2020 & 2033
- Table 66: Global Fruits & Vegetables Processing Industry Volume K Units Forecast, by Type 2020 & 2033
- Table 67: Global Fruits & Vegetables Processing Industry Revenue billion Forecast, by Product 2020 & 2033
- Table 68: Global Fruits & Vegetables Processing Industry Volume K Units Forecast, by Product 2020 & 2033
- Table 69: Global Fruits & Vegetables Processing Industry Revenue billion Forecast, by Processing Equipment 2020 & 2033
- Table 70: Global Fruits & Vegetables Processing Industry Volume K Units Forecast, by Processing Equipment 2020 & 2033
- Table 71: Global Fruits & Vegetables Processing Industry Revenue billion Forecast, by Country 2020 & 2033
- Table 72: Global Fruits & Vegetables Processing Industry Volume K Units Forecast, by Country 2020 & 2033
- Table 73: Brazil Fruits & Vegetables Processing Industry Revenue (billion) Forecast, by Application 2020 & 2033
- Table 74: Brazil Fruits & Vegetables Processing Industry Volume (K Units) Forecast, by Application 2020 & 2033
- Table 75: Argentina Fruits & Vegetables Processing Industry Revenue (billion) Forecast, by Application 2020 & 2033
- Table 76: Argentina Fruits & Vegetables Processing Industry Volume (K Units) Forecast, by Application 2020 & 2033
- Table 77: Rest of South America Fruits & Vegetables Processing Industry Revenue (billion) Forecast, by Application 2020 & 2033
- Table 78: Rest of South America Fruits & Vegetables Processing Industry Volume (K Units) Forecast, by Application 2020 & 2033
- Table 79: Global Fruits & Vegetables Processing Industry Revenue billion Forecast, by Type 2020 & 2033
- Table 80: Global Fruits & Vegetables Processing Industry Volume K Units Forecast, by Type 2020 & 2033
- Table 81: Global Fruits & Vegetables Processing Industry Revenue billion Forecast, by Product 2020 & 2033
- Table 82: Global Fruits & Vegetables Processing Industry Volume K Units Forecast, by Product 2020 & 2033
- Table 83: Global Fruits & Vegetables Processing Industry Revenue billion Forecast, by Processing Equipment 2020 & 2033
- Table 84: Global Fruits & Vegetables Processing Industry Volume K Units Forecast, by Processing Equipment 2020 & 2033
- Table 85: Global Fruits & Vegetables Processing Industry Revenue billion Forecast, by Country 2020 & 2033
- Table 86: Global Fruits & Vegetables Processing Industry Volume K Units Forecast, by Country 2020 & 2033
- Table 87: South Africa Fruits & Vegetables Processing Industry Revenue (billion) Forecast, by Application 2020 & 2033
- Table 88: South Africa Fruits & Vegetables Processing Industry Volume (K Units) Forecast, by Application 2020 & 2033
- Table 89: United Arab Emirates Fruits & Vegetables Processing Industry Revenue (billion) Forecast, by Application 2020 & 2033
- Table 90: United Arab Emirates Fruits & Vegetables Processing Industry Volume (K Units) Forecast, by Application 2020 & 2033
- Table 91: Rest of Middle East and Africa Fruits & Vegetables Processing Industry Revenue (billion) Forecast, by Application 2020 & 2033
- Table 92: Rest of Middle East and Africa Fruits & Vegetables Processing Industry Volume (K Units) Forecast, by Application 2020 & 2033
Frequently Asked Questions
1. What is the projected Compound Annual Growth Rate (CAGR) of the Fruits & Vegetables Processing Industry?
The projected CAGR is approximately 6.5%.
2. Which companies are prominent players in the Fruits & Vegetables Processing Industry?
Key companies in the market include B&G Foods, SVZ International, Nestle, Albertsons Companies Inc, Archer Daniels Midland Company, OLAM International*List Not Exhaustive, Conagra Foods, Agrana, Kraft Heinz Company.
3. What are the main segments of the Fruits & Vegetables Processing Industry?
The market segments include Type, Product, Processing Equipment.
4. Can you provide details about the market size?
The market size is estimated to be USD 10.06 billion as of 2022.
5. What are some drivers contributing to market growth?
Increasing Focus on Maintaining Health and Well-Being; Launching Supplements For Specific Purposes and Targeted Population.
6. What are the notable trends driving market growth?
Adoption of Energy-efficient Food Processing Equipment.
7. Are there any restraints impacting market growth?
Supplement Consumption and Their Side-effects; Inclination Towards Substitute Products.
8. Can you provide examples of recent developments in the market?
In September 2021, The Kraft Heinz Company entered an agreement to acquire 'Hemmer,' a Brazilian company focused on condiments and sauces. The acquisition is designed to expand consumers' taste options in Brazil while supporting Kraft Heinz's strategy of growing its International Taste Elevation product platform and its presence in emerging markets.
9. What pricing options are available for accessing the report?
Pricing options include single-user, multi-user, and enterprise licenses priced at USD 4750, USD 5250, and USD 8750 respectively.
10. Is the market size provided in terms of value or volume?
The market size is provided in terms of value, measured in billion and volume, measured in K Units.
11. Are there any specific market keywords associated with the report?
Yes, the market keyword associated with the report is "Fruits & Vegetables Processing Industry," which aids in identifying and referencing the specific market segment covered.
12. How do I determine which pricing option suits my needs best?
The pricing options vary based on user requirements and access needs. Individual users may opt for single-user licenses, while businesses requiring broader access may choose multi-user or enterprise licenses for cost-effective access to the report.
13. Are there any additional resources or data provided in the Fruits & Vegetables Processing Industry report?
While the report offers comprehensive insights, it's advisable to review the specific contents or supplementary materials provided to ascertain if additional resources or data are available.
14. How can I stay updated on further developments or reports in the Fruits & Vegetables Processing Industry?
To stay informed about further developments, trends, and reports in the Fruits & Vegetables Processing Industry, consider subscribing to industry newsletters, following relevant companies and organizations, or regularly checking reputable industry news sources and publications.
Methodology
Step 1 - Identification of Relevant Samples Size from Population Database


Step 2 - Approaches for Defining Global Market Size (Value, Volume* & Price*)

Note*: In applicable scenarios
Step 3 - Data Sources
Primary Research
- Web Analytics
- Survey Reports
- Research Institute
- Latest Research Reports
- Opinion Leaders
Secondary Research
- Annual Reports
- White Paper
- Latest Press Release
- Industry Association
- Paid Database
- Investor Presentations

Step 4 - Data Triangulation
Involves using different sources of information in order to increase the validity of a study
These sources are likely to be stakeholders in a program - participants, other researchers, program staff, other community members, and so on.
Then we put all data in single framework & apply various statistical tools to find out the dynamic on the market.
During the analysis stage, feedback from the stakeholder groups would be compared to determine areas of agreement as well as areas of divergence