

Key Insights
The full-cover bra market, while seemingly a mature segment, exhibits robust growth potential driven by several key factors. The increasing demand for comfort and support, particularly among older demographics and those with larger busts, fuels market expansion. Furthermore, the rising awareness of health benefits associated with proper bra fitting and support contributes to sustained consumer interest. The market is witnessing a shift towards innovative materials and designs that prioritize breathability, moisture-wicking properties, and seamless construction, catering to the evolving preferences of modern consumers. Premiumization is also a significant trend, with consumers increasingly willing to invest in higher-quality, longer-lasting bras that offer superior comfort and support. While economic downturns might temporarily restrain spending on non-essential items like bras, the overall market is resilient due to the essential nature of the product. Competition is fierce, with established players like Wacoal, Triumph, and Victoria's Secret vying for market share alongside emerging brands offering niche styles and direct-to-consumer models. Growth is expected across various regions, with developing economies showing significant potential as disposable incomes rise and awareness of western fashion trends increases.
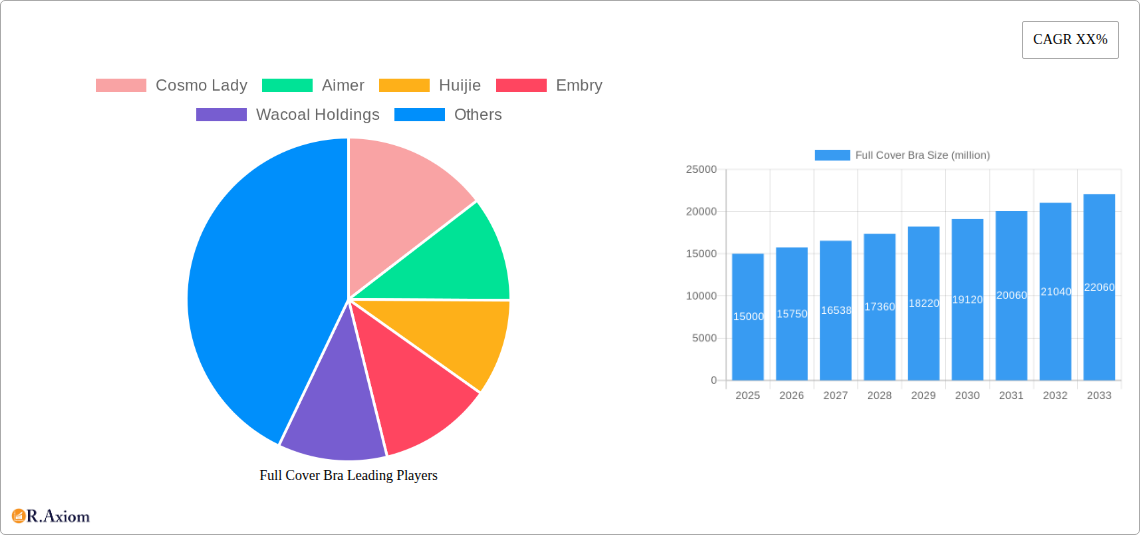
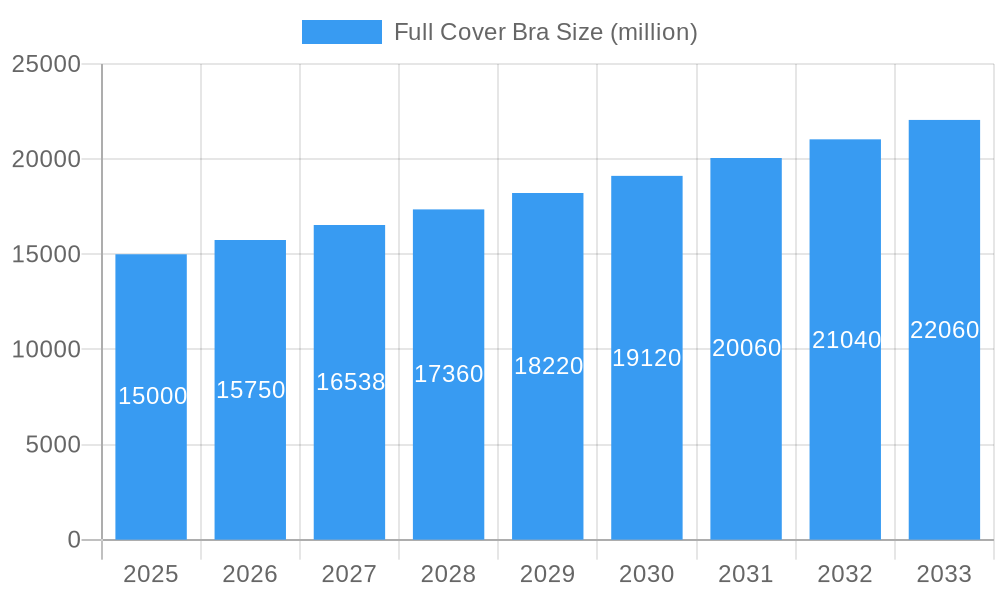
Full Cover Bra Market Size (In Billion)
The competitive landscape is marked by a mix of international giants and regional players. Established brands leverage their strong brand recognition and extensive distribution networks, while newer entrants focus on building brand loyalty through digital marketing and innovative product offerings. Successful players are adopting omnichannel strategies, integrating online and offline sales channels to reach a wider customer base. Sustainable and ethically sourced materials are also gaining traction, reflecting the growing consumer demand for environmentally and socially responsible products. Future market growth will depend on successful adaptation to changing consumer preferences, leveraging technological advancements in materials and design, and effectively managing supply chain complexities. The market is poised for continued expansion, driven by a combination of evolving consumer needs, technological innovation, and the strategic actions of market participants. We project a conservative but steady CAGR of 5% over the next decade.
Full Cover Bra Company Market Share
Full Cover Bra Market Report: 2019-2033 – A Comprehensive Analysis
This comprehensive report provides an in-depth analysis of the global full cover bra market, offering invaluable insights for industry stakeholders, investors, and market entrants. The study period covers 2019-2033, with a base year of 2025 and a forecast period of 2025-2033. The report leverages extensive primary and secondary research to deliver accurate market sizing, segmentation, and growth projections, exceeding $XX million in the estimated year 2025 and projected to reach over $XX million by 2033.
Full Cover Bra Market Concentration & Innovation
The global full cover bra market exhibits a moderately concentrated landscape, with a few major players holding significant market share. Cosmo Lady, Wacoal Holdings, and Triumph International collectively account for approximately XX% of the market in 2025. However, a multitude of smaller regional and niche players also contribute significantly to the overall market volume. Innovation is driven by consumer demand for comfort, functionality, and aesthetic appeal. Technological advancements in fabric technology, design, and manufacturing processes are continuously shaping the market. Regulatory frameworks concerning product safety and labeling vary across regions but generally promote fair competition and consumer protection. Product substitutes such as bralettes and sports bras pose a competitive challenge, particularly amongst younger demographics. The market witnesses consistent M&A activity, with deal values exceeding $XX million annually over the historical period (2019-2024).
- Market Share (2025): Cosmo Lady (XX%), Wacoal Holdings (XX%), Triumph (XX%), Others (XX%).
- M&A Deal Value (2019-2024): >$XX million annually.
- Key Innovation Drivers: Sustainable materials, advanced comfort technologies, personalized fitting solutions.
Full Cover Bra Industry Trends & Insights
The full cover bra market is experiencing steady growth, driven primarily by rising disposable incomes, changing fashion trends, and increased awareness of the importance of proper breast support. The CAGR for the forecast period (2025-2033) is projected to be XX%, indicating robust market expansion. Market penetration is highest in developed economies, where consumer awareness and purchasing power are high. However, emerging markets are showing significant growth potential due to rising female participation in the workforce and changing lifestyle patterns. Technological disruptions, such as the use of smart fabrics and personalized fitting technologies, are shaping future market dynamics. Competitive dynamics are marked by fierce competition among established brands and the emergence of new players offering innovative products and sustainable practices. Consumer preferences shift toward more comfortable, eco-friendly, and inclusive designs.
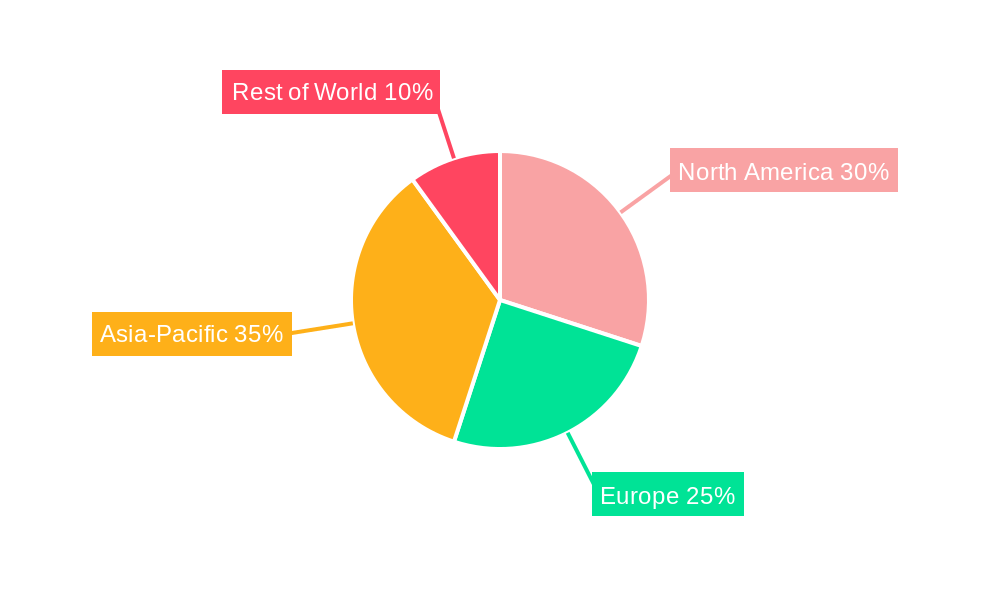
Dominant Markets & Segments in Full Cover Bra
The North American market currently dominates the global full cover bra market, followed by Europe and Asia-Pacific. The dominance of North America is attributed to high consumer spending, established retail infrastructure, and the presence of major international brands.
- Key Drivers of North American Dominance: Strong consumer demand for quality and comfort, established retail networks, high per capita income.
- Key Drivers of European Market Growth: Growing adoption of sustainable practices by consumers and brands, a developed retail ecosystem, high per capita spending.
- Key Drivers of Asia-Pacific Market Growth: Rising disposable incomes in emerging economies, changing lifestyles, and increasing female participation in the workforce.
Full Cover Bra Product Developments
Recent innovations in full cover bra design include the incorporation of advanced materials like seamless fabrics, breathable mesh panels, and moisture-wicking technologies. These advancements enhance comfort, support, and hygiene. Furthermore, the market is seeing an increase in personalized fitting solutions through online tools and data-driven designs. These product developments address evolving consumer preferences for more customized and functional lingerie.
Report Scope & Segmentation Analysis
This report segments the full cover bra market by product type (e.g., underwire, wireless, padded, non-padded), material (e.g., cotton, microfiber, lace), price range (e.g., budget, mid-range, premium), and distribution channel (e.g., online, retail stores). Each segment offers unique growth opportunities and competitive dynamics. For example, the wireless full cover bra segment is witnessing rapid growth due to increased demand for comfortable and natural-feeling lingerie. Similarly, the online distribution channel is gaining popularity due to increasing e-commerce adoption. Market size and growth projections are provided for each segment.
Key Drivers of Full Cover Bra Growth
Several factors contribute to the growth of the full cover bra market. These include rising disposable incomes globally leading to increased spending on apparel and lingerie, the growing preference for comfortable and functional underwear, and the increasing awareness about breast health and support. Moreover, technological advancements in materials and manufacturing processes have resulted in improved comfort, fit, and durability of full cover bras, driving increased demand.
Challenges in the Full Cover Bra Sector
The full cover bra sector faces several challenges, including fluctuating raw material prices impacting production costs, intense competition from both established and emerging players, and evolving consumer preferences towards newer styles and designs. Furthermore, shifting fashion trends and the increasing popularity of alternative options such as bralettes impact demand for traditional full cover bras, requiring manufacturers to adapt their product strategies.
Emerging Opportunities in Full Cover Bra
Emerging opportunities include the expansion into new markets (e.g., Africa, Latin America), the development of sustainable and eco-friendly products using recycled and organic materials, and the customization of products based on individual body types. Leveraging the use of technology to improve fitting solutions and the seamless integration of e-commerce channels are also key opportunities to tap into growing consumer preferences.
Leading Players in the Full Cover Bra Market
- Cosmo Lady
- Aimer
- Huijie
- Embry
- Wacoal Holdings
- Triumph
- Vivien
- Fast Retailing
- Tutuanna
- PVH
- Gunze
- Miiow
- BYC
- MAS Holdings
- Hop Lun
- P.H. Garment
- Good People
- GUJIN
- Victoria’s Secret
- SBW
- Sunflora
- Gokaldas Images
- Lovable
- Gracewell
- Oleno Group
Key Developments in Full Cover Bra Industry
- 2022 Q3: Wacoal Holdings launched a new line of sustainable full cover bras using recycled materials.
- 2023 Q1: Triumph International acquired a smaller lingerie company, expanding its market share.
- 2024 Q2: Cosmo Lady introduced a personalized fitting app to enhance customer experience.
- (Further details to be added based on actual data)
Strategic Outlook for Full Cover Bra Market
The full cover bra market is poised for continued growth driven by innovative product development, expanding distribution channels, and evolving consumer preferences. Focusing on sustainability, technological advancements in comfort and fit, and personalized consumer experiences will be crucial for players to gain and maintain a competitive advantage in the market. The market presents significant opportunities for brands that can effectively cater to the diverse needs and preferences of a growing global consumer base.
Full Cover Bra Segmentation
-
1. Application
- 1.1. Specialty Stores
- 1.2. Supermarket
- 1.3. E-commerce
-
2. Types
- 2.1. Steel Ring
- 2.2. Without Steel Ring
Full Cover Bra Segmentation By Geography
-
1. North America
- 1.1. United States
- 1.2. Canada
- 1.3. Mexico
-
2. South America
- 2.1. Brazil
- 2.2. Argentina
- 2.3. Rest of South America
-
3. Europe
- 3.1. United Kingdom
- 3.2. Germany
- 3.3. France
- 3.4. Italy
- 3.5. Spain
- 3.6. Russia
- 3.7. Benelux
- 3.8. Nordics
- 3.9. Rest of Europe
-
4. Middle East & Africa
- 4.1. Turkey
- 4.2. Israel
- 4.3. GCC
- 4.4. North Africa
- 4.5. South Africa
- 4.6. Rest of Middle East & Africa
-
5. Asia Pacific
- 5.1. China
- 5.2. India
- 5.3. Japan
- 5.4. South Korea
- 5.5. ASEAN
- 5.6. Oceania
- 5.7. Rest of Asia Pacific
Full Cover Bra Regional Market Share
Geographic Coverage of Full Cover Bra
Full Cover Bra REPORT HIGHLIGHTS
| Aspects | Details |
|---|---|
| Study Period | 2020-2034 |
| Base Year | 2025 |
| Estimated Year | 2026 |
| Forecast Period | 2026-2034 |
| Historical Period | 2020-2025 |
| Growth Rate | CAGR of XX% from 2020-2034 |
| Segmentation |
|
Table of Contents
- 1. Introduction
- 1.1. Research Scope
- 1.2. Market Segmentation
- 1.3. Research Objective
- 1.4. Definitions and Assumptions
- 2. Executive Summary
- 2.1. Market Snapshot
- 3. Market Dynamics
- 3.1. Market Drivers
- 3.2. Market Restrains
- 3.3. Market Trends
- 3.4. Market Opportunities
- 4. Market Factor Analysis
- 4.1. Porters Five Forces
- 4.1.1. Bargaining Power of Suppliers
- 4.1.2. Bargaining Power of Buyers
- 4.1.3. Threat of New Entrants
- 4.1.4. Threat of Substitutes
- 4.1.5. Competitive Rivalry
- 4.2. PESTEL analysis
- 4.3. BCG Analysis
- 4.3.1. Stars (High Growth, High Market Share)
- 4.3.2. Cash Cows (Low Growth, High Market Share)
- 4.3.3. Question Mark (High Growth, Low Market Share)
- 4.3.4. Dogs (Low Growth, Low Market Share)
- 4.4. Ansoff Matrix Analysis
- 4.5. Supply Chain Analysis
- 4.6. Regulatory Landscape
- 4.7. Current Market Potential and Opportunity Assessment (TAM–SAM–SOM Framework)
- 4.8. RAX Analyst Note
- 4.1. Porters Five Forces
- 5. Market Analysis, Insights and Forecast 2021-2033
- 5.1. Market Analysis, Insights and Forecast - by Application
- 5.1.1. Specialty Stores
- 5.1.2. Supermarket
- 5.1.3. E-commerce
- 5.2. Market Analysis, Insights and Forecast - by Types
- 5.2.1. Steel Ring
- 5.2.2. Without Steel Ring
- 5.3. Market Analysis, Insights and Forecast - by Region
- 5.3.1. North America
- 5.3.2. South America
- 5.3.3. Europe
- 5.3.4. Middle East & Africa
- 5.3.5. Asia Pacific
- 5.1. Market Analysis, Insights and Forecast - by Application
- 6. Global Full Cover Bra Analysis, Insights and Forecast, 2021-2033
- 6.1. Market Analysis, Insights and Forecast - by Application
- 6.1.1. Specialty Stores
- 6.1.2. Supermarket
- 6.1.3. E-commerce
- 6.2. Market Analysis, Insights and Forecast - by Types
- 6.2.1. Steel Ring
- 6.2.2. Without Steel Ring
- 6.1. Market Analysis, Insights and Forecast - by Application
- 7. North America Full Cover Bra Analysis, Insights and Forecast, 2020-2032
- 7.1. Market Analysis, Insights and Forecast - by Application
- 7.1.1. Specialty Stores
- 7.1.2. Supermarket
- 7.1.3. E-commerce
- 7.2. Market Analysis, Insights and Forecast - by Types
- 7.2.1. Steel Ring
- 7.2.2. Without Steel Ring
- 7.1. Market Analysis, Insights and Forecast - by Application
- 8. South America Full Cover Bra Analysis, Insights and Forecast, 2020-2032
- 8.1. Market Analysis, Insights and Forecast - by Application
- 8.1.1. Specialty Stores
- 8.1.2. Supermarket
- 8.1.3. E-commerce
- 8.2. Market Analysis, Insights and Forecast - by Types
- 8.2.1. Steel Ring
- 8.2.2. Without Steel Ring
- 8.1. Market Analysis, Insights and Forecast - by Application
- 9. Europe Full Cover Bra Analysis, Insights and Forecast, 2020-2032
- 9.1. Market Analysis, Insights and Forecast - by Application
- 9.1.1. Specialty Stores
- 9.1.2. Supermarket
- 9.1.3. E-commerce
- 9.2. Market Analysis, Insights and Forecast - by Types
- 9.2.1. Steel Ring
- 9.2.2. Without Steel Ring
- 9.1. Market Analysis, Insights and Forecast - by Application
- 10. Middle East & Africa Full Cover Bra Analysis, Insights and Forecast, 2020-2032
- 10.1. Market Analysis, Insights and Forecast - by Application
- 10.1.1. Specialty Stores
- 10.1.2. Supermarket
- 10.1.3. E-commerce
- 10.2. Market Analysis, Insights and Forecast - by Types
- 10.2.1. Steel Ring
- 10.2.2. Without Steel Ring
- 10.1. Market Analysis, Insights and Forecast - by Application
- 11. Asia Pacific Full Cover Bra Analysis, Insights and Forecast, 2020-2032
- 11.1. Market Analysis, Insights and Forecast - by Application
- 11.1.1. Specialty Stores
- 11.1.2. Supermarket
- 11.1.3. E-commerce
- 11.2. Market Analysis, Insights and Forecast - by Types
- 11.2.1. Steel Ring
- 11.2.2. Without Steel Ring
- 11.1. Market Analysis, Insights and Forecast - by Application
- 12. Competitive Analysis
- 12.1. Company Profiles
- 12.1.1 Cosmo Lady
- 12.1.1.1. Company Overview
- 12.1.1.2. Products
- 12.1.1.3. Company Financials
- 12.1.1.4. SWOT Analysis
- 12.1.2 Aimer
- 12.1.2.1. Company Overview
- 12.1.2.2. Products
- 12.1.2.3. Company Financials
- 12.1.2.4. SWOT Analysis
- 12.1.3 Huijie
- 12.1.3.1. Company Overview
- 12.1.3.2. Products
- 12.1.3.3. Company Financials
- 12.1.3.4. SWOT Analysis
- 12.1.4 Embry
- 12.1.4.1. Company Overview
- 12.1.4.2. Products
- 12.1.4.3. Company Financials
- 12.1.4.4. SWOT Analysis
- 12.1.5 Wacoal Holdings
- 12.1.5.1. Company Overview
- 12.1.5.2. Products
- 12.1.5.3. Company Financials
- 12.1.5.4. SWOT Analysis
- 12.1.6 Triumph
- 12.1.6.1. Company Overview
- 12.1.6.2. Products
- 12.1.6.3. Company Financials
- 12.1.6.4. SWOT Analysis
- 12.1.7 Vivien
- 12.1.7.1. Company Overview
- 12.1.7.2. Products
- 12.1.7.3. Company Financials
- 12.1.7.4. SWOT Analysis
- 12.1.8 Fast Retailing
- 12.1.8.1. Company Overview
- 12.1.8.2. Products
- 12.1.8.3. Company Financials
- 12.1.8.4. SWOT Analysis
- 12.1.9 Tutuanna
- 12.1.9.1. Company Overview
- 12.1.9.2. Products
- 12.1.9.3. Company Financials
- 12.1.9.4. SWOT Analysis
- 12.1.10 PVH
- 12.1.10.1. Company Overview
- 12.1.10.2. Products
- 12.1.10.3. Company Financials
- 12.1.10.4. SWOT Analysis
- 12.1.11 Gunze
- 12.1.11.1. Company Overview
- 12.1.11.2. Products
- 12.1.11.3. Company Financials
- 12.1.11.4. SWOT Analysis
- 12.1.12 Miiow
- 12.1.12.1. Company Overview
- 12.1.12.2. Products
- 12.1.12.3. Company Financials
- 12.1.12.4. SWOT Analysis
- 12.1.13 BYC
- 12.1.13.1. Company Overview
- 12.1.13.2. Products
- 12.1.13.3. Company Financials
- 12.1.13.4. SWOT Analysis
- 12.1.14 MAS Holdings
- 12.1.14.1. Company Overview
- 12.1.14.2. Products
- 12.1.14.3. Company Financials
- 12.1.14.4. SWOT Analysis
- 12.1.15 Hop Lun
- 12.1.15.1. Company Overview
- 12.1.15.2. Products
- 12.1.15.3. Company Financials
- 12.1.15.4. SWOT Analysis
- 12.1.16 P.H. Garment
- 12.1.16.1. Company Overview
- 12.1.16.2. Products
- 12.1.16.3. Company Financials
- 12.1.16.4. SWOT Analysis
- 12.1.17 Good People
- 12.1.17.1. Company Overview
- 12.1.17.2. Products
- 12.1.17.3. Company Financials
- 12.1.17.4. SWOT Analysis
- 12.1.18 GUJIN
- 12.1.18.1. Company Overview
- 12.1.18.2. Products
- 12.1.18.3. Company Financials
- 12.1.18.4. SWOT Analysis
- 12.1.19 Victoria’s Secret
- 12.1.19.1. Company Overview
- 12.1.19.2. Products
- 12.1.19.3. Company Financials
- 12.1.19.4. SWOT Analysis
- 12.1.20 SBW
- 12.1.20.1. Company Overview
- 12.1.20.2. Products
- 12.1.20.3. Company Financials
- 12.1.20.4. SWOT Analysis
- 12.1.21 Sunflora
- 12.1.21.1. Company Overview
- 12.1.21.2. Products
- 12.1.21.3. Company Financials
- 12.1.21.4. SWOT Analysis
- 12.1.22 Gokaldas Images
- 12.1.22.1. Company Overview
- 12.1.22.2. Products
- 12.1.22.3. Company Financials
- 12.1.22.4. SWOT Analysis
- 12.1.23 Lovable
- 12.1.23.1. Company Overview
- 12.1.23.2. Products
- 12.1.23.3. Company Financials
- 12.1.23.4. SWOT Analysis
- 12.1.24 Gracewell
- 12.1.24.1. Company Overview
- 12.1.24.2. Products
- 12.1.24.3. Company Financials
- 12.1.24.4. SWOT Analysis
- 12.1.25 Oleno Group
- 12.1.25.1. Company Overview
- 12.1.25.2. Products
- 12.1.25.3. Company Financials
- 12.1.25.4. SWOT Analysis
- 12.1.1 Cosmo Lady
- 12.2. Market Entropy
- 12.2.1 Company's Key Areas Served
- 12.2.2 Recent Developments
- 12.3. Company Market Share Analysis 2025
- 12.3.1 Top 5 Companies Market Share Analysis
- 12.3.2 Top 3 Companies Market Share Analysis
- 12.4. List of Potential Customers
- 13. Research Methodology
List of Figures
- Figure 1: Global Full Cover Bra Revenue Breakdown (million, %) by Region 2025 & 2033
- Figure 2: Global Full Cover Bra Volume Breakdown (K, %) by Region 2025 & 2033
- Figure 3: North America Full Cover Bra Revenue (million), by Application 2025 & 2033
- Figure 4: North America Full Cover Bra Volume (K), by Application 2025 & 2033
- Figure 5: North America Full Cover Bra Revenue Share (%), by Application 2025 & 2033
- Figure 6: North America Full Cover Bra Volume Share (%), by Application 2025 & 2033
- Figure 7: North America Full Cover Bra Revenue (million), by Types 2025 & 2033
- Figure 8: North America Full Cover Bra Volume (K), by Types 2025 & 2033
- Figure 9: North America Full Cover Bra Revenue Share (%), by Types 2025 & 2033
- Figure 10: North America Full Cover Bra Volume Share (%), by Types 2025 & 2033
- Figure 11: North America Full Cover Bra Revenue (million), by Country 2025 & 2033
- Figure 12: North America Full Cover Bra Volume (K), by Country 2025 & 2033
- Figure 13: North America Full Cover Bra Revenue Share (%), by Country 2025 & 2033
- Figure 14: North America Full Cover Bra Volume Share (%), by Country 2025 & 2033
- Figure 15: South America Full Cover Bra Revenue (million), by Application 2025 & 2033
- Figure 16: South America Full Cover Bra Volume (K), by Application 2025 & 2033
- Figure 17: South America Full Cover Bra Revenue Share (%), by Application 2025 & 2033
- Figure 18: South America Full Cover Bra Volume Share (%), by Application 2025 & 2033
- Figure 19: South America Full Cover Bra Revenue (million), by Types 2025 & 2033
- Figure 20: South America Full Cover Bra Volume (K), by Types 2025 & 2033
- Figure 21: South America Full Cover Bra Revenue Share (%), by Types 2025 & 2033
- Figure 22: South America Full Cover Bra Volume Share (%), by Types 2025 & 2033
- Figure 23: South America Full Cover Bra Revenue (million), by Country 2025 & 2033
- Figure 24: South America Full Cover Bra Volume (K), by Country 2025 & 2033
- Figure 25: South America Full Cover Bra Revenue Share (%), by Country 2025 & 2033
- Figure 26: South America Full Cover Bra Volume Share (%), by Country 2025 & 2033
- Figure 27: Europe Full Cover Bra Revenue (million), by Application 2025 & 2033
- Figure 28: Europe Full Cover Bra Volume (K), by Application 2025 & 2033
- Figure 29: Europe Full Cover Bra Revenue Share (%), by Application 2025 & 2033
- Figure 30: Europe Full Cover Bra Volume Share (%), by Application 2025 & 2033
- Figure 31: Europe Full Cover Bra Revenue (million), by Types 2025 & 2033
- Figure 32: Europe Full Cover Bra Volume (K), by Types 2025 & 2033
- Figure 33: Europe Full Cover Bra Revenue Share (%), by Types 2025 & 2033
- Figure 34: Europe Full Cover Bra Volume Share (%), by Types 2025 & 2033
- Figure 35: Europe Full Cover Bra Revenue (million), by Country 2025 & 2033
- Figure 36: Europe Full Cover Bra Volume (K), by Country 2025 & 2033
- Figure 37: Europe Full Cover Bra Revenue Share (%), by Country 2025 & 2033
- Figure 38: Europe Full Cover Bra Volume Share (%), by Country 2025 & 2033
- Figure 39: Middle East & Africa Full Cover Bra Revenue (million), by Application 2025 & 2033
- Figure 40: Middle East & Africa Full Cover Bra Volume (K), by Application 2025 & 2033
- Figure 41: Middle East & Africa Full Cover Bra Revenue Share (%), by Application 2025 & 2033
- Figure 42: Middle East & Africa Full Cover Bra Volume Share (%), by Application 2025 & 2033
- Figure 43: Middle East & Africa Full Cover Bra Revenue (million), by Types 2025 & 2033
- Figure 44: Middle East & Africa Full Cover Bra Volume (K), by Types 2025 & 2033
- Figure 45: Middle East & Africa Full Cover Bra Revenue Share (%), by Types 2025 & 2033
- Figure 46: Middle East & Africa Full Cover Bra Volume Share (%), by Types 2025 & 2033
- Figure 47: Middle East & Africa Full Cover Bra Revenue (million), by Country 2025 & 2033
- Figure 48: Middle East & Africa Full Cover Bra Volume (K), by Country 2025 & 2033
- Figure 49: Middle East & Africa Full Cover Bra Revenue Share (%), by Country 2025 & 2033
- Figure 50: Middle East & Africa Full Cover Bra Volume Share (%), by Country 2025 & 2033
- Figure 51: Asia Pacific Full Cover Bra Revenue (million), by Application 2025 & 2033
- Figure 52: Asia Pacific Full Cover Bra Volume (K), by Application 2025 & 2033
- Figure 53: Asia Pacific Full Cover Bra Revenue Share (%), by Application 2025 & 2033
- Figure 54: Asia Pacific Full Cover Bra Volume Share (%), by Application 2025 & 2033
- Figure 55: Asia Pacific Full Cover Bra Revenue (million), by Types 2025 & 2033
- Figure 56: Asia Pacific Full Cover Bra Volume (K), by Types 2025 & 2033
- Figure 57: Asia Pacific Full Cover Bra Revenue Share (%), by Types 2025 & 2033
- Figure 58: Asia Pacific Full Cover Bra Volume Share (%), by Types 2025 & 2033
- Figure 59: Asia Pacific Full Cover Bra Revenue (million), by Country 2025 & 2033
- Figure 60: Asia Pacific Full Cover Bra Volume (K), by Country 2025 & 2033
- Figure 61: Asia Pacific Full Cover Bra Revenue Share (%), by Country 2025 & 2033
- Figure 62: Asia Pacific Full Cover Bra Volume Share (%), by Country 2025 & 2033
List of Tables
- Table 1: Global Full Cover Bra Revenue million Forecast, by Application 2020 & 2033
- Table 2: Global Full Cover Bra Volume K Forecast, by Application 2020 & 2033
- Table 3: Global Full Cover Bra Revenue million Forecast, by Types 2020 & 2033
- Table 4: Global Full Cover Bra Volume K Forecast, by Types 2020 & 2033
- Table 5: Global Full Cover Bra Revenue million Forecast, by Region 2020 & 2033
- Table 6: Global Full Cover Bra Volume K Forecast, by Region 2020 & 2033
- Table 7: Global Full Cover Bra Revenue million Forecast, by Application 2020 & 2033
- Table 8: Global Full Cover Bra Volume K Forecast, by Application 2020 & 2033
- Table 9: Global Full Cover Bra Revenue million Forecast, by Types 2020 & 2033
- Table 10: Global Full Cover Bra Volume K Forecast, by Types 2020 & 2033
- Table 11: Global Full Cover Bra Revenue million Forecast, by Country 2020 & 2033
- Table 12: Global Full Cover Bra Volume K Forecast, by Country 2020 & 2033
- Table 13: United States Full Cover Bra Revenue (million) Forecast, by Application 2020 & 2033
- Table 14: United States Full Cover Bra Volume (K) Forecast, by Application 2020 & 2033
- Table 15: Canada Full Cover Bra Revenue (million) Forecast, by Application 2020 & 2033
- Table 16: Canada Full Cover Bra Volume (K) Forecast, by Application 2020 & 2033
- Table 17: Mexico Full Cover Bra Revenue (million) Forecast, by Application 2020 & 2033
- Table 18: Mexico Full Cover Bra Volume (K) Forecast, by Application 2020 & 2033
- Table 19: Global Full Cover Bra Revenue million Forecast, by Application 2020 & 2033
- Table 20: Global Full Cover Bra Volume K Forecast, by Application 2020 & 2033
- Table 21: Global Full Cover Bra Revenue million Forecast, by Types 2020 & 2033
- Table 22: Global Full Cover Bra Volume K Forecast, by Types 2020 & 2033
- Table 23: Global Full Cover Bra Revenue million Forecast, by Country 2020 & 2033
- Table 24: Global Full Cover Bra Volume K Forecast, by Country 2020 & 2033
- Table 25: Brazil Full Cover Bra Revenue (million) Forecast, by Application 2020 & 2033
- Table 26: Brazil Full Cover Bra Volume (K) Forecast, by Application 2020 & 2033
- Table 27: Argentina Full Cover Bra Revenue (million) Forecast, by Application 2020 & 2033
- Table 28: Argentina Full Cover Bra Volume (K) Forecast, by Application 2020 & 2033
- Table 29: Rest of South America Full Cover Bra Revenue (million) Forecast, by Application 2020 & 2033
- Table 30: Rest of South America Full Cover Bra Volume (K) Forecast, by Application 2020 & 2033
- Table 31: Global Full Cover Bra Revenue million Forecast, by Application 2020 & 2033
- Table 32: Global Full Cover Bra Volume K Forecast, by Application 2020 & 2033
- Table 33: Global Full Cover Bra Revenue million Forecast, by Types 2020 & 2033
- Table 34: Global Full Cover Bra Volume K Forecast, by Types 2020 & 2033
- Table 35: Global Full Cover Bra Revenue million Forecast, by Country 2020 & 2033
- Table 36: Global Full Cover Bra Volume K Forecast, by Country 2020 & 2033
- Table 37: United Kingdom Full Cover Bra Revenue (million) Forecast, by Application 2020 & 2033
- Table 38: United Kingdom Full Cover Bra Volume (K) Forecast, by Application 2020 & 2033
- Table 39: Germany Full Cover Bra Revenue (million) Forecast, by Application 2020 & 2033
- Table 40: Germany Full Cover Bra Volume (K) Forecast, by Application 2020 & 2033
- Table 41: France Full Cover Bra Revenue (million) Forecast, by Application 2020 & 2033
- Table 42: France Full Cover Bra Volume (K) Forecast, by Application 2020 & 2033
- Table 43: Italy Full Cover Bra Revenue (million) Forecast, by Application 2020 & 2033
- Table 44: Italy Full Cover Bra Volume (K) Forecast, by Application 2020 & 2033
- Table 45: Spain Full Cover Bra Revenue (million) Forecast, by Application 2020 & 2033
- Table 46: Spain Full Cover Bra Volume (K) Forecast, by Application 2020 & 2033
- Table 47: Russia Full Cover Bra Revenue (million) Forecast, by Application 2020 & 2033
- Table 48: Russia Full Cover Bra Volume (K) Forecast, by Application 2020 & 2033
- Table 49: Benelux Full Cover Bra Revenue (million) Forecast, by Application 2020 & 2033
- Table 50: Benelux Full Cover Bra Volume (K) Forecast, by Application 2020 & 2033
- Table 51: Nordics Full Cover Bra Revenue (million) Forecast, by Application 2020 & 2033
- Table 52: Nordics Full Cover Bra Volume (K) Forecast, by Application 2020 & 2033
- Table 53: Rest of Europe Full Cover Bra Revenue (million) Forecast, by Application 2020 & 2033
- Table 54: Rest of Europe Full Cover Bra Volume (K) Forecast, by Application 2020 & 2033
- Table 55: Global Full Cover Bra Revenue million Forecast, by Application 2020 & 2033
- Table 56: Global Full Cover Bra Volume K Forecast, by Application 2020 & 2033
- Table 57: Global Full Cover Bra Revenue million Forecast, by Types 2020 & 2033
- Table 58: Global Full Cover Bra Volume K Forecast, by Types 2020 & 2033
- Table 59: Global Full Cover Bra Revenue million Forecast, by Country 2020 & 2033
- Table 60: Global Full Cover Bra Volume K Forecast, by Country 2020 & 2033
- Table 61: Turkey Full Cover Bra Revenue (million) Forecast, by Application 2020 & 2033
- Table 62: Turkey Full Cover Bra Volume (K) Forecast, by Application 2020 & 2033
- Table 63: Israel Full Cover Bra Revenue (million) Forecast, by Application 2020 & 2033
- Table 64: Israel Full Cover Bra Volume (K) Forecast, by Application 2020 & 2033
- Table 65: GCC Full Cover Bra Revenue (million) Forecast, by Application 2020 & 2033
- Table 66: GCC Full Cover Bra Volume (K) Forecast, by Application 2020 & 2033
- Table 67: North Africa Full Cover Bra Revenue (million) Forecast, by Application 2020 & 2033
- Table 68: North Africa Full Cover Bra Volume (K) Forecast, by Application 2020 & 2033
- Table 69: South Africa Full Cover Bra Revenue (million) Forecast, by Application 2020 & 2033
- Table 70: South Africa Full Cover Bra Volume (K) Forecast, by Application 2020 & 2033
- Table 71: Rest of Middle East & Africa Full Cover Bra Revenue (million) Forecast, by Application 2020 & 2033
- Table 72: Rest of Middle East & Africa Full Cover Bra Volume (K) Forecast, by Application 2020 & 2033
- Table 73: Global Full Cover Bra Revenue million Forecast, by Application 2020 & 2033
- Table 74: Global Full Cover Bra Volume K Forecast, by Application 2020 & 2033
- Table 75: Global Full Cover Bra Revenue million Forecast, by Types 2020 & 2033
- Table 76: Global Full Cover Bra Volume K Forecast, by Types 2020 & 2033
- Table 77: Global Full Cover Bra Revenue million Forecast, by Country 2020 & 2033
- Table 78: Global Full Cover Bra Volume K Forecast, by Country 2020 & 2033
- Table 79: China Full Cover Bra Revenue (million) Forecast, by Application 2020 & 2033
- Table 80: China Full Cover Bra Volume (K) Forecast, by Application 2020 & 2033
- Table 81: India Full Cover Bra Revenue (million) Forecast, by Application 2020 & 2033
- Table 82: India Full Cover Bra Volume (K) Forecast, by Application 2020 & 2033
- Table 83: Japan Full Cover Bra Revenue (million) Forecast, by Application 2020 & 2033
- Table 84: Japan Full Cover Bra Volume (K) Forecast, by Application 2020 & 2033
- Table 85: South Korea Full Cover Bra Revenue (million) Forecast, by Application 2020 & 2033
- Table 86: South Korea Full Cover Bra Volume (K) Forecast, by Application 2020 & 2033
- Table 87: ASEAN Full Cover Bra Revenue (million) Forecast, by Application 2020 & 2033
- Table 88: ASEAN Full Cover Bra Volume (K) Forecast, by Application 2020 & 2033
- Table 89: Oceania Full Cover Bra Revenue (million) Forecast, by Application 2020 & 2033
- Table 90: Oceania Full Cover Bra Volume (K) Forecast, by Application 2020 & 2033
- Table 91: Rest of Asia Pacific Full Cover Bra Revenue (million) Forecast, by Application 2020 & 2033
- Table 92: Rest of Asia Pacific Full Cover Bra Volume (K) Forecast, by Application 2020 & 2033
Frequently Asked Questions
1. What is the projected Compound Annual Growth Rate (CAGR) of the Full Cover Bra?
The projected CAGR is approximately XX%.
2. Which companies are prominent players in the Full Cover Bra?
Key companies in the market include Cosmo Lady, Aimer, Huijie, Embry, Wacoal Holdings, Triumph, Vivien, Fast Retailing, Tutuanna, PVH, Gunze, Miiow, BYC, MAS Holdings, Hop Lun, P.H. Garment, Good People, GUJIN, Victoria’s Secret, SBW, Sunflora, Gokaldas Images, Lovable, Gracewell, Oleno Group.
3. What are the main segments of the Full Cover Bra?
The market segments include Application, Types.
4. Can you provide details about the market size?
The market size is estimated to be USD XXX million as of 2022.
5. What are some drivers contributing to market growth?
N/A
6. What are the notable trends driving market growth?
N/A
7. Are there any restraints impacting market growth?
N/A
8. Can you provide examples of recent developments in the market?
N/A
9. What pricing options are available for accessing the report?
Pricing options include single-user, multi-user, and enterprise licenses priced at USD 3350.00, USD 5025.00, and USD 6700.00 respectively.
10. Is the market size provided in terms of value or volume?
The market size is provided in terms of value, measured in million and volume, measured in K.
11. Are there any specific market keywords associated with the report?
Yes, the market keyword associated with the report is "Full Cover Bra," which aids in identifying and referencing the specific market segment covered.
12. How do I determine which pricing option suits my needs best?
The pricing options vary based on user requirements and access needs. Individual users may opt for single-user licenses, while businesses requiring broader access may choose multi-user or enterprise licenses for cost-effective access to the report.
13. Are there any additional resources or data provided in the Full Cover Bra report?
While the report offers comprehensive insights, it's advisable to review the specific contents or supplementary materials provided to ascertain if additional resources or data are available.
14. How can I stay updated on further developments or reports in the Full Cover Bra?
To stay informed about further developments, trends, and reports in the Full Cover Bra, consider subscribing to industry newsletters, following relevant companies and organizations, or regularly checking reputable industry news sources and publications.
Methodology
Step 1 - Identification of Relevant Samples Size from Population Database


Step 2 - Approaches for Defining Global Market Size (Value, Volume* & Price*)

Note*: In applicable scenarios
Step 3 - Data Sources
Primary Research
- Web Analytics
- Survey Reports
- Research Institute
- Latest Research Reports
- Opinion Leaders
Secondary Research
- Annual Reports
- White Paper
- Latest Press Release
- Industry Association
- Paid Database
- Investor Presentations

Step 4 - Data Triangulation
Involves using different sources of information in order to increase the validity of a study
These sources are likely to be stakeholders in a program - participants, other researchers, program staff, other community members, and so on.
Then we put all data in single framework & apply various statistical tools to find out the dynamic on the market.
During the analysis stage, feedback from the stakeholder groups would be compared to determine areas of agreement as well as areas of divergence