

Key Insights
The global gambling games equipment market is projected for significant expansion, driven by the increasing legalization and regulation of both online and land-based gambling operations, alongside technological innovations that elevate player engagement. This growth is further stimulated by the surging popularity of online casinos, mobile gaming, and novel game formats designed to meet evolving player demands. The market is expected to grow from a size of $7.48 billion in the base year 2025, with a Compound Annual Growth Rate (CAGR) of 9.36%. Strategic collaborations and industry acquisitions are key enablers of product diversification and enhanced market penetration. Dominant segments, including slot machines, table games, and electronic gaming machines, are pivotal to the market's overall valuation. A dynamic competitive arena, featuring both established industry leaders and innovative new entrants, fosters continuous technological advancement and market share competition.
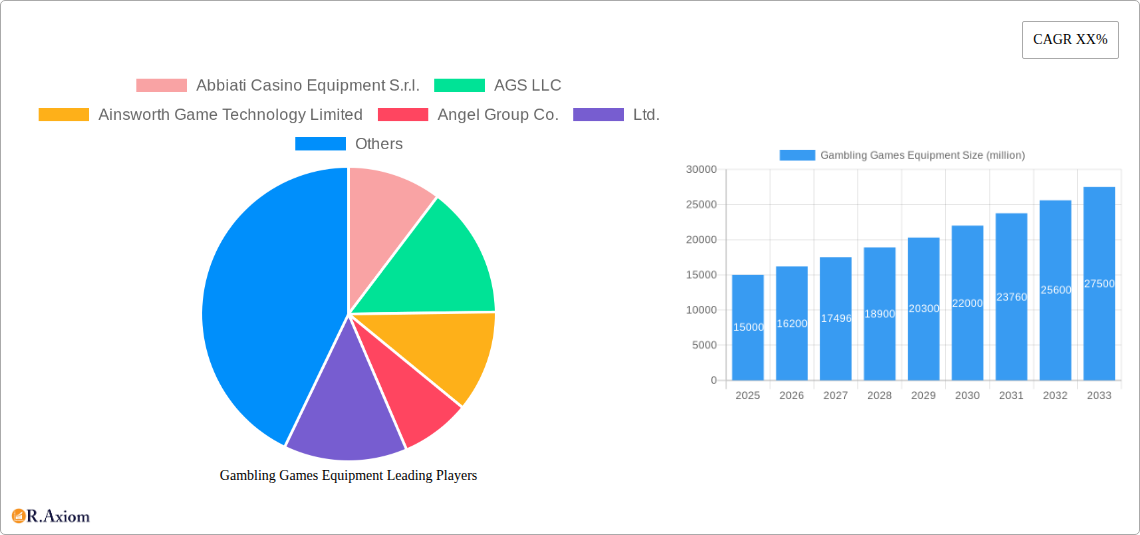
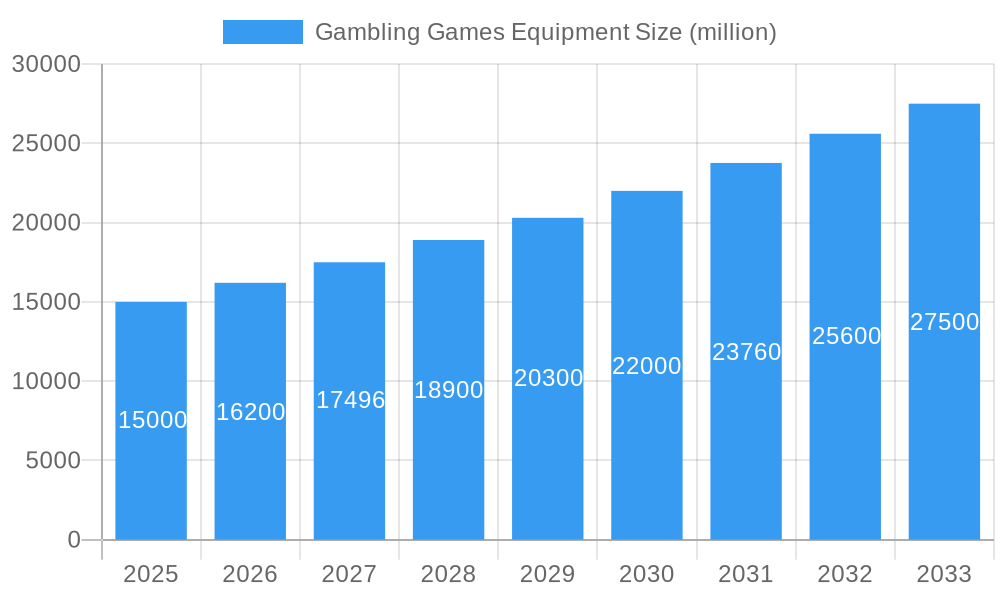
Gambling Games Equipment Market Size (In Billion)
While the market exhibits a positive growth trend, certain challenges exist. Variable regulatory landscapes across diverse geographies can impede market expansion, and the growing emphasis on responsible gambling initiatives may moderate growth rates. Nevertheless, the integration of advanced technologies such as virtual reality (VR) and augmented reality (AR), coupled with the burgeoning esports betting sector, presents substantial opportunities for future growth. The market's trajectory will likely be characterized by an increased reliance on data analytics for personalized gaming experiences and improved player retention, reinforcing a favorable outlook for sustained industry expansion. Strategic entry into emerging markets with developing gambling sectors will also be a significant contributor to revenue growth.
Gambling Games Equipment Company Market Share
Gambling Games Equipment Market: A Comprehensive Report (2019-2033)
This comprehensive report provides an in-depth analysis of the global gambling games equipment market, offering invaluable insights for industry stakeholders, investors, and businesses seeking to navigate this dynamic sector. The report covers the period from 2019 to 2033, with a focus on the forecast period of 2025-2033, using 2025 as the base year and estimated year. The market size is projected to reach several million USD by 2033. This report is crucial for understanding market trends, competitive landscapes, and emerging opportunities within the gambling games equipment industry.
Gambling Games Equipment Market Concentration & Innovation
The global gambling games equipment market exhibits a moderately concentrated structure, with a few major players commanding significant market share. While precise market share figures for each company require detailed proprietary data analysis, we estimate that the top 5 players collectively hold approximately xx% of the market in 2025. Innovation is a key driver, fueled by technological advancements in gaming software, hardware, and user interface design. Regulatory frameworks vary significantly across jurisdictions, influencing product development and market entry strategies. The industry also witnesses consistent M&A activity, with deal values in the hundreds of millions of USD annually, indicating consolidation and expansion efforts by leading players. Product substitutes, such as online gambling platforms, pose a challenge, prompting manufacturers to continuously innovate and enhance their offerings. End-user trends lean toward immersive experiences and interactive gameplay, demanding ongoing adaptation from equipment providers.
- Market Concentration: Moderately concentrated, with top 5 players holding approximately xx% market share in 2025.
- Innovation Drivers: Technological advancements in software, hardware, and user interface.
- Regulatory Frameworks: Vary significantly across jurisdictions, impacting product development and market access.
- M&A Activity: Significant, with annual deal values in the hundreds of millions of USD.
- Product Substitutes: Online gambling platforms present a competitive challenge.
- End-User Trends: Demand for immersive and interactive gaming experiences.
Gambling Games Equipment Industry Trends & Insights
The gambling games equipment market is experiencing robust growth, driven by several key factors. The increasing popularity of land-based casinos and gaming centers, coupled with rising disposable incomes in several regions, fuels demand for sophisticated and engaging gaming equipment. Technological advancements, such as the integration of augmented reality (AR) and virtual reality (VR) technologies, are transforming the gaming experience, creating new opportunities for innovation and market expansion. The market exhibits a projected Compound Annual Growth Rate (CAGR) of xx% during the forecast period (2025-2033). Market penetration continues to rise, particularly in emerging markets with growing tourism and leisure sectors. Competitive dynamics are intense, with companies vying for market share through product differentiation, technological innovation, and strategic partnerships. Consumer preferences are shifting towards personalized and interactive gaming experiences, leading manufacturers to focus on customized solutions and user-friendly interfaces.
Dominant Markets & Segments in Gambling Games Equipment
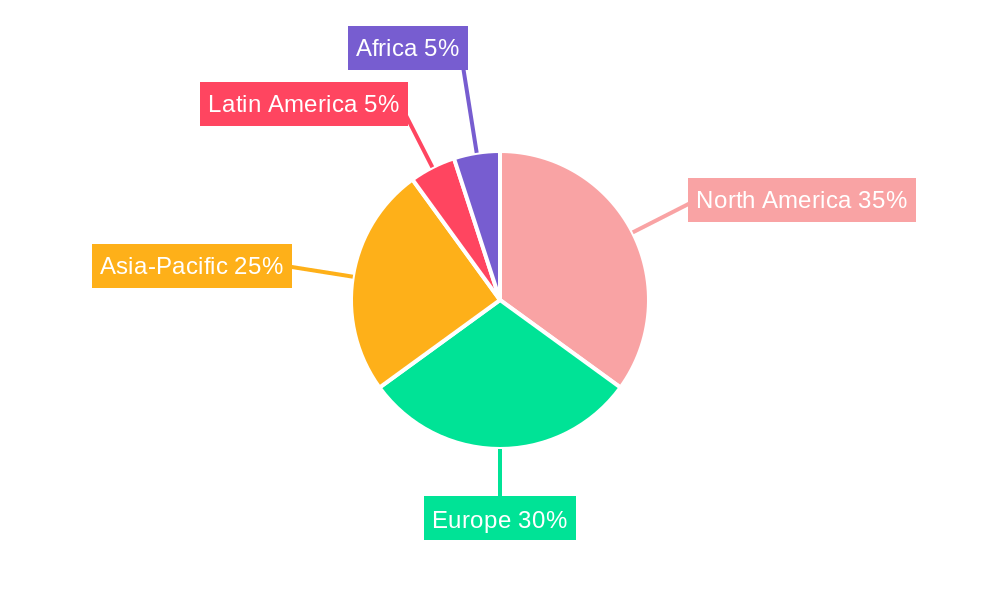
The North American region holds a dominant position in the gambling games equipment market. The mature gambling industry, high per capita spending on entertainment, and robust technological infrastructure contribute significantly to this dominance. Specific countries like the USA and Canada are key drivers within this region.
- Key Drivers in North America:
- Mature gambling industry: Long history of established casinos and gaming establishments.
- High per capita spending on entertainment: Significant disposable income allocated to leisure activities.
- Robust technological infrastructure: Supports advanced gaming technologies and seamless integration.
- Favorable regulatory environment (in certain regions): Permits development and operation of gambling facilities.
Within the segments, slot machines continue to hold the largest market share, followed by table games equipment (roulette wheels, poker tables etc.) and other gaming machines. The dominance of slot machines is attributed to their popularity and widespread adoption across various gambling establishments.
Gambling Games Equipment Product Developments
Recent product innovations focus on enhanced player interaction, improved graphics and sound quality, and integration of mobile and online functionalities. This includes advancements in game mechanics, user interfaces, and the use of cutting-edge technologies such as AR/VR to enhance player immersion. These developments cater to evolving consumer preferences for personalized and entertaining gaming experiences, providing competitive advantages for manufacturers offering such innovations. The market continuously embraces new technological trends such as AI and machine learning to enhance game design, personalize gaming experiences, and improve operational efficiency.
Report Scope & Segmentation Analysis
This report segments the gambling games equipment market based on product type (slot machines, table games equipment, other gaming machines), technology (mechanical, electronic), end-user (casinos, gaming centers, other), and geography (North America, Europe, Asia Pacific, etc.). Each segment's growth projections, market size, and competitive landscape are analyzed individually, providing a granular understanding of market dynamics within each sector. The report also delves into specific regional variations and their impact on the overall market. For instance, the Asia-Pacific region is projected to witness significant growth driven by rapid urbanization and increased disposable incomes.
Key Drivers of Gambling Games Equipment Growth
Several factors propel the growth of the gambling games equipment market. Technological advancements, leading to more immersive and engaging gaming experiences, play a critical role. Economic growth in several regions increases disposable incomes, leading to higher spending on entertainment and gambling. Favorable regulatory environments in various jurisdictions facilitate the expansion of the gambling industry, driving demand for modern equipment. The increasing popularity of online-offline integrated gaming solutions further boosts the market.
Challenges in the Gambling Games Equipment Sector
The gambling games equipment sector faces several challenges. Stringent regulatory frameworks and licensing requirements in several regions create hurdles for market entry and expansion. Supply chain disruptions and component shortages can impact production and delivery timelines, affecting overall market growth. Intense competition amongst established players and emerging companies necessitates continuous innovation and cost optimization. The rise of online gambling platforms poses a considerable threat to the traditional land-based gaming sector.
Emerging Opportunities in Gambling Games Equipment
The integration of advanced technologies such as AI, VR/AR, and blockchain offers significant growth opportunities. Expansion into emerging markets with rising disposable incomes and favorable regulatory environments provides substantial market potential. Developing innovative gaming experiences that cater to diverse player preferences presents a crucial avenue for manufacturers to gain a competitive edge. The development of customized gaming solutions for specific demographics or casino types also represents a substantial opportunity for growth.
Leading Players in the Gambling Games Equipment Market
- Abbiati Casino Equipment S.r.l.
- AGS LLC
- Ainsworth Game Technology Limited
- Angel Group Co.,Ltd.
- Aristocrat Leisure Limited
- Aruze Gaming Technologies Co.,Ltd.
- CTC Holdings
- Euro Games Technology Ltd.
- Everi Holdings Inc.
- GameBridge Casino Equipment
- Gaming Technologies
- Incredible Technologies, Inc.
- Inspired Entertainment, Inc.
- International Game Technology PLC
- Jackpot Digital,Inc.
- Konami Gaming Inc.
- Matsui Gaming Machine CO.,LTD.
- New Vision Gaming
- NOVOMATIC AG
- R. Franco technologies, S.L.U.
- TCS John Huxley Europe Ltd.
Key Developments in Gambling Games Equipment Industry
- 2023: International Game Technology PLC launched a new line of slot machines with enhanced interactive features.
- 2022: AGS LLC acquired a smaller competitor, expanding its market share. (Acquisition value: xx million USD)
- 2021: Several companies introduced new cabinet designs to improve player experience.
- 2020: The COVID-19 pandemic temporarily disrupted the supply chain, impacting production.
- 2019: Increased focus on cashless payment systems integration into gaming equipment.
Strategic Outlook for Gambling Games Equipment Market
The gambling games equipment market is poised for continued growth, driven by technological advancements, evolving consumer preferences, and expansion into new markets. The integration of cutting-edge technologies like AI and VR/AR will further enhance the gaming experience and drive market expansion. Companies focused on innovation, diversification, and strategic partnerships will be best positioned for success in this competitive landscape. The continued adaptation to changing regulatory environments and the careful navigation of supply chain challenges will be crucial determinants of long-term success.
Gambling Games Equipment Segmentation
-
1. Application
- 1.1. Casino
- 1.2. Arcade Room
- 1.3. Others
-
2. Types
- 2.1. Slot Machines
- 2.2. Casino Tables
- 2.3. Video Poker Machines
- 2.4. Others
Gambling Games Equipment Segmentation By Geography
-
1. North America
- 1.1. United States
- 1.2. Canada
- 1.3. Mexico
-
2. South America
- 2.1. Brazil
- 2.2. Argentina
- 2.3. Rest of South America
-
3. Europe
- 3.1. United Kingdom
- 3.2. Germany
- 3.3. France
- 3.4. Italy
- 3.5. Spain
- 3.6. Russia
- 3.7. Benelux
- 3.8. Nordics
- 3.9. Rest of Europe
-
4. Middle East & Africa
- 4.1. Turkey
- 4.2. Israel
- 4.3. GCC
- 4.4. North Africa
- 4.5. South Africa
- 4.6. Rest of Middle East & Africa
-
5. Asia Pacific
- 5.1. China
- 5.2. India
- 5.3. Japan
- 5.4. South Korea
- 5.5. ASEAN
- 5.6. Oceania
- 5.7. Rest of Asia Pacific
Gambling Games Equipment Regional Market Share
Geographic Coverage of Gambling Games Equipment
Gambling Games Equipment REPORT HIGHLIGHTS
| Aspects | Details |
|---|---|
| Study Period | 2020-2034 |
| Base Year | 2025 |
| Estimated Year | 2026 |
| Forecast Period | 2026-2034 |
| Historical Period | 2020-2025 |
| Growth Rate | CAGR of 9.36% from 2020-2034 |
| Segmentation |
|
Table of Contents
- 1. Introduction
- 1.1. Research Scope
- 1.2. Market Segmentation
- 1.3. Research Objective
- 1.4. Definitions and Assumptions
- 2. Executive Summary
- 2.1. Market Snapshot
- 3. Market Dynamics
- 3.1. Market Drivers
- 3.2. Market Restrains
- 3.3. Market Trends
- 3.4. Market Opportunities
- 4. Market Factor Analysis
- 4.1. Porters Five Forces
- 4.1.1. Bargaining Power of Suppliers
- 4.1.2. Bargaining Power of Buyers
- 4.1.3. Threat of New Entrants
- 4.1.4. Threat of Substitutes
- 4.1.5. Competitive Rivalry
- 4.2. PESTEL analysis
- 4.3. BCG Analysis
- 4.3.1. Stars (High Growth, High Market Share)
- 4.3.2. Cash Cows (Low Growth, High Market Share)
- 4.3.3. Question Mark (High Growth, Low Market Share)
- 4.3.4. Dogs (Low Growth, Low Market Share)
- 4.4. Ansoff Matrix Analysis
- 4.5. Supply Chain Analysis
- 4.6. Regulatory Landscape
- 4.7. Current Market Potential and Opportunity Assessment (TAM–SAM–SOM Framework)
- 4.8. RAX Analyst Note
- 4.1. Porters Five Forces
- 5. Market Analysis, Insights and Forecast 2021-2033
- 5.1. Market Analysis, Insights and Forecast - by Application
- 5.1.1. Casino
- 5.1.2. Arcade Room
- 5.1.3. Others
- 5.2. Market Analysis, Insights and Forecast - by Types
- 5.2.1. Slot Machines
- 5.2.2. Casino Tables
- 5.2.3. Video Poker Machines
- 5.2.4. Others
- 5.3. Market Analysis, Insights and Forecast - by Region
- 5.3.1. North America
- 5.3.2. South America
- 5.3.3. Europe
- 5.3.4. Middle East & Africa
- 5.3.5. Asia Pacific
- 5.1. Market Analysis, Insights and Forecast - by Application
- 6. Global Gambling Games Equipment Analysis, Insights and Forecast, 2021-2033
- 6.1. Market Analysis, Insights and Forecast - by Application
- 6.1.1. Casino
- 6.1.2. Arcade Room
- 6.1.3. Others
- 6.2. Market Analysis, Insights and Forecast - by Types
- 6.2.1. Slot Machines
- 6.2.2. Casino Tables
- 6.2.3. Video Poker Machines
- 6.2.4. Others
- 6.1. Market Analysis, Insights and Forecast - by Application
- 7. North America Gambling Games Equipment Analysis, Insights and Forecast, 2020-2032
- 7.1. Market Analysis, Insights and Forecast - by Application
- 7.1.1. Casino
- 7.1.2. Arcade Room
- 7.1.3. Others
- 7.2. Market Analysis, Insights and Forecast - by Types
- 7.2.1. Slot Machines
- 7.2.2. Casino Tables
- 7.2.3. Video Poker Machines
- 7.2.4. Others
- 7.1. Market Analysis, Insights and Forecast - by Application
- 8. South America Gambling Games Equipment Analysis, Insights and Forecast, 2020-2032
- 8.1. Market Analysis, Insights and Forecast - by Application
- 8.1.1. Casino
- 8.1.2. Arcade Room
- 8.1.3. Others
- 8.2. Market Analysis, Insights and Forecast - by Types
- 8.2.1. Slot Machines
- 8.2.2. Casino Tables
- 8.2.3. Video Poker Machines
- 8.2.4. Others
- 8.1. Market Analysis, Insights and Forecast - by Application
- 9. Europe Gambling Games Equipment Analysis, Insights and Forecast, 2020-2032
- 9.1. Market Analysis, Insights and Forecast - by Application
- 9.1.1. Casino
- 9.1.2. Arcade Room
- 9.1.3. Others
- 9.2. Market Analysis, Insights and Forecast - by Types
- 9.2.1. Slot Machines
- 9.2.2. Casino Tables
- 9.2.3. Video Poker Machines
- 9.2.4. Others
- 9.1. Market Analysis, Insights and Forecast - by Application
- 10. Middle East & Africa Gambling Games Equipment Analysis, Insights and Forecast, 2020-2032
- 10.1. Market Analysis, Insights and Forecast - by Application
- 10.1.1. Casino
- 10.1.2. Arcade Room
- 10.1.3. Others
- 10.2. Market Analysis, Insights and Forecast - by Types
- 10.2.1. Slot Machines
- 10.2.2. Casino Tables
- 10.2.3. Video Poker Machines
- 10.2.4. Others
- 10.1. Market Analysis, Insights and Forecast - by Application
- 11. Asia Pacific Gambling Games Equipment Analysis, Insights and Forecast, 2020-2032
- 11.1. Market Analysis, Insights and Forecast - by Application
- 11.1.1. Casino
- 11.1.2. Arcade Room
- 11.1.3. Others
- 11.2. Market Analysis, Insights and Forecast - by Types
- 11.2.1. Slot Machines
- 11.2.2. Casino Tables
- 11.2.3. Video Poker Machines
- 11.2.4. Others
- 11.1. Market Analysis, Insights and Forecast - by Application
- 12. Competitive Analysis
- 12.1. Company Profiles
- 12.1.1 Abbiati Casino Equipment S.r.l.
- 12.1.1.1. Company Overview
- 12.1.1.2. Products
- 12.1.1.3. Company Financials
- 12.1.1.4. SWOT Analysis
- 12.1.2 AGS LLC
- 12.1.2.1. Company Overview
- 12.1.2.2. Products
- 12.1.2.3. Company Financials
- 12.1.2.4. SWOT Analysis
- 12.1.3 Ainsworth Game Technology Limited
- 12.1.3.1. Company Overview
- 12.1.3.2. Products
- 12.1.3.3. Company Financials
- 12.1.3.4. SWOT Analysis
- 12.1.4 Angel Group Co.
- 12.1.4.1. Company Overview
- 12.1.4.2. Products
- 12.1.4.3. Company Financials
- 12.1.4.4. SWOT Analysis
- 12.1.5 Ltd.
- 12.1.5.1. Company Overview
- 12.1.5.2. Products
- 12.1.5.3. Company Financials
- 12.1.5.4. SWOT Analysis
- 12.1.6 Aristocrat Leisure Limited
- 12.1.6.1. Company Overview
- 12.1.6.2. Products
- 12.1.6.3. Company Financials
- 12.1.6.4. SWOT Analysis
- 12.1.7 Aruze Gaming Technologies Co.
- 12.1.7.1. Company Overview
- 12.1.7.2. Products
- 12.1.7.3. Company Financials
- 12.1.7.4. SWOT Analysis
- 12.1.8 Ltd.
- 12.1.8.1. Company Overview
- 12.1.8.2. Products
- 12.1.8.3. Company Financials
- 12.1.8.4. SWOT Analysis
- 12.1.9 CTC Holdings
- 12.1.9.1. Company Overview
- 12.1.9.2. Products
- 12.1.9.3. Company Financials
- 12.1.9.4. SWOT Analysis
- 12.1.10 Euro Games Technology Ltd.
- 12.1.10.1. Company Overview
- 12.1.10.2. Products
- 12.1.10.3. Company Financials
- 12.1.10.4. SWOT Analysis
- 12.1.11 Everi Holdings Inc.
- 12.1.11.1. Company Overview
- 12.1.11.2. Products
- 12.1.11.3. Company Financials
- 12.1.11.4. SWOT Analysis
- 12.1.12 GameBridge Casino Equipment
- 12.1.12.1. Company Overview
- 12.1.12.2. Products
- 12.1.12.3. Company Financials
- 12.1.12.4. SWOT Analysis
- 12.1.13 Gaming Technologies
- 12.1.13.1. Company Overview
- 12.1.13.2. Products
- 12.1.13.3. Company Financials
- 12.1.13.4. SWOT Analysis
- 12.1.14 Incredible Technologies
- 12.1.14.1. Company Overview
- 12.1.14.2. Products
- 12.1.14.3. Company Financials
- 12.1.14.4. SWOT Analysis
- 12.1.15 Inc.
- 12.1.15.1. Company Overview
- 12.1.15.2. Products
- 12.1.15.3. Company Financials
- 12.1.15.4. SWOT Analysis
- 12.1.16 Inspired Entertainment
- 12.1.16.1. Company Overview
- 12.1.16.2. Products
- 12.1.16.3. Company Financials
- 12.1.16.4. SWOT Analysis
- 12.1.17 Inc.
- 12.1.17.1. Company Overview
- 12.1.17.2. Products
- 12.1.17.3. Company Financials
- 12.1.17.4. SWOT Analysis
- 12.1.18 International Game Technology PLC
- 12.1.18.1. Company Overview
- 12.1.18.2. Products
- 12.1.18.3. Company Financials
- 12.1.18.4. SWOT Analysis
- 12.1.19 Jackpot Digital
- 12.1.19.1. Company Overview
- 12.1.19.2. Products
- 12.1.19.3. Company Financials
- 12.1.19.4. SWOT Analysis
- 12.1.20 Inc.
- 12.1.20.1. Company Overview
- 12.1.20.2. Products
- 12.1.20.3. Company Financials
- 12.1.20.4. SWOT Analysis
- 12.1.21 Konami Gaming Inc.
- 12.1.21.1. Company Overview
- 12.1.21.2. Products
- 12.1.21.3. Company Financials
- 12.1.21.4. SWOT Analysis
- 12.1.22 Matsui Gaming Machine CO.
- 12.1.22.1. Company Overview
- 12.1.22.2. Products
- 12.1.22.3. Company Financials
- 12.1.22.4. SWOT Analysis
- 12.1.23 LTD.
- 12.1.23.1. Company Overview
- 12.1.23.2. Products
- 12.1.23.3. Company Financials
- 12.1.23.4. SWOT Analysis
- 12.1.24 New Vision Gaming
- 12.1.24.1. Company Overview
- 12.1.24.2. Products
- 12.1.24.3. Company Financials
- 12.1.24.4. SWOT Analysis
- 12.1.25 NOVOMATIC AG
- 12.1.25.1. Company Overview
- 12.1.25.2. Products
- 12.1.25.3. Company Financials
- 12.1.25.4. SWOT Analysis
- 12.1.26 R. Franco technologies
- 12.1.26.1. Company Overview
- 12.1.26.2. Products
- 12.1.26.3. Company Financials
- 12.1.26.4. SWOT Analysis
- 12.1.27 S.L.U.
- 12.1.27.1. Company Overview
- 12.1.27.2. Products
- 12.1.27.3. Company Financials
- 12.1.27.4. SWOT Analysis
- 12.1.28 TCS John Huxley Europe Ltd.
- 12.1.28.1. Company Overview
- 12.1.28.2. Products
- 12.1.28.3. Company Financials
- 12.1.28.4. SWOT Analysis
- 12.1.1 Abbiati Casino Equipment S.r.l.
- 12.2. Market Entropy
- 12.2.1 Company's Key Areas Served
- 12.2.2 Recent Developments
- 12.3. Company Market Share Analysis 2025
- 12.3.1 Top 5 Companies Market Share Analysis
- 12.3.2 Top 3 Companies Market Share Analysis
- 12.4. List of Potential Customers
- 13. Research Methodology
List of Figures
- Figure 1: Global Gambling Games Equipment Revenue Breakdown (billion, %) by Region 2025 & 2033
- Figure 2: Global Gambling Games Equipment Volume Breakdown (K, %) by Region 2025 & 2033
- Figure 3: North America Gambling Games Equipment Revenue (billion), by Application 2025 & 2033
- Figure 4: North America Gambling Games Equipment Volume (K), by Application 2025 & 2033
- Figure 5: North America Gambling Games Equipment Revenue Share (%), by Application 2025 & 2033
- Figure 6: North America Gambling Games Equipment Volume Share (%), by Application 2025 & 2033
- Figure 7: North America Gambling Games Equipment Revenue (billion), by Types 2025 & 2033
- Figure 8: North America Gambling Games Equipment Volume (K), by Types 2025 & 2033
- Figure 9: North America Gambling Games Equipment Revenue Share (%), by Types 2025 & 2033
- Figure 10: North America Gambling Games Equipment Volume Share (%), by Types 2025 & 2033
- Figure 11: North America Gambling Games Equipment Revenue (billion), by Country 2025 & 2033
- Figure 12: North America Gambling Games Equipment Volume (K), by Country 2025 & 2033
- Figure 13: North America Gambling Games Equipment Revenue Share (%), by Country 2025 & 2033
- Figure 14: North America Gambling Games Equipment Volume Share (%), by Country 2025 & 2033
- Figure 15: South America Gambling Games Equipment Revenue (billion), by Application 2025 & 2033
- Figure 16: South America Gambling Games Equipment Volume (K), by Application 2025 & 2033
- Figure 17: South America Gambling Games Equipment Revenue Share (%), by Application 2025 & 2033
- Figure 18: South America Gambling Games Equipment Volume Share (%), by Application 2025 & 2033
- Figure 19: South America Gambling Games Equipment Revenue (billion), by Types 2025 & 2033
- Figure 20: South America Gambling Games Equipment Volume (K), by Types 2025 & 2033
- Figure 21: South America Gambling Games Equipment Revenue Share (%), by Types 2025 & 2033
- Figure 22: South America Gambling Games Equipment Volume Share (%), by Types 2025 & 2033
- Figure 23: South America Gambling Games Equipment Revenue (billion), by Country 2025 & 2033
- Figure 24: South America Gambling Games Equipment Volume (K), by Country 2025 & 2033
- Figure 25: South America Gambling Games Equipment Revenue Share (%), by Country 2025 & 2033
- Figure 26: South America Gambling Games Equipment Volume Share (%), by Country 2025 & 2033
- Figure 27: Europe Gambling Games Equipment Revenue (billion), by Application 2025 & 2033
- Figure 28: Europe Gambling Games Equipment Volume (K), by Application 2025 & 2033
- Figure 29: Europe Gambling Games Equipment Revenue Share (%), by Application 2025 & 2033
- Figure 30: Europe Gambling Games Equipment Volume Share (%), by Application 2025 & 2033
- Figure 31: Europe Gambling Games Equipment Revenue (billion), by Types 2025 & 2033
- Figure 32: Europe Gambling Games Equipment Volume (K), by Types 2025 & 2033
- Figure 33: Europe Gambling Games Equipment Revenue Share (%), by Types 2025 & 2033
- Figure 34: Europe Gambling Games Equipment Volume Share (%), by Types 2025 & 2033
- Figure 35: Europe Gambling Games Equipment Revenue (billion), by Country 2025 & 2033
- Figure 36: Europe Gambling Games Equipment Volume (K), by Country 2025 & 2033
- Figure 37: Europe Gambling Games Equipment Revenue Share (%), by Country 2025 & 2033
- Figure 38: Europe Gambling Games Equipment Volume Share (%), by Country 2025 & 2033
- Figure 39: Middle East & Africa Gambling Games Equipment Revenue (billion), by Application 2025 & 2033
- Figure 40: Middle East & Africa Gambling Games Equipment Volume (K), by Application 2025 & 2033
- Figure 41: Middle East & Africa Gambling Games Equipment Revenue Share (%), by Application 2025 & 2033
- Figure 42: Middle East & Africa Gambling Games Equipment Volume Share (%), by Application 2025 & 2033
- Figure 43: Middle East & Africa Gambling Games Equipment Revenue (billion), by Types 2025 & 2033
- Figure 44: Middle East & Africa Gambling Games Equipment Volume (K), by Types 2025 & 2033
- Figure 45: Middle East & Africa Gambling Games Equipment Revenue Share (%), by Types 2025 & 2033
- Figure 46: Middle East & Africa Gambling Games Equipment Volume Share (%), by Types 2025 & 2033
- Figure 47: Middle East & Africa Gambling Games Equipment Revenue (billion), by Country 2025 & 2033
- Figure 48: Middle East & Africa Gambling Games Equipment Volume (K), by Country 2025 & 2033
- Figure 49: Middle East & Africa Gambling Games Equipment Revenue Share (%), by Country 2025 & 2033
- Figure 50: Middle East & Africa Gambling Games Equipment Volume Share (%), by Country 2025 & 2033
- Figure 51: Asia Pacific Gambling Games Equipment Revenue (billion), by Application 2025 & 2033
- Figure 52: Asia Pacific Gambling Games Equipment Volume (K), by Application 2025 & 2033
- Figure 53: Asia Pacific Gambling Games Equipment Revenue Share (%), by Application 2025 & 2033
- Figure 54: Asia Pacific Gambling Games Equipment Volume Share (%), by Application 2025 & 2033
- Figure 55: Asia Pacific Gambling Games Equipment Revenue (billion), by Types 2025 & 2033
- Figure 56: Asia Pacific Gambling Games Equipment Volume (K), by Types 2025 & 2033
- Figure 57: Asia Pacific Gambling Games Equipment Revenue Share (%), by Types 2025 & 2033
- Figure 58: Asia Pacific Gambling Games Equipment Volume Share (%), by Types 2025 & 2033
- Figure 59: Asia Pacific Gambling Games Equipment Revenue (billion), by Country 2025 & 2033
- Figure 60: Asia Pacific Gambling Games Equipment Volume (K), by Country 2025 & 2033
- Figure 61: Asia Pacific Gambling Games Equipment Revenue Share (%), by Country 2025 & 2033
- Figure 62: Asia Pacific Gambling Games Equipment Volume Share (%), by Country 2025 & 2033
List of Tables
- Table 1: Global Gambling Games Equipment Revenue billion Forecast, by Application 2020 & 2033
- Table 2: Global Gambling Games Equipment Volume K Forecast, by Application 2020 & 2033
- Table 3: Global Gambling Games Equipment Revenue billion Forecast, by Types 2020 & 2033
- Table 4: Global Gambling Games Equipment Volume K Forecast, by Types 2020 & 2033
- Table 5: Global Gambling Games Equipment Revenue billion Forecast, by Region 2020 & 2033
- Table 6: Global Gambling Games Equipment Volume K Forecast, by Region 2020 & 2033
- Table 7: Global Gambling Games Equipment Revenue billion Forecast, by Application 2020 & 2033
- Table 8: Global Gambling Games Equipment Volume K Forecast, by Application 2020 & 2033
- Table 9: Global Gambling Games Equipment Revenue billion Forecast, by Types 2020 & 2033
- Table 10: Global Gambling Games Equipment Volume K Forecast, by Types 2020 & 2033
- Table 11: Global Gambling Games Equipment Revenue billion Forecast, by Country 2020 & 2033
- Table 12: Global Gambling Games Equipment Volume K Forecast, by Country 2020 & 2033
- Table 13: United States Gambling Games Equipment Revenue (billion) Forecast, by Application 2020 & 2033
- Table 14: United States Gambling Games Equipment Volume (K) Forecast, by Application 2020 & 2033
- Table 15: Canada Gambling Games Equipment Revenue (billion) Forecast, by Application 2020 & 2033
- Table 16: Canada Gambling Games Equipment Volume (K) Forecast, by Application 2020 & 2033
- Table 17: Mexico Gambling Games Equipment Revenue (billion) Forecast, by Application 2020 & 2033
- Table 18: Mexico Gambling Games Equipment Volume (K) Forecast, by Application 2020 & 2033
- Table 19: Global Gambling Games Equipment Revenue billion Forecast, by Application 2020 & 2033
- Table 20: Global Gambling Games Equipment Volume K Forecast, by Application 2020 & 2033
- Table 21: Global Gambling Games Equipment Revenue billion Forecast, by Types 2020 & 2033
- Table 22: Global Gambling Games Equipment Volume K Forecast, by Types 2020 & 2033
- Table 23: Global Gambling Games Equipment Revenue billion Forecast, by Country 2020 & 2033
- Table 24: Global Gambling Games Equipment Volume K Forecast, by Country 2020 & 2033
- Table 25: Brazil Gambling Games Equipment Revenue (billion) Forecast, by Application 2020 & 2033
- Table 26: Brazil Gambling Games Equipment Volume (K) Forecast, by Application 2020 & 2033
- Table 27: Argentina Gambling Games Equipment Revenue (billion) Forecast, by Application 2020 & 2033
- Table 28: Argentina Gambling Games Equipment Volume (K) Forecast, by Application 2020 & 2033
- Table 29: Rest of South America Gambling Games Equipment Revenue (billion) Forecast, by Application 2020 & 2033
- Table 30: Rest of South America Gambling Games Equipment Volume (K) Forecast, by Application 2020 & 2033
- Table 31: Global Gambling Games Equipment Revenue billion Forecast, by Application 2020 & 2033
- Table 32: Global Gambling Games Equipment Volume K Forecast, by Application 2020 & 2033
- Table 33: Global Gambling Games Equipment Revenue billion Forecast, by Types 2020 & 2033
- Table 34: Global Gambling Games Equipment Volume K Forecast, by Types 2020 & 2033
- Table 35: Global Gambling Games Equipment Revenue billion Forecast, by Country 2020 & 2033
- Table 36: Global Gambling Games Equipment Volume K Forecast, by Country 2020 & 2033
- Table 37: United Kingdom Gambling Games Equipment Revenue (billion) Forecast, by Application 2020 & 2033
- Table 38: United Kingdom Gambling Games Equipment Volume (K) Forecast, by Application 2020 & 2033
- Table 39: Germany Gambling Games Equipment Revenue (billion) Forecast, by Application 2020 & 2033
- Table 40: Germany Gambling Games Equipment Volume (K) Forecast, by Application 2020 & 2033
- Table 41: France Gambling Games Equipment Revenue (billion) Forecast, by Application 2020 & 2033
- Table 42: France Gambling Games Equipment Volume (K) Forecast, by Application 2020 & 2033
- Table 43: Italy Gambling Games Equipment Revenue (billion) Forecast, by Application 2020 & 2033
- Table 44: Italy Gambling Games Equipment Volume (K) Forecast, by Application 2020 & 2033
- Table 45: Spain Gambling Games Equipment Revenue (billion) Forecast, by Application 2020 & 2033
- Table 46: Spain Gambling Games Equipment Volume (K) Forecast, by Application 2020 & 2033
- Table 47: Russia Gambling Games Equipment Revenue (billion) Forecast, by Application 2020 & 2033
- Table 48: Russia Gambling Games Equipment Volume (K) Forecast, by Application 2020 & 2033
- Table 49: Benelux Gambling Games Equipment Revenue (billion) Forecast, by Application 2020 & 2033
- Table 50: Benelux Gambling Games Equipment Volume (K) Forecast, by Application 2020 & 2033
- Table 51: Nordics Gambling Games Equipment Revenue (billion) Forecast, by Application 2020 & 2033
- Table 52: Nordics Gambling Games Equipment Volume (K) Forecast, by Application 2020 & 2033
- Table 53: Rest of Europe Gambling Games Equipment Revenue (billion) Forecast, by Application 2020 & 2033
- Table 54: Rest of Europe Gambling Games Equipment Volume (K) Forecast, by Application 2020 & 2033
- Table 55: Global Gambling Games Equipment Revenue billion Forecast, by Application 2020 & 2033
- Table 56: Global Gambling Games Equipment Volume K Forecast, by Application 2020 & 2033
- Table 57: Global Gambling Games Equipment Revenue billion Forecast, by Types 2020 & 2033
- Table 58: Global Gambling Games Equipment Volume K Forecast, by Types 2020 & 2033
- Table 59: Global Gambling Games Equipment Revenue billion Forecast, by Country 2020 & 2033
- Table 60: Global Gambling Games Equipment Volume K Forecast, by Country 2020 & 2033
- Table 61: Turkey Gambling Games Equipment Revenue (billion) Forecast, by Application 2020 & 2033
- Table 62: Turkey Gambling Games Equipment Volume (K) Forecast, by Application 2020 & 2033
- Table 63: Israel Gambling Games Equipment Revenue (billion) Forecast, by Application 2020 & 2033
- Table 64: Israel Gambling Games Equipment Volume (K) Forecast, by Application 2020 & 2033
- Table 65: GCC Gambling Games Equipment Revenue (billion) Forecast, by Application 2020 & 2033
- Table 66: GCC Gambling Games Equipment Volume (K) Forecast, by Application 2020 & 2033
- Table 67: North Africa Gambling Games Equipment Revenue (billion) Forecast, by Application 2020 & 2033
- Table 68: North Africa Gambling Games Equipment Volume (K) Forecast, by Application 2020 & 2033
- Table 69: South Africa Gambling Games Equipment Revenue (billion) Forecast, by Application 2020 & 2033
- Table 70: South Africa Gambling Games Equipment Volume (K) Forecast, by Application 2020 & 2033
- Table 71: Rest of Middle East & Africa Gambling Games Equipment Revenue (billion) Forecast, by Application 2020 & 2033
- Table 72: Rest of Middle East & Africa Gambling Games Equipment Volume (K) Forecast, by Application 2020 & 2033
- Table 73: Global Gambling Games Equipment Revenue billion Forecast, by Application 2020 & 2033
- Table 74: Global Gambling Games Equipment Volume K Forecast, by Application 2020 & 2033
- Table 75: Global Gambling Games Equipment Revenue billion Forecast, by Types 2020 & 2033
- Table 76: Global Gambling Games Equipment Volume K Forecast, by Types 2020 & 2033
- Table 77: Global Gambling Games Equipment Revenue billion Forecast, by Country 2020 & 2033
- Table 78: Global Gambling Games Equipment Volume K Forecast, by Country 2020 & 2033
- Table 79: China Gambling Games Equipment Revenue (billion) Forecast, by Application 2020 & 2033
- Table 80: China Gambling Games Equipment Volume (K) Forecast, by Application 2020 & 2033
- Table 81: India Gambling Games Equipment Revenue (billion) Forecast, by Application 2020 & 2033
- Table 82: India Gambling Games Equipment Volume (K) Forecast, by Application 2020 & 2033
- Table 83: Japan Gambling Games Equipment Revenue (billion) Forecast, by Application 2020 & 2033
- Table 84: Japan Gambling Games Equipment Volume (K) Forecast, by Application 2020 & 2033
- Table 85: South Korea Gambling Games Equipment Revenue (billion) Forecast, by Application 2020 & 2033
- Table 86: South Korea Gambling Games Equipment Volume (K) Forecast, by Application 2020 & 2033
- Table 87: ASEAN Gambling Games Equipment Revenue (billion) Forecast, by Application 2020 & 2033
- Table 88: ASEAN Gambling Games Equipment Volume (K) Forecast, by Application 2020 & 2033
- Table 89: Oceania Gambling Games Equipment Revenue (billion) Forecast, by Application 2020 & 2033
- Table 90: Oceania Gambling Games Equipment Volume (K) Forecast, by Application 2020 & 2033
- Table 91: Rest of Asia Pacific Gambling Games Equipment Revenue (billion) Forecast, by Application 2020 & 2033
- Table 92: Rest of Asia Pacific Gambling Games Equipment Volume (K) Forecast, by Application 2020 & 2033
Frequently Asked Questions
1. What is the projected Compound Annual Growth Rate (CAGR) of the Gambling Games Equipment?
The projected CAGR is approximately 9.36%.
2. Which companies are prominent players in the Gambling Games Equipment?
Key companies in the market include Abbiati Casino Equipment S.r.l., AGS LLC, Ainsworth Game Technology Limited, Angel Group Co., Ltd., Aristocrat Leisure Limited, Aruze Gaming Technologies Co., Ltd., CTC Holdings, Euro Games Technology Ltd., Everi Holdings Inc., GameBridge Casino Equipment, Gaming Technologies, Incredible Technologies, Inc., Inspired Entertainment, Inc., International Game Technology PLC, Jackpot Digital, Inc., Konami Gaming Inc., Matsui Gaming Machine CO., LTD., New Vision Gaming, NOVOMATIC AG, R. Franco technologies, S.L.U., TCS John Huxley Europe Ltd..
3. What are the main segments of the Gambling Games Equipment?
The market segments include Application, Types.
4. Can you provide details about the market size?
The market size is estimated to be USD 7.48 billion as of 2022.
5. What are some drivers contributing to market growth?
N/A
6. What are the notable trends driving market growth?
N/A
7. Are there any restraints impacting market growth?
N/A
8. Can you provide examples of recent developments in the market?
N/A
9. What pricing options are available for accessing the report?
Pricing options include single-user, multi-user, and enterprise licenses priced at USD 3350.00, USD 5025.00, and USD 6700.00 respectively.
10. Is the market size provided in terms of value or volume?
The market size is provided in terms of value, measured in billion and volume, measured in K.
11. Are there any specific market keywords associated with the report?
Yes, the market keyword associated with the report is "Gambling Games Equipment," which aids in identifying and referencing the specific market segment covered.
12. How do I determine which pricing option suits my needs best?
The pricing options vary based on user requirements and access needs. Individual users may opt for single-user licenses, while businesses requiring broader access may choose multi-user or enterprise licenses for cost-effective access to the report.
13. Are there any additional resources or data provided in the Gambling Games Equipment report?
While the report offers comprehensive insights, it's advisable to review the specific contents or supplementary materials provided to ascertain if additional resources or data are available.
14. How can I stay updated on further developments or reports in the Gambling Games Equipment?
To stay informed about further developments, trends, and reports in the Gambling Games Equipment, consider subscribing to industry newsletters, following relevant companies and organizations, or regularly checking reputable industry news sources and publications.
Methodology
Step 1 - Identification of Relevant Samples Size from Population Database


Step 2 - Approaches for Defining Global Market Size (Value, Volume* & Price*)

Note*: In applicable scenarios
Step 3 - Data Sources
Primary Research
- Web Analytics
- Survey Reports
- Research Institute
- Latest Research Reports
- Opinion Leaders
Secondary Research
- Annual Reports
- White Paper
- Latest Press Release
- Industry Association
- Paid Database
- Investor Presentations

Step 4 - Data Triangulation
Involves using different sources of information in order to increase the validity of a study
These sources are likely to be stakeholders in a program - participants, other researchers, program staff, other community members, and so on.
Then we put all data in single framework & apply various statistical tools to find out the dynamic on the market.
During the analysis stage, feedback from the stakeholder groups would be compared to determine areas of agreement as well as areas of divergence