

Key Insights
The Gallium Nitride (GaN) semiconductor market is poised for substantial expansion, projected to reach $21.18 million by 2025, with a robust Compound Annual Growth Rate (CAGR) of 6.06% through 2033. This rapid ascent is driven by the inherent advantages of GaN technology, including superior power efficiency, higher switching frequencies, and miniaturization capabilities compared to traditional silicon-based semiconductors. These attributes are making GaN indispensable in a variety of high-growth applications. Key drivers include the escalating demand for energy-efficient power electronics in consumer electronics, electric vehicles, and data centers. The burgeoning adoption of 5G infrastructure, which necessitates advanced RF components, further fuels this market. Moreover, the increasing focus on reducing energy consumption and carbon footprints across industries is a significant catalyst for GaN adoption. Emerging applications in areas like solid-state lighting and advanced power supplies are also contributing to sustained market momentum.
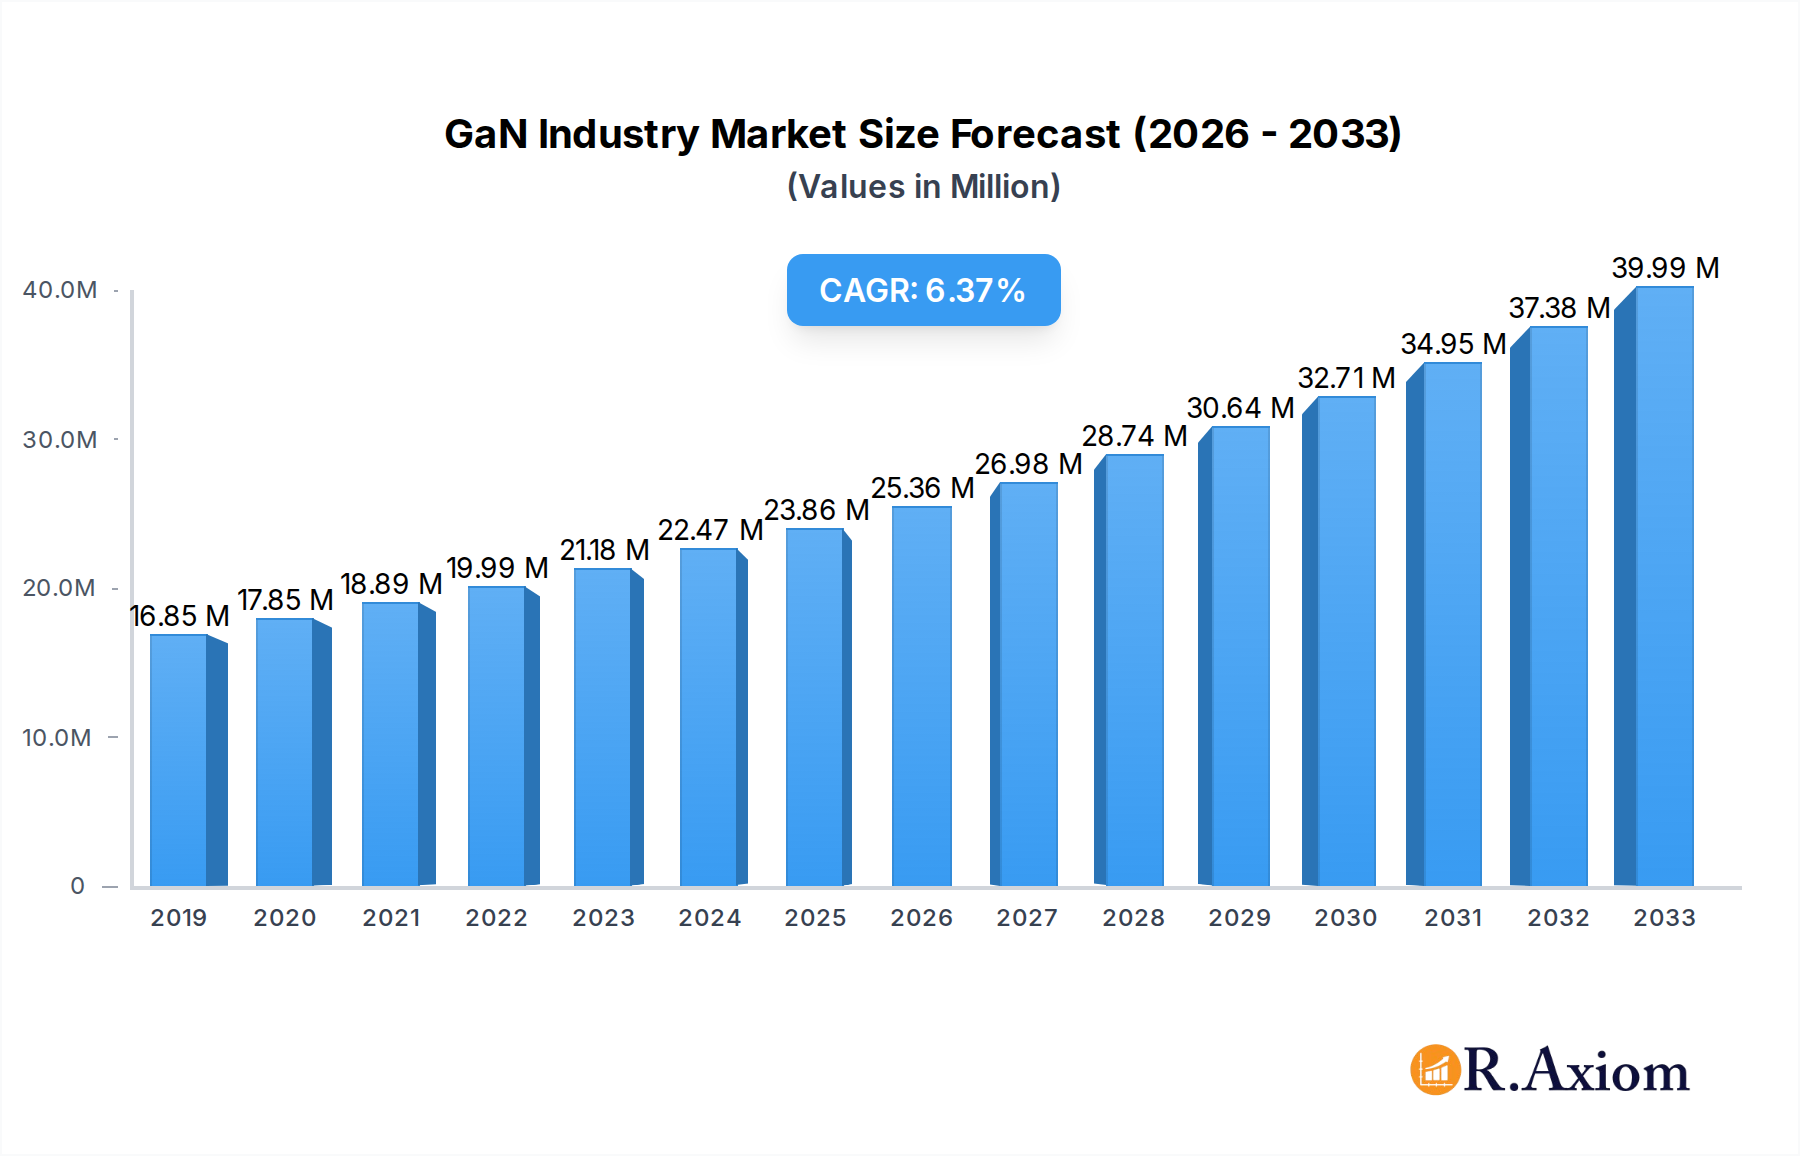
GaN Industry Market Size (In Million)
The market's trajectory is further shaped by dynamic trends such as the continuous innovation in GaN-on-SiC and GaN-on-GaN wafer technologies, enabling higher performance and reliability. The integration of GaN devices into power management systems for electric vehicles and the development of compact, high-efficiency chargers for consumer electronics are prominent trends. However, the market also faces certain restraints. The high manufacturing cost of GaN wafers and components, coupled with the need for specialized manufacturing processes and equipment, can hinder widespread adoption, particularly in cost-sensitive applications. Furthermore, the established ecosystem and supply chain for silicon-based semiconductors present a competitive challenge. Despite these challenges, the inherent performance benefits and ongoing technological advancements are expected to overcome these hurdles, paving the way for significant growth in the GaN semiconductor market. The diverse segmentation, spanning Power, Opto, and RF semiconductors, and the broad range of applications across Automotive, Consumer Electronics, and ICT, underscore the pervasive impact of GaN technology.

GaN Industry Company Market Share
Comprehensive GaN Industry Report: Market Analysis, Trends, and Future Outlook (2019-2033)
This in-depth report provides a definitive analysis of the Gallium Nitride (GaN) industry, encompassing its current state, historical performance, and projected trajectory through 2033. Leveraging extensive research from the historical period of 2019-2024 and focusing on the base year of 2025, this study offers critical insights for industry stakeholders. With a forecast period spanning 2025-2033, we deliver actionable intelligence on market dynamics, technological advancements, key players, and emerging opportunities in the rapidly evolving GaN semiconductor market. This report is essential for businesses seeking to understand and capitalize on the significant growth in GaN power semiconductors, GaN transistors, GaN RF semiconductors, and their applications across vital sectors like automotive GaN solutions, consumer electronics GaN, and ICT GaN technology.
GaN Industry Market Concentration & Innovation
The GaN industry exhibits a dynamic market concentration driven by intense innovation and strategic consolidation. While some segments are dominated by a few key players, the overall landscape is characterized by continuous technological advancements and the emergence of new applications. Key innovation drivers include the relentless pursuit of higher power efficiency, smaller form factors, and enhanced thermal management in GaN devices. Regulatory frameworks, particularly those promoting energy efficiency and reduced carbon footprints, are also indirectly influencing GaN adoption. Product substitutes, primarily silicon-based solutions, remain a competitive force, but the superior performance characteristics of GaN are increasingly enabling its penetration into new markets. End-user trends favor miniaturization and increased power density, directly benefiting GaN technology. Merger and acquisition (M&A) activities are significant, with deal values reflecting the strategic importance of acquiring GaN expertise and market access. For instance, in recent years, significant M&A activity has occurred, with deal values often reaching into the hundreds of millions. Market share analysis reveals a concentrated presence of leaders in specific GaN semiconductor categories, such as power GaN transistors and GaN RF chips. The continuous investment in R&D and the increasing demand for high-performance solutions are shaping the competitive environment, ensuring sustained innovation.
GaN Industry Industry Trends & Insights
The GaN industry is on a significant upward trajectory, propelled by a confluence of transformative trends and compelling insights. The primary growth driver is the insatiable demand for higher energy efficiency across nearly all electronic applications. GaN technology, with its superior electron mobility and breakdown voltage compared to silicon, offers substantial improvements in power conversion efficiency, leading to reduced energy consumption and heat dissipation. This efficiency gain is critical for the proliferation of electric vehicles, renewable energy systems, and advanced data centers, all of which are experiencing exponential growth. Technological disruptions are fundamentally reshaping the semiconductor landscape, with GaN at the forefront of this revolution. The ability to operate at higher frequencies and voltages enables the development of smaller, lighter, and more powerful electronic systems. Consumer preferences are increasingly geared towards faster charging, longer battery life, and more compact devices, all of which are directly addressed by GaN-based solutions. The competitive dynamics within the GaN market are intense, with established semiconductor giants and agile startups vying for market dominance. Companies are investing heavily in R&D to improve manufacturing processes, reduce costs, and expand the application portfolio of GaN devices. The projected Compound Annual Growth Rate (CAGR) for the GaN market is robust, with estimates often exceeding 25% in key segments. Market penetration of GaN technology, while still nascent in some areas, is rapidly accelerating, indicating a substantial runway for future growth. The integration of GaN into mainstream applications such as smartphone chargers, power adapters, and advanced driver-assistance systems (ADAS) in automobiles signifies a significant shift from niche to broad market adoption. The development of novel GaN materials and advanced packaging techniques further fuels this expansion, pushing the boundaries of what is possible in electronic performance and miniaturization. The ongoing pursuit of next-generation power electronics, from solid-state transformers to advanced wireless power transfer systems, is intrinsically linked to the continued evolution and widespread adoption of GaN technology. The projected market size is expected to reach hundreds of millions by the end of the forecast period, underscoring the immense potential.
Dominant Markets & Segments in GaN Industry
The GaN industry is experiencing rapid growth and diversification, with several key markets and segments demonstrating exceptional dominance. Among the types of GaN semiconductors, Power Semiconductors are currently leading the charge, driven by their critical role in energy efficiency and power management across a multitude of applications. This segment is expected to maintain its leading position due to the global push for energy conservation and the electrification of various industries. The Automotive end-user industry is a significant and rapidly expanding market for GaN, particularly for electric vehicle (EV) powertrains, onboard chargers, and ADAS. Government incentives for EV adoption and the increasing demand for higher performance and lighter vehicles are key economic policies driving this dominance. In the Consumer Electronics sector, GaN transistors and power ICs are enabling faster charging, smaller power adapters, and more efficient mobile devices. This segment's dominance is fueled by constant consumer demand for innovation and improved device performance. The Information Communication and Technology (ICT) sector, including data centers and telecommunications infrastructure, is another crucial area where GaN's high-frequency and high-power capabilities are indispensable for next-generation networking equipment and efficient power supplies. The Aerospace and Defense sector also represents a significant market due to GaN's ability to withstand harsh environments and deliver high-performance RF capabilities for radar and communication systems.
Key drivers for the dominance of these segments include:
- Technological Superiority: GaN's inherent advantages in switching speed, power density, and operating temperature over silicon are fundamental to its adoption in high-performance applications.
- Energy Efficiency Mandates: Global policies and consumer demand for reduced energy consumption are directly benefiting GaN power solutions.
- Electrification Trends: The widespread adoption of electric vehicles and the expansion of renewable energy infrastructure create a massive demand for efficient power conversion using GaN.
- Miniaturization Demands: The ongoing trend towards smaller, lighter, and more portable electronic devices favors the compact form factor achievable with GaN.
- Advancements in Manufacturing: Continuous improvements in GaN fabrication processes are leading to higher yields and lower costs, making GaN more competitive and accessible.
The Power Semiconductors segment, encompassing devices like GaN transistors, GaN diodes, and GaN rectifiers, is projected to command a substantial market share, exceeding hundreds of millions in value. RF Semiconductors are also seeing significant traction, particularly in 5G infrastructure and advanced radar systems. The dominance of the Automotive sector is further amplified by stringent safety and performance standards, where GaN offers critical advantages. Similarly, the Consumer Electronics market, with its vast consumer base and rapid product cycles, provides a consistent demand for GaN-enabled advancements, contributing hundreds of millions to market revenue. The Information Communication and Technology segment's reliance on high-speed data transmission and energy-efficient data centers solidifies its leading position, with investments in 5G and AI driving this demand.
GaN Industry Product Developments
The GaN industry is characterized by a rapid pace of product innovation, with a strong emphasis on enhancing performance, reducing size, and expanding application scope. Key developments include the introduction of higher voltage GaN transistors and integrated power modules that offer superior efficiency and power density for applications ranging from electric vehicle charging to industrial power supplies. The development of advanced packaging technologies is also crucial, enabling better thermal management and higher reliability. Competitive advantages stem from GaN's ability to operate at higher frequencies and temperatures compared to traditional silicon, leading to smaller and lighter end products, reduced energy loss, and improved system performance. These innovations are directly addressing the growing demand for more efficient and compact electronic solutions across the automotive, consumer electronics, and ICT sectors.
Report Scope & Segmentation Analysis
This report meticulously analyzes the Gallium Nitride (GaN) industry across its diverse segments. The segmentation includes: Type: Power Semiconductors, Opto-Semiconductors, and RF Semiconductors, with Power Semiconductors expected to lead in market size and growth. Devices: Transistors, Diodes, Rectifiers, and Power ICs are examined, with a strong focus on GaN transistors due to their broad applicability. End-user Industry: Automotive, Consumer Electronics, Aerospace and Defense, Medical, Information Communication and Technology, and Other End-user Industries are thoroughly assessed. The Automotive and Consumer Electronics segments are projected to exhibit the highest growth rates, driven by increasing adoption of GaN technology. Each segment's market size, growth projections, and competitive dynamics are analyzed in detail, providing a comprehensive understanding of the GaN market landscape. The market for GaN Power Semiconductors is estimated to reach hundreds of millions, with a significant CAGR expected throughout the forecast period.
Key Drivers of GaN Industry Growth
The growth of the GaN industry is propelled by several interconnected factors. Foremost is the inherent technological superiority of GaN materials, offering higher electron mobility and breakdown voltage, leading to significant improvements in power efficiency and reduced energy loss. This is critically important in the global drive for energy conservation and sustainability. The accelerating electrification trend, particularly in the automotive sector with the burgeoning electric vehicle (EV) market, creates immense demand for efficient power conversion solutions, where GaN excels. Furthermore, the continuous quest for miniaturization and higher power density in consumer electronics and ICT infrastructure fuels the adoption of GaN, enabling smaller and more powerful devices. Regulatory push for energy efficiency standards and government incentives for clean energy technologies also act as significant catalysts for GaN market expansion.
Challenges in the GaN Industry Sector
Despite its robust growth potential, the GaN industry faces several challenges that temper its rapid advancement. The higher manufacturing costs compared to established silicon technologies remain a significant barrier to widespread adoption in cost-sensitive applications. Supply chain complexities and raw material availability, particularly for high-purity GaN substrates, can lead to price volatility and production constraints. Furthermore, the technical expertise and specialized equipment required for GaN device fabrication can limit the number of manufacturers capable of producing high-quality devices, contributing to market concentration and potential supply bottlenecks. Developing comprehensive standardization and interoperability across different GaN components and systems is also an ongoing challenge. Lastly, competition from advanced silicon carbide (SiC) and next-generation silicon technologies presents a continuous need for GaN manufacturers to innovate and demonstrate clear performance advantages to maintain market share, impacting potential market size.
Emerging Opportunities in GaN Industry
The GaN industry is ripe with emerging opportunities driven by technological advancements and evolving market demands. The expansion of 5G infrastructure and future wireless communication technologies presents a substantial opportunity for GaN RF power amplifiers due to their high-frequency capabilities and efficiency. The burgeoning renewable energy sector, including solar and wind power, requires highly efficient power conversion systems where GaN can play a pivotal role in grid stabilization and energy storage. In the automotive sector, beyond EVs, opportunities lie in advanced lighting systems, radar for autonomous driving, and integrated powertrain solutions. The growing demand for consumer electronics with faster charging, longer battery life, and increased portability continues to create avenues for GaN integration. Furthermore, advancements in GaN-on-Si manufacturing techniques promise to reduce costs and increase wafer sizes, opening up new market segments previously inaccessible due to cost barriers, potentially increasing market penetration significantly.
Leading Players in the GaN Industry Market
- Efficient Power Conversion Corporation
- Infineon Technologies AG
- Microchip Technology Inc
- GaN Systems
- NexGen Power Systems
- NXP Semiconductors
- Wolfspeed Inc
- Toshiba Electronic Devices & Storage Corporation
- Soitec
- Qorvo Inc
- Texas Instruments Incorporated
- NTT Advanced Technology Corporation
Key Developments in GaN Industry Industry
- Jan 2024: Silvaco Group, Inc. partnered with GaN Valley to advance GaN power device design using its Victory TCAD platform, focusing on comprehensive simulation for optimized performance.
- July 2023: STMicroelectronics commenced large-scale manufacturing of e-mode PowerGaN HEMT devices, enhancing the development of high-efficiency power conversion systems for applications including chargers, industrial power, and automotive electrification.
Strategic Outlook for GaN Industry Market
The strategic outlook for the GaN industry market is exceptionally positive, underpinned by several growth catalysts. The relentless demand for higher energy efficiency across all sectors, coupled with the global push towards electrification and sustainability, will continue to be the primary growth engine. Advancements in GaN material science, device architecture, and manufacturing processes will further enhance performance and reduce costs, enabling wider adoption. The expanding application base in electric vehicles, renewable energy systems, 5G infrastructure, and advanced consumer electronics signifies a robust future market potential. Strategic investments in R&D, capacity expansion, and strategic partnerships among leading players will be crucial for capturing this growth. The industry is poised for sustained expansion, with market sizes expected to reach significant figures in the coming years, driven by innovation and market penetration.
GaN Industry Segmentation
-
1. Type
- 1.1. Power Semiconductors
- 1.2. Opto-Semiconductors
- 1.3. RF Semiconductors
-
2. Devices
- 2.1. Transistors
- 2.2. Diodes
- 2.3. Rectifiers
- 2.4. Power ICs
-
3. End-user Industry
- 3.1. Automotive
- 3.2. Consumer Electronics
- 3.3. Aerospace and Defense
- 3.4. Medical
- 3.5. Information Communication and Technology
- 3.6. Other End-user Industries
GaN Industry Segmentation By Geography
- 1. United States
- 2. Europe
- 3. Japan
- 4. China
- 5. Korea
- 6. Taiwan
- 7. Latin America
- 8. Middle East and Africa
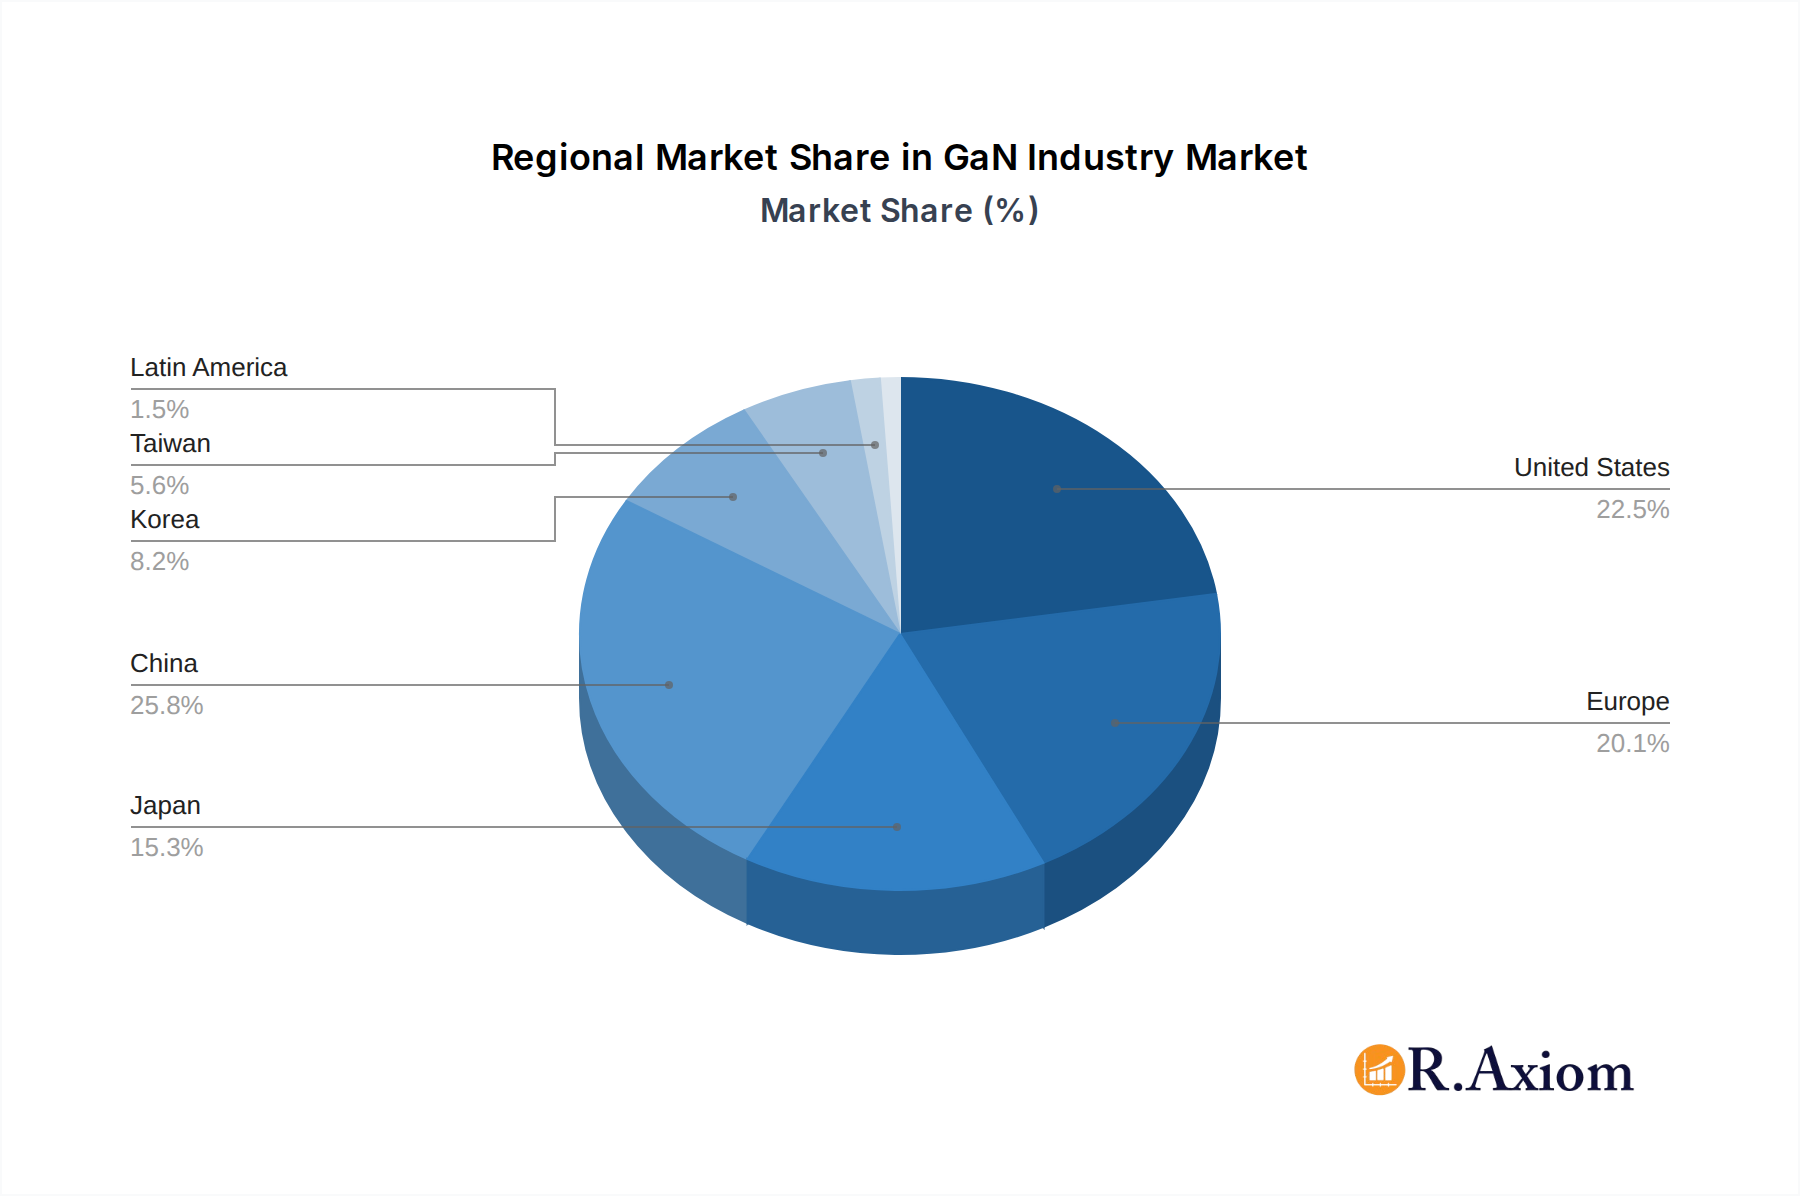
GaN Industry Regional Market Share
Geographic Coverage of GaN Industry
GaN Industry REPORT HIGHLIGHTS
| Aspects | Details |
|---|---|
| Study Period | 2020-2034 |
| Base Year | 2025 |
| Estimated Year | 2026 |
| Forecast Period | 2026-2034 |
| Historical Period | 2020-2025 |
| Growth Rate | CAGR of 6.06% from 2020-2034 |
| Segmentation |
|
Table of Contents
- 1. Introduction
- 1.1. Research Scope
- 1.2. Market Segmentation
- 1.3. Research Objective
- 1.4. Definitions and Assumptions
- 2. Executive Summary
- 2.1. Market Snapshot
- 3. Market Dynamics
- 3.1. Market Drivers
- 3.2. Market Restrains
- 3.3. Market Trends
- 3.4. Market Opportunities
- 4. Market Factor Analysis
- 4.1. Porters Five Forces
- 4.1.1. Bargaining Power of Suppliers
- 4.1.2. Bargaining Power of Buyers
- 4.1.3. Threat of New Entrants
- 4.1.4. Threat of Substitutes
- 4.1.5. Competitive Rivalry
- 4.2. PESTEL analysis
- 4.3. BCG Analysis
- 4.3.1. Stars (High Growth, High Market Share)
- 4.3.2. Cash Cows (Low Growth, High Market Share)
- 4.3.3. Question Mark (High Growth, Low Market Share)
- 4.3.4. Dogs (Low Growth, Low Market Share)
- 4.4. Ansoff Matrix Analysis
- 4.5. Supply Chain Analysis
- 4.6. Regulatory Landscape
- 4.7. Current Market Potential and Opportunity Assessment (TAM–SAM–SOM Framework)
- 4.8. RAX Analyst Note
- 4.1. Porters Five Forces
- 5. Market Analysis, Insights and Forecast 2021-2033
- 5.1. Market Analysis, Insights and Forecast - by Type
- 5.1.1. Power Semiconductors
- 5.1.2. Opto-Semiconductors
- 5.1.3. RF Semiconductors
- 5.2. Market Analysis, Insights and Forecast - by Devices
- 5.2.1. Transistors
- 5.2.2. Diodes
- 5.2.3. Rectifiers
- 5.2.4. Power ICs
- 5.3. Market Analysis, Insights and Forecast - by End-user Industry
- 5.3.1. Automotive
- 5.3.2. Consumer Electronics
- 5.3.3. Aerospace and Defense
- 5.3.4. Medical
- 5.3.5. Information Communication and Technology
- 5.3.6. Other End-user Industries
- 5.4. Market Analysis, Insights and Forecast - by Region
- 5.4.1. United States
- 5.4.2. Europe
- 5.4.3. Japan
- 5.4.4. China
- 5.4.5. Korea
- 5.4.6. Taiwan
- 5.4.7. Latin America
- 5.4.8. Middle East and Africa
- 5.1. Market Analysis, Insights and Forecast - by Type
- 6. Global GaN Industry Analysis, Insights and Forecast, 2021-2033
- 6.1. Market Analysis, Insights and Forecast - by Type
- 6.1.1. Power Semiconductors
- 6.1.2. Opto-Semiconductors
- 6.1.3. RF Semiconductors
- 6.2. Market Analysis, Insights and Forecast - by Devices
- 6.2.1. Transistors
- 6.2.2. Diodes
- 6.2.3. Rectifiers
- 6.2.4. Power ICs
- 6.3. Market Analysis, Insights and Forecast - by End-user Industry
- 6.3.1. Automotive
- 6.3.2. Consumer Electronics
- 6.3.3. Aerospace and Defense
- 6.3.4. Medical
- 6.3.5. Information Communication and Technology
- 6.3.6. Other End-user Industries
- 6.1. Market Analysis, Insights and Forecast - by Type
- 7. United States GaN Industry Analysis, Insights and Forecast, 2020-2032
- 7.1. Market Analysis, Insights and Forecast - by Type
- 7.1.1. Power Semiconductors
- 7.1.2. Opto-Semiconductors
- 7.1.3. RF Semiconductors
- 7.2. Market Analysis, Insights and Forecast - by Devices
- 7.2.1. Transistors
- 7.2.2. Diodes
- 7.2.3. Rectifiers
- 7.2.4. Power ICs
- 7.3. Market Analysis, Insights and Forecast - by End-user Industry
- 7.3.1. Automotive
- 7.3.2. Consumer Electronics
- 7.3.3. Aerospace and Defense
- 7.3.4. Medical
- 7.3.5. Information Communication and Technology
- 7.3.6. Other End-user Industries
- 7.1. Market Analysis, Insights and Forecast - by Type
- 8. Europe GaN Industry Analysis, Insights and Forecast, 2020-2032
- 8.1. Market Analysis, Insights and Forecast - by Type
- 8.1.1. Power Semiconductors
- 8.1.2. Opto-Semiconductors
- 8.1.3. RF Semiconductors
- 8.2. Market Analysis, Insights and Forecast - by Devices
- 8.2.1. Transistors
- 8.2.2. Diodes
- 8.2.3. Rectifiers
- 8.2.4. Power ICs
- 8.3. Market Analysis, Insights and Forecast - by End-user Industry
- 8.3.1. Automotive
- 8.3.2. Consumer Electronics
- 8.3.3. Aerospace and Defense
- 8.3.4. Medical
- 8.3.5. Information Communication and Technology
- 8.3.6. Other End-user Industries
- 8.1. Market Analysis, Insights and Forecast - by Type
- 9. Japan GaN Industry Analysis, Insights and Forecast, 2020-2032
- 9.1. Market Analysis, Insights and Forecast - by Type
- 9.1.1. Power Semiconductors
- 9.1.2. Opto-Semiconductors
- 9.1.3. RF Semiconductors
- 9.2. Market Analysis, Insights and Forecast - by Devices
- 9.2.1. Transistors
- 9.2.2. Diodes
- 9.2.3. Rectifiers
- 9.2.4. Power ICs
- 9.3. Market Analysis, Insights and Forecast - by End-user Industry
- 9.3.1. Automotive
- 9.3.2. Consumer Electronics
- 9.3.3. Aerospace and Defense
- 9.3.4. Medical
- 9.3.5. Information Communication and Technology
- 9.3.6. Other End-user Industries
- 9.1. Market Analysis, Insights and Forecast - by Type
- 10. China GaN Industry Analysis, Insights and Forecast, 2020-2032
- 10.1. Market Analysis, Insights and Forecast - by Type
- 10.1.1. Power Semiconductors
- 10.1.2. Opto-Semiconductors
- 10.1.3. RF Semiconductors
- 10.2. Market Analysis, Insights and Forecast - by Devices
- 10.2.1. Transistors
- 10.2.2. Diodes
- 10.2.3. Rectifiers
- 10.2.4. Power ICs
- 10.3. Market Analysis, Insights and Forecast - by End-user Industry
- 10.3.1. Automotive
- 10.3.2. Consumer Electronics
- 10.3.3. Aerospace and Defense
- 10.3.4. Medical
- 10.3.5. Information Communication and Technology
- 10.3.6. Other End-user Industries
- 10.1. Market Analysis, Insights and Forecast - by Type
- 11. Korea GaN Industry Analysis, Insights and Forecast, 2020-2032
- 11.1. Market Analysis, Insights and Forecast - by Type
- 11.1.1. Power Semiconductors
- 11.1.2. Opto-Semiconductors
- 11.1.3. RF Semiconductors
- 11.2. Market Analysis, Insights and Forecast - by Devices
- 11.2.1. Transistors
- 11.2.2. Diodes
- 11.2.3. Rectifiers
- 11.2.4. Power ICs
- 11.3. Market Analysis, Insights and Forecast - by End-user Industry
- 11.3.1. Automotive
- 11.3.2. Consumer Electronics
- 11.3.3. Aerospace and Defense
- 11.3.4. Medical
- 11.3.5. Information Communication and Technology
- 11.3.6. Other End-user Industries
- 11.1. Market Analysis, Insights and Forecast - by Type
- 12. Taiwan GaN Industry Analysis, Insights and Forecast, 2020-2032
- 12.1. Market Analysis, Insights and Forecast - by Type
- 12.1.1. Power Semiconductors
- 12.1.2. Opto-Semiconductors
- 12.1.3. RF Semiconductors
- 12.2. Market Analysis, Insights and Forecast - by Devices
- 12.2.1. Transistors
- 12.2.2. Diodes
- 12.2.3. Rectifiers
- 12.2.4. Power ICs
- 12.3. Market Analysis, Insights and Forecast - by End-user Industry
- 12.3.1. Automotive
- 12.3.2. Consumer Electronics
- 12.3.3. Aerospace and Defense
- 12.3.4. Medical
- 12.3.5. Information Communication and Technology
- 12.3.6. Other End-user Industries
- 12.1. Market Analysis, Insights and Forecast - by Type
- 13. Latin America GaN Industry Analysis, Insights and Forecast, 2020-2032
- 13.1. Market Analysis, Insights and Forecast - by Type
- 13.1.1. Power Semiconductors
- 13.1.2. Opto-Semiconductors
- 13.1.3. RF Semiconductors
- 13.2. Market Analysis, Insights and Forecast - by Devices
- 13.2.1. Transistors
- 13.2.2. Diodes
- 13.2.3. Rectifiers
- 13.2.4. Power ICs
- 13.3. Market Analysis, Insights and Forecast - by End-user Industry
- 13.3.1. Automotive
- 13.3.2. Consumer Electronics
- 13.3.3. Aerospace and Defense
- 13.3.4. Medical
- 13.3.5. Information Communication and Technology
- 13.3.6. Other End-user Industries
- 13.1. Market Analysis, Insights and Forecast - by Type
- 14. Middle East and Africa GaN Industry Analysis, Insights and Forecast, 2020-2032
- 14.1. Market Analysis, Insights and Forecast - by Type
- 14.1.1. Power Semiconductors
- 14.1.2. Opto-Semiconductors
- 14.1.3. RF Semiconductors
- 14.2. Market Analysis, Insights and Forecast - by Devices
- 14.2.1. Transistors
- 14.2.2. Diodes
- 14.2.3. Rectifiers
- 14.2.4. Power ICs
- 14.3. Market Analysis, Insights and Forecast - by End-user Industry
- 14.3.1. Automotive
- 14.3.2. Consumer Electronics
- 14.3.3. Aerospace and Defense
- 14.3.4. Medical
- 14.3.5. Information Communication and Technology
- 14.3.6. Other End-user Industries
- 14.1. Market Analysis, Insights and Forecast - by Type
- 15. Competitive Analysis
- 15.1. Company Profiles
- 15.1.1 Efficient Power Conversion Corporation
- 15.1.1.1. Company Overview
- 15.1.1.2. Products
- 15.1.1.3. Company Financials
- 15.1.1.4. SWOT Analysis
- 15.1.2 Infineon Technologies AG
- 15.1.2.1. Company Overview
- 15.1.2.2. Products
- 15.1.2.3. Company Financials
- 15.1.2.4. SWOT Analysis
- 15.1.3 Microchip Technology Inc
- 15.1.3.1. Company Overview
- 15.1.3.2. Products
- 15.1.3.3. Company Financials
- 15.1.3.4. SWOT Analysis
- 15.1.4 GaN Systems
- 15.1.4.1. Company Overview
- 15.1.4.2. Products
- 15.1.4.3. Company Financials
- 15.1.4.4. SWOT Analysis
- 15.1.5 NexGen Power Systems
- 15.1.5.1. Company Overview
- 15.1.5.2. Products
- 15.1.5.3. Company Financials
- 15.1.5.4. SWOT Analysis
- 15.1.6 NXP Semiconductors
- 15.1.6.1. Company Overview
- 15.1.6.2. Products
- 15.1.6.3. Company Financials
- 15.1.6.4. SWOT Analysis
- 15.1.7 Wolfspeed Inc
- 15.1.7.1. Company Overview
- 15.1.7.2. Products
- 15.1.7.3. Company Financials
- 15.1.7.4. SWOT Analysis
- 15.1.8 Toshiba Electronic Devices & Storage Corporation
- 15.1.8.1. Company Overview
- 15.1.8.2. Products
- 15.1.8.3. Company Financials
- 15.1.8.4. SWOT Analysis
- 15.1.9 Soitec
- 15.1.9.1. Company Overview
- 15.1.9.2. Products
- 15.1.9.3. Company Financials
- 15.1.9.4. SWOT Analysis
- 15.1.10 Qorvo Inc
- 15.1.10.1. Company Overview
- 15.1.10.2. Products
- 15.1.10.3. Company Financials
- 15.1.10.4. SWOT Analysis
- 15.1.11 Texas Instruments Incorporated
- 15.1.11.1. Company Overview
- 15.1.11.2. Products
- 15.1.11.3. Company Financials
- 15.1.11.4. SWOT Analysis
- 15.1.12 NTT Advanced Technology Corporation*List Not Exhaustive
- 15.1.12.1. Company Overview
- 15.1.12.2. Products
- 15.1.12.3. Company Financials
- 15.1.12.4. SWOT Analysis
- 15.1.1 Efficient Power Conversion Corporation
- 15.2. Market Entropy
- 15.2.1 Company's Key Areas Served
- 15.2.2 Recent Developments
- 15.3. Company Market Share Analysis 2025
- 15.3.1 Top 5 Companies Market Share Analysis
- 15.3.2 Top 3 Companies Market Share Analysis
- 15.4. List of Potential Customers
- 16. Research Methodology
List of Figures
- Figure 1: Global GaN Industry Revenue Breakdown (Million, %) by Region 2025 & 2033
- Figure 2: United States GaN Industry Revenue (Million), by Type 2025 & 2033
- Figure 3: United States GaN Industry Revenue Share (%), by Type 2025 & 2033
- Figure 4: United States GaN Industry Revenue (Million), by Devices 2025 & 2033
- Figure 5: United States GaN Industry Revenue Share (%), by Devices 2025 & 2033
- Figure 6: United States GaN Industry Revenue (Million), by End-user Industry 2025 & 2033
- Figure 7: United States GaN Industry Revenue Share (%), by End-user Industry 2025 & 2033
- Figure 8: United States GaN Industry Revenue (Million), by Country 2025 & 2033
- Figure 9: United States GaN Industry Revenue Share (%), by Country 2025 & 2033
- Figure 10: Europe GaN Industry Revenue (Million), by Type 2025 & 2033
- Figure 11: Europe GaN Industry Revenue Share (%), by Type 2025 & 2033
- Figure 12: Europe GaN Industry Revenue (Million), by Devices 2025 & 2033
- Figure 13: Europe GaN Industry Revenue Share (%), by Devices 2025 & 2033
- Figure 14: Europe GaN Industry Revenue (Million), by End-user Industry 2025 & 2033
- Figure 15: Europe GaN Industry Revenue Share (%), by End-user Industry 2025 & 2033
- Figure 16: Europe GaN Industry Revenue (Million), by Country 2025 & 2033
- Figure 17: Europe GaN Industry Revenue Share (%), by Country 2025 & 2033
- Figure 18: Japan GaN Industry Revenue (Million), by Type 2025 & 2033
- Figure 19: Japan GaN Industry Revenue Share (%), by Type 2025 & 2033
- Figure 20: Japan GaN Industry Revenue (Million), by Devices 2025 & 2033
- Figure 21: Japan GaN Industry Revenue Share (%), by Devices 2025 & 2033
- Figure 22: Japan GaN Industry Revenue (Million), by End-user Industry 2025 & 2033
- Figure 23: Japan GaN Industry Revenue Share (%), by End-user Industry 2025 & 2033
- Figure 24: Japan GaN Industry Revenue (Million), by Country 2025 & 2033
- Figure 25: Japan GaN Industry Revenue Share (%), by Country 2025 & 2033
- Figure 26: China GaN Industry Revenue (Million), by Type 2025 & 2033
- Figure 27: China GaN Industry Revenue Share (%), by Type 2025 & 2033
- Figure 28: China GaN Industry Revenue (Million), by Devices 2025 & 2033
- Figure 29: China GaN Industry Revenue Share (%), by Devices 2025 & 2033
- Figure 30: China GaN Industry Revenue (Million), by End-user Industry 2025 & 2033
- Figure 31: China GaN Industry Revenue Share (%), by End-user Industry 2025 & 2033
- Figure 32: China GaN Industry Revenue (Million), by Country 2025 & 2033
- Figure 33: China GaN Industry Revenue Share (%), by Country 2025 & 2033
- Figure 34: Korea GaN Industry Revenue (Million), by Type 2025 & 2033
- Figure 35: Korea GaN Industry Revenue Share (%), by Type 2025 & 2033
- Figure 36: Korea GaN Industry Revenue (Million), by Devices 2025 & 2033
- Figure 37: Korea GaN Industry Revenue Share (%), by Devices 2025 & 2033
- Figure 38: Korea GaN Industry Revenue (Million), by End-user Industry 2025 & 2033
- Figure 39: Korea GaN Industry Revenue Share (%), by End-user Industry 2025 & 2033
- Figure 40: Korea GaN Industry Revenue (Million), by Country 2025 & 2033
- Figure 41: Korea GaN Industry Revenue Share (%), by Country 2025 & 2033
- Figure 42: Taiwan GaN Industry Revenue (Million), by Type 2025 & 2033
- Figure 43: Taiwan GaN Industry Revenue Share (%), by Type 2025 & 2033
- Figure 44: Taiwan GaN Industry Revenue (Million), by Devices 2025 & 2033
- Figure 45: Taiwan GaN Industry Revenue Share (%), by Devices 2025 & 2033
- Figure 46: Taiwan GaN Industry Revenue (Million), by End-user Industry 2025 & 2033
- Figure 47: Taiwan GaN Industry Revenue Share (%), by End-user Industry 2025 & 2033
- Figure 48: Taiwan GaN Industry Revenue (Million), by Country 2025 & 2033
- Figure 49: Taiwan GaN Industry Revenue Share (%), by Country 2025 & 2033
- Figure 50: Latin America GaN Industry Revenue (Million), by Type 2025 & 2033
- Figure 51: Latin America GaN Industry Revenue Share (%), by Type 2025 & 2033
- Figure 52: Latin America GaN Industry Revenue (Million), by Devices 2025 & 2033
- Figure 53: Latin America GaN Industry Revenue Share (%), by Devices 2025 & 2033
- Figure 54: Latin America GaN Industry Revenue (Million), by End-user Industry 2025 & 2033
- Figure 55: Latin America GaN Industry Revenue Share (%), by End-user Industry 2025 & 2033
- Figure 56: Latin America GaN Industry Revenue (Million), by Country 2025 & 2033
- Figure 57: Latin America GaN Industry Revenue Share (%), by Country 2025 & 2033
- Figure 58: Middle East and Africa GaN Industry Revenue (Million), by Type 2025 & 2033
- Figure 59: Middle East and Africa GaN Industry Revenue Share (%), by Type 2025 & 2033
- Figure 60: Middle East and Africa GaN Industry Revenue (Million), by Devices 2025 & 2033
- Figure 61: Middle East and Africa GaN Industry Revenue Share (%), by Devices 2025 & 2033
- Figure 62: Middle East and Africa GaN Industry Revenue (Million), by End-user Industry 2025 & 2033
- Figure 63: Middle East and Africa GaN Industry Revenue Share (%), by End-user Industry 2025 & 2033
- Figure 64: Middle East and Africa GaN Industry Revenue (Million), by Country 2025 & 2033
- Figure 65: Middle East and Africa GaN Industry Revenue Share (%), by Country 2025 & 2033
List of Tables
- Table 1: Global GaN Industry Revenue Million Forecast, by Type 2020 & 2033
- Table 2: Global GaN Industry Revenue Million Forecast, by Devices 2020 & 2033
- Table 3: Global GaN Industry Revenue Million Forecast, by End-user Industry 2020 & 2033
- Table 4: Global GaN Industry Revenue Million Forecast, by Region 2020 & 2033
- Table 5: Global GaN Industry Revenue Million Forecast, by Type 2020 & 2033
- Table 6: Global GaN Industry Revenue Million Forecast, by Devices 2020 & 2033
- Table 7: Global GaN Industry Revenue Million Forecast, by End-user Industry 2020 & 2033
- Table 8: Global GaN Industry Revenue Million Forecast, by Country 2020 & 2033
- Table 9: Global GaN Industry Revenue Million Forecast, by Type 2020 & 2033
- Table 10: Global GaN Industry Revenue Million Forecast, by Devices 2020 & 2033
- Table 11: Global GaN Industry Revenue Million Forecast, by End-user Industry 2020 & 2033
- Table 12: Global GaN Industry Revenue Million Forecast, by Country 2020 & 2033
- Table 13: Global GaN Industry Revenue Million Forecast, by Type 2020 & 2033
- Table 14: Global GaN Industry Revenue Million Forecast, by Devices 2020 & 2033
- Table 15: Global GaN Industry Revenue Million Forecast, by End-user Industry 2020 & 2033
- Table 16: Global GaN Industry Revenue Million Forecast, by Country 2020 & 2033
- Table 17: Global GaN Industry Revenue Million Forecast, by Type 2020 & 2033
- Table 18: Global GaN Industry Revenue Million Forecast, by Devices 2020 & 2033
- Table 19: Global GaN Industry Revenue Million Forecast, by End-user Industry 2020 & 2033
- Table 20: Global GaN Industry Revenue Million Forecast, by Country 2020 & 2033
- Table 21: Global GaN Industry Revenue Million Forecast, by Type 2020 & 2033
- Table 22: Global GaN Industry Revenue Million Forecast, by Devices 2020 & 2033
- Table 23: Global GaN Industry Revenue Million Forecast, by End-user Industry 2020 & 2033
- Table 24: Global GaN Industry Revenue Million Forecast, by Country 2020 & 2033
- Table 25: Global GaN Industry Revenue Million Forecast, by Type 2020 & 2033
- Table 26: Global GaN Industry Revenue Million Forecast, by Devices 2020 & 2033
- Table 27: Global GaN Industry Revenue Million Forecast, by End-user Industry 2020 & 2033
- Table 28: Global GaN Industry Revenue Million Forecast, by Country 2020 & 2033
- Table 29: Global GaN Industry Revenue Million Forecast, by Type 2020 & 2033
- Table 30: Global GaN Industry Revenue Million Forecast, by Devices 2020 & 2033
- Table 31: Global GaN Industry Revenue Million Forecast, by End-user Industry 2020 & 2033
- Table 32: Global GaN Industry Revenue Million Forecast, by Country 2020 & 2033
- Table 33: Global GaN Industry Revenue Million Forecast, by Type 2020 & 2033
- Table 34: Global GaN Industry Revenue Million Forecast, by Devices 2020 & 2033
- Table 35: Global GaN Industry Revenue Million Forecast, by End-user Industry 2020 & 2033
- Table 36: Global GaN Industry Revenue Million Forecast, by Country 2020 & 2033
Frequently Asked Questions
1. What is the projected Compound Annual Growth Rate (CAGR) of the GaN Industry?
The projected CAGR is approximately 6.06%.
2. Which companies are prominent players in the GaN Industry?
Key companies in the market include Efficient Power Conversion Corporation, Infineon Technologies AG, Microchip Technology Inc, GaN Systems, NexGen Power Systems, NXP Semiconductors, Wolfspeed Inc, Toshiba Electronic Devices & Storage Corporation, Soitec, Qorvo Inc, Texas Instruments Incorporated, NTT Advanced Technology Corporation*List Not Exhaustive.
3. What are the main segments of the GaN Industry?
The market segments include Type, Devices, End-user Industry.
4. Can you provide details about the market size?
The market size is estimated to be USD 21.18 Million as of 2022.
5. What are some drivers contributing to market growth?
Strong Demand from Telecom Infrastructure Segment Driven by Advancements in 5G Implementation; Favorable Attributes Such As High-performance and Small Form Factor to Drive Adoption in the Military Segment.
6. What are the notable trends driving market growth?
Consumer Electronics to Hold Significant Market Share.
7. Are there any restraints impacting market growth?
; Declining Volume of Traditional Mails; High Adoption Costs.
8. Can you provide examples of recent developments in the market?
Jan 2024: Silvaco Group, Inc., a leading provider of TCAD, EDA software, and design IP, partnered with GaN Valley to drive advancements in efficient gallium nitride (GaN) power device design. By leveraging its Victory TCAD platform, Silvaco aims to empower customers to innovate and optimize performance in GaN-based semiconductor power devices. The Victory TCAD platform offers a comprehensive simulation environment, incorporating diverse numerical methods, physical models, SPICE model generation, and a user-friendly graphical interface, tailored specifically for the latest generation of GaN-based power devices.
9. What pricing options are available for accessing the report?
Pricing options include single-user, multi-user, and enterprise licenses priced at USD 4750, USD 5250, and USD 8750 respectively.
10. Is the market size provided in terms of value or volume?
The market size is provided in terms of value, measured in Million.
11. Are there any specific market keywords associated with the report?
Yes, the market keyword associated with the report is "GaN Industry," which aids in identifying and referencing the specific market segment covered.
12. How do I determine which pricing option suits my needs best?
The pricing options vary based on user requirements and access needs. Individual users may opt for single-user licenses, while businesses requiring broader access may choose multi-user or enterprise licenses for cost-effective access to the report.
13. Are there any additional resources or data provided in the GaN Industry report?
While the report offers comprehensive insights, it's advisable to review the specific contents or supplementary materials provided to ascertain if additional resources or data are available.
14. How can I stay updated on further developments or reports in the GaN Industry?
To stay informed about further developments, trends, and reports in the GaN Industry, consider subscribing to industry newsletters, following relevant companies and organizations, or regularly checking reputable industry news sources and publications.
Methodology
Step 1 - Identification of Relevant Samples Size from Population Database


Step 2 - Approaches for Defining Global Market Size (Value, Volume* & Price*)

Note*: In applicable scenarios
Step 3 - Data Sources
Primary Research
- Web Analytics
- Survey Reports
- Research Institute
- Latest Research Reports
- Opinion Leaders
Secondary Research
- Annual Reports
- White Paper
- Latest Press Release
- Industry Association
- Paid Database
- Investor Presentations

Step 4 - Data Triangulation
Involves using different sources of information in order to increase the validity of a study
These sources are likely to be stakeholders in a program - participants, other researchers, program staff, other community members, and so on.
Then we put all data in single framework & apply various statistical tools to find out the dynamic on the market.
During the analysis stage, feedback from the stakeholder groups would be compared to determine areas of agreement as well as areas of divergence