

Key Insights
The Gallium Nitride (GaN) RF semiconductor devices market is experiencing substantial expansion, driven by increasing demand across critical industries. The market, valued at $2.53 billion in 2025, is projected to achieve a Compound Annual Growth Rate (CAGR) of 18.5%. This significant growth is attributed to GaN's superior performance characteristics, including higher efficiency, enhanced power density, and compact form factors, which outperform traditional silicon-based solutions. These advantages are particularly valuable in high-frequency, high-power applications such as 5G infrastructure, advanced radar systems, and critical power amplifiers for defense and aerospace. The accelerating global deployment of 5G networks is a primary catalyst, necessitating more efficient and high-performance RF components. Furthermore, the growing integration of GaN into consumer electronics, including smartphones and high-speed internet devices, alongside its adoption in electric vehicles and advanced driver-assistance systems (ADAS) within the automotive sector, are significant growth contributors.
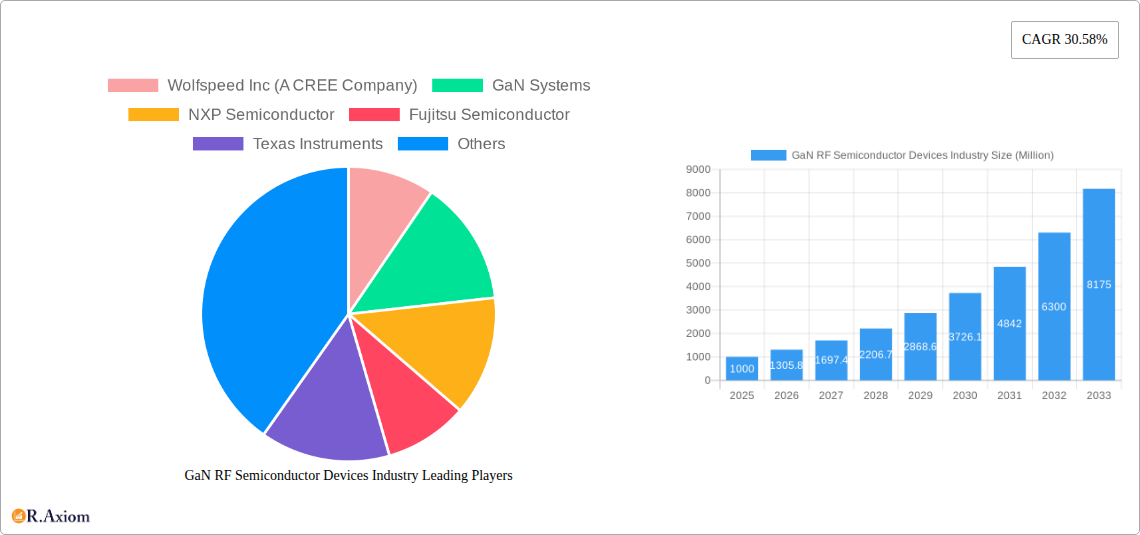
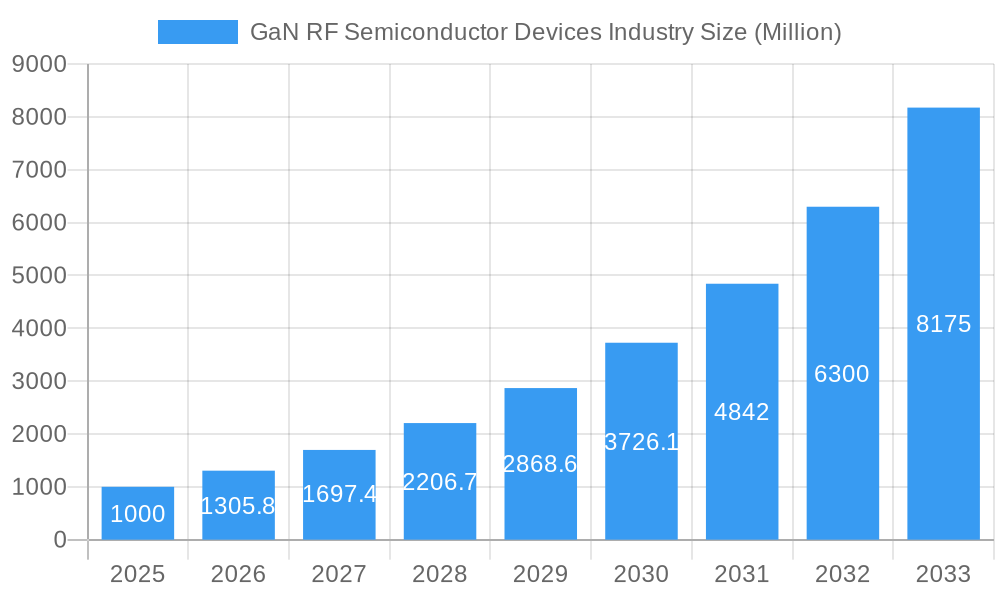
GaN RF Semiconductor Devices Industry Market Size (In Billion)
Market segmentation highlights diverse opportunities across key application segments. The defense and aerospace sector is expected to maintain a leading position due to the demanding performance requirements of military and aviation technologies. Concurrently, the telecommunications sector is poised for considerable growth, fueled by the ongoing 5G rollout and anticipation of future 6G development. The automotive and industrial sectors also present substantial potential, particularly with the increasing adoption of GaN in electric vehicle charging infrastructure and industrial automation systems. While challenges such as high manufacturing costs and skilled labor shortages exist, continuous technological advancements and expanding economies of scale are progressively addressing these constraints. Geographically, North America and Asia-Pacific are anticipated to retain market strength, with Europe demonstrating steady growth. Leading market participants, including Wolfspeed, GaN Systems, and NXP, are strategically focusing on innovation and market penetration to capitalize on this burgeoning market.
GaN RF Semiconductor Devices Industry Company Market Share
GaN RF Semiconductor Devices Industry: A Comprehensive Market Report (2019-2033)
This in-depth report provides a comprehensive analysis of the GaN RF Semiconductor Devices market, offering invaluable insights for industry stakeholders, investors, and researchers. Covering the period from 2019 to 2033, with 2025 as the base year, this report meticulously examines market dynamics, technological advancements, and competitive landscapes to provide a clear understanding of future growth trajectories. The report leverages data-driven analysis to present actionable intelligence, enabling informed decision-making.
GaN RF Semiconductor Devices Industry Market Concentration & Innovation
This section analyzes the market concentration, highlighting key players like Wolfspeed Inc (A CREE Company), GaN Systems, NXP Semiconductor, Fujitsu Semiconductor, Texas Instruments, Broadcom Inc, NTT Advanced Technology, Qorvo Inc, and Efficient Power Conversion. We assess their respective market shares (exact figures unavailable, estimated at xx% for NXP, xx% for Wolfspeed, and the remaining market share distributed among other players) and explore the impact of mergers and acquisitions (M&A) activities on market consolidation. The report further examines innovation drivers, including advancements in GaN technology, increasing demand for higher efficiency and power density devices, and stringent regulatory frameworks pushing for energy-efficient solutions. The analysis includes an assessment of product substitutes and their impact, along with a deep dive into evolving end-user trends and their influence on market demand. The total value of M&A deals in the GaN RF semiconductor devices industry during the study period is estimated to be around $XX Million. Key factors driving M&A activity include the consolidation of the market, access to technology, and expansion into new markets.
- Market Concentration: Moderately concentrated, with a few dominant players.
- Innovation Drivers: Advancements in GaN technology, demand for higher efficiency, regulatory pressure.
- M&A Activity: Significant activity observed, driving market consolidation (estimated value: $XX Million).
GaN RF Semiconductor Devices Industry Industry Trends & Insights
This section delves into the core trends shaping the GaN RF Semiconductor Devices market. The Compound Annual Growth Rate (CAGR) for the forecast period (2025-2033) is estimated at xx%. Market penetration of GaN RF devices is expected to increase significantly, driven by factors such as the growing adoption of 5G technology, the increasing demand for high-power and high-frequency applications, and the ongoing miniaturization of electronic devices. The report explores technological disruptions, including the emergence of new materials and fabrication techniques that enhance device performance. Consumer preferences for smaller, faster, and more energy-efficient devices are also analyzed, alongside a detailed examination of competitive dynamics, including pricing strategies, product differentiation, and market share battles among key players. The impact of global economic conditions and supply chain disruptions is also considered.
Dominant Markets & Segments in GaN RF Semiconductor Devices Industry
The report identifies the dominant market segments within the GaN RF Semiconductor Devices industry. While precise market share data requires further investigation, the Telecom segment is projected to be the largest market segment due to the high demand for 5G infrastructure.
- Telecom: High growth driven by 5G rollout and increasing data demand. Key drivers include the expanding global 5G network infrastructure and the increasing demand for higher data rates.
- Defense and Aerospace: Steady growth, driven by the need for high-power, reliable devices in military applications. This segment benefits from government investment in defense modernization and aerospace technologies.
- Automotive: Moderate growth driven by the adoption of advanced driver-assistance systems (ADAS) and electric vehicles (EVs). Key drivers include the rising demand for more efficient power management in automotive applications.
- Consumer Electronics: Moderate growth driven by the increasing demand for high-performance consumer electronics, such as smartphones and high-speed internet connectivity devices. Miniaturization and higher energy efficiency are key factors driving the market in this segment.
- Industrial: Growing at a steady pace, driven by the industrial automation and smart factories.
- Other Applications (Data Centers, Renewable Energy, etc.): This sector shows promising growth potential due to the need for high-efficiency power conversion in data centers and renewable energy systems. Key drivers include the increasing need for energy-efficient power solutions in data centers and the growth of renewable energy sources.
The North American region is currently estimated to hold the largest market share, primarily fueled by significant investments in 5G infrastructure and a strong presence of key GaN technology developers and manufacturers. However, the Asia-Pacific region is predicted to experience the fastest growth rate in the forecast period, driven by the rapid expansion of the consumer electronics and telecom sectors.
GaN RF Semiconductor Devices Industry Product Developments
Recent product innovations focus on enhancing power efficiency, increasing operating frequency, and improving thermal management. Companies are competing by offering devices with higher power output, better linearity, and improved reliability. The trend towards smaller, more integrated devices is a significant factor in driving product development, enabling higher levels of integration and system miniaturization. These advancements directly translate to better market fit, enabling wider adoption across various applications.
Report Scope & Segmentation Analysis
The report segments the GaN RF Semiconductor Devices market by application: Defense and Aerospace, Telecom, Consumer Electronics, Automotive, Industrial, and Other Applications (Data Centers, Renewable Energy, etc.). Each segment's growth projections, market size (values expressed in Millions of USD), and competitive dynamics are detailed within the full report. Growth is primarily driven by advancements in technology and increased demand across various application sectors. Specific details on market size and growth projections are provided within the complete report.
Key Drivers of GaN RF Semiconductor Devices Industry Growth
The market's growth is primarily driven by the increasing demand for higher efficiency and power density in various applications, particularly in the 5G infrastructure and electric vehicle sectors. Technological advancements such as improved GaN material properties, enhanced fabrication techniques, and innovative packaging solutions are also driving market growth. Government initiatives aimed at promoting energy-efficient technologies and supportive regulatory frameworks further stimulate market expansion.
Challenges in the GaN RF Semiconductor Devices Industry Sector
The GaN RF Semiconductor Devices industry faces challenges such as high manufacturing costs, limitations in high-volume production capacity, and the availability of skilled labor. Competition from other semiconductor technologies and the cyclical nature of the electronics industry also pose significant threats. Supply chain disruptions and geopolitical uncertainties can further impact the industry's growth trajectory, creating uncertainty in demand and causing price fluctuations. These factors can significantly impede market expansion and limit profitability for industry players.
Emerging Opportunities in GaN RF Semiconductor Devices Industry
Emerging opportunities lie in expanding into new markets such as renewable energy, data centers, and industrial automation, where high-efficiency power solutions are highly sought after. The development of new GaN-based technologies, such as monolithic microwave integrated circuits (MMICs) and power amplifiers, offers lucrative opportunities for innovation. Growing consumer demand for high-performance electronics in emerging economies further expands the market potential.
Leading Players in the GaN RF Semiconductor Devices Industry Market
Key Developments in GaN RF Semiconductor Devices Industry Industry
- September 2020: NXP Semiconductor N.V. announced the opening of its 150 mm (6-inch) RF Gallium Nitride (GaN) fab in Chandler, Arizona. This significantly enhanced NXP's manufacturing capacity and strengthened its position in the 5G RF power amplifier market.
Strategic Outlook for GaN RF Semiconductor Devices Industry Market
The GaN RF Semiconductor Devices market is poised for significant growth driven by technological advancements, expanding applications, and increasing demand across various sectors. The ongoing development of higher-performance GaN devices, coupled with the increasing adoption of 5G and other advanced communication technologies, will further fuel market expansion. Strategic partnerships and investments in research and development will play a key role in shaping the future of this dynamic industry.
GaN RF Semiconductor Devices Industry Segmentation
-
1. Application
- 1.1. Defense and Aerospace
- 1.2. Telecom
- 1.3. Consumer Electronics
- 1.4. Automotive
- 1.5. Industrial
- 1.6. Other
GaN RF Semiconductor Devices Industry Segmentation By Geography
- 1. North America
- 2. Europe
- 3. Asia Pacific
- 4. Latin America
- 5. Middle East and Africa
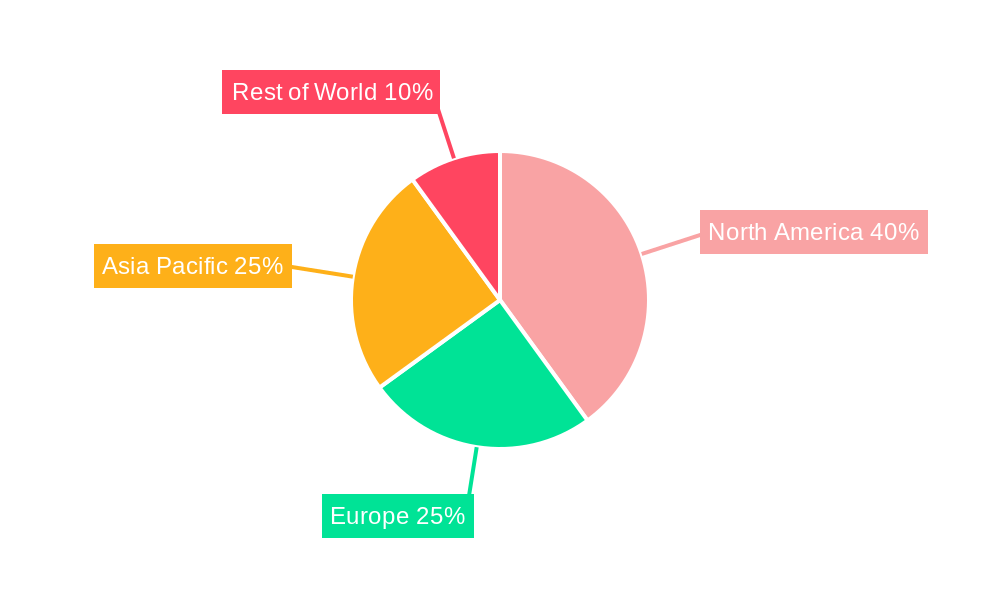
GaN RF Semiconductor Devices Industry Regional Market Share
Geographic Coverage of GaN RF Semiconductor Devices Industry
GaN RF Semiconductor Devices Industry REPORT HIGHLIGHTS
| Aspects | Details |
|---|---|
| Study Period | 2020-2034 |
| Base Year | 2025 |
| Estimated Year | 2026 |
| Forecast Period | 2026-2034 |
| Historical Period | 2020-2025 |
| Growth Rate | CAGR of 18.5% from 2020-2034 |
| Segmentation |
|
Table of Contents
- 1. Introduction
- 1.1. Research Scope
- 1.2. Market Segmentation
- 1.3. Research Objective
- 1.4. Definitions and Assumptions
- 2. Executive Summary
- 2.1. Market Snapshot
- 3. Market Dynamics
- 3.1. Market Drivers
- 3.2. Market Restrains
- 3.3. Market Trends
- 3.4. Market Opportunities
- 4. Market Factor Analysis
- 4.1. Porters Five Forces
- 4.1.1. Bargaining Power of Suppliers
- 4.1.2. Bargaining Power of Buyers
- 4.1.3. Threat of New Entrants
- 4.1.4. Threat of Substitutes
- 4.1.5. Competitive Rivalry
- 4.2. PESTEL analysis
- 4.3. BCG Analysis
- 4.3.1. Stars (High Growth, High Market Share)
- 4.3.2. Cash Cows (Low Growth, High Market Share)
- 4.3.3. Question Mark (High Growth, Low Market Share)
- 4.3.4. Dogs (Low Growth, Low Market Share)
- 4.4. Ansoff Matrix Analysis
- 4.5. Supply Chain Analysis
- 4.6. Regulatory Landscape
- 4.7. Current Market Potential and Opportunity Assessment (TAM–SAM–SOM Framework)
- 4.8. RAX Analyst Note
- 4.1. Porters Five Forces
- 5. Market Analysis, Insights and Forecast 2021-2033
- 5.1. Market Analysis, Insights and Forecast - by Application
- 5.1.1. Defense and Aerospace
- 5.1.2. Telecom
- 5.1.3. Consumer Electronics
- 5.1.4. Automotive
- 5.1.5. Industrial
- 5.1.6. Other
- 5.2. Market Analysis, Insights and Forecast - by Region
- 5.2.1. North America
- 5.2.2. Europe
- 5.2.3. Asia Pacific
- 5.2.4. Latin America
- 5.2.5. Middle East and Africa
- 5.1. Market Analysis, Insights and Forecast - by Application
- 6. Global GaN RF Semiconductor Devices Industry Analysis, Insights and Forecast, 2021-2033
- 6.1. Market Analysis, Insights and Forecast - by Application
- 6.1.1. Defense and Aerospace
- 6.1.2. Telecom
- 6.1.3. Consumer Electronics
- 6.1.4. Automotive
- 6.1.5. Industrial
- 6.1.6. Other
- 6.1. Market Analysis, Insights and Forecast - by Application
- 7. North America GaN RF Semiconductor Devices Industry Analysis, Insights and Forecast, 2020-2032
- 7.1. Market Analysis, Insights and Forecast - by Application
- 7.1.1. Defense and Aerospace
- 7.1.2. Telecom
- 7.1.3. Consumer Electronics
- 7.1.4. Automotive
- 7.1.5. Industrial
- 7.1.6. Other
- 7.1. Market Analysis, Insights and Forecast - by Application
- 8. Europe GaN RF Semiconductor Devices Industry Analysis, Insights and Forecast, 2020-2032
- 8.1. Market Analysis, Insights and Forecast - by Application
- 8.1.1. Defense and Aerospace
- 8.1.2. Telecom
- 8.1.3. Consumer Electronics
- 8.1.4. Automotive
- 8.1.5. Industrial
- 8.1.6. Other
- 8.1. Market Analysis, Insights and Forecast - by Application
- 9. Asia Pacific GaN RF Semiconductor Devices Industry Analysis, Insights and Forecast, 2020-2032
- 9.1. Market Analysis, Insights and Forecast - by Application
- 9.1.1. Defense and Aerospace
- 9.1.2. Telecom
- 9.1.3. Consumer Electronics
- 9.1.4. Automotive
- 9.1.5. Industrial
- 9.1.6. Other
- 9.1. Market Analysis, Insights and Forecast - by Application
- 10. Latin America GaN RF Semiconductor Devices Industry Analysis, Insights and Forecast, 2020-2032
- 10.1. Market Analysis, Insights and Forecast - by Application
- 10.1.1. Defense and Aerospace
- 10.1.2. Telecom
- 10.1.3. Consumer Electronics
- 10.1.4. Automotive
- 10.1.5. Industrial
- 10.1.6. Other
- 10.1. Market Analysis, Insights and Forecast - by Application
- 11. Middle East and Africa GaN RF Semiconductor Devices Industry Analysis, Insights and Forecast, 2020-2032
- 11.1. Market Analysis, Insights and Forecast - by Application
- 11.1.1. Defense and Aerospace
- 11.1.2. Telecom
- 11.1.3. Consumer Electronics
- 11.1.4. Automotive
- 11.1.5. Industrial
- 11.1.6. Other
- 11.1. Market Analysis, Insights and Forecast - by Application
- 12. Competitive Analysis
- 12.1. Company Profiles
- 12.1.1 Wolfspeed Inc (A CREE Company)
- 12.1.1.1. Company Overview
- 12.1.1.2. Products
- 12.1.1.3. Company Financials
- 12.1.1.4. SWOT Analysis
- 12.1.2 GaN Systems
- 12.1.2.1. Company Overview
- 12.1.2.2. Products
- 12.1.2.3. Company Financials
- 12.1.2.4. SWOT Analysis
- 12.1.3 NXP Semiconductor
- 12.1.3.1. Company Overview
- 12.1.3.2. Products
- 12.1.3.3. Company Financials
- 12.1.3.4. SWOT Analysis
- 12.1.4 Fujitsu Semiconductor
- 12.1.4.1. Company Overview
- 12.1.4.2. Products
- 12.1.4.3. Company Financials
- 12.1.4.4. SWOT Analysis
- 12.1.5 Texas Instruments
- 12.1.5.1. Company Overview
- 12.1.5.2. Products
- 12.1.5.3. Company Financials
- 12.1.5.4. SWOT Analysis
- 12.1.6 Broadcom Inc
- 12.1.6.1. Company Overview
- 12.1.6.2. Products
- 12.1.6.3. Company Financials
- 12.1.6.4. SWOT Analysis
- 12.1.7 NTT Advanced Technology
- 12.1.7.1. Company Overview
- 12.1.7.2. Products
- 12.1.7.3. Company Financials
- 12.1.7.4. SWOT Analysis
- 12.1.8 Qorvo Inc
- 12.1.8.1. Company Overview
- 12.1.8.2. Products
- 12.1.8.3. Company Financials
- 12.1.8.4. SWOT Analysis
- 12.1.9 Efficient Power Conversion
- 12.1.9.1. Company Overview
- 12.1.9.2. Products
- 12.1.9.3. Company Financials
- 12.1.9.4. SWOT Analysis
- 12.1.1 Wolfspeed Inc (A CREE Company)
- 12.2. Market Entropy
- 12.2.1 Company's Key Areas Served
- 12.2.2 Recent Developments
- 12.3. Company Market Share Analysis 2025
- 12.3.1 Top 5 Companies Market Share Analysis
- 12.3.2 Top 3 Companies Market Share Analysis
- 12.4. List of Potential Customers
- 13. Research Methodology
List of Figures
- Figure 1: Global GaN RF Semiconductor Devices Industry Revenue Breakdown (billion, %) by Region 2025 & 2033
- Figure 2: Global GaN RF Semiconductor Devices Industry Volume Breakdown (K Unit, %) by Region 2025 & 2033
- Figure 3: North America GaN RF Semiconductor Devices Industry Revenue (billion), by Application 2025 & 2033
- Figure 4: North America GaN RF Semiconductor Devices Industry Volume (K Unit), by Application 2025 & 2033
- Figure 5: North America GaN RF Semiconductor Devices Industry Revenue Share (%), by Application 2025 & 2033
- Figure 6: North America GaN RF Semiconductor Devices Industry Volume Share (%), by Application 2025 & 2033
- Figure 7: North America GaN RF Semiconductor Devices Industry Revenue (billion), by Country 2025 & 2033
- Figure 8: North America GaN RF Semiconductor Devices Industry Volume (K Unit), by Country 2025 & 2033
- Figure 9: North America GaN RF Semiconductor Devices Industry Revenue Share (%), by Country 2025 & 2033
- Figure 10: North America GaN RF Semiconductor Devices Industry Volume Share (%), by Country 2025 & 2033
- Figure 11: Europe GaN RF Semiconductor Devices Industry Revenue (billion), by Application 2025 & 2033
- Figure 12: Europe GaN RF Semiconductor Devices Industry Volume (K Unit), by Application 2025 & 2033
- Figure 13: Europe GaN RF Semiconductor Devices Industry Revenue Share (%), by Application 2025 & 2033
- Figure 14: Europe GaN RF Semiconductor Devices Industry Volume Share (%), by Application 2025 & 2033
- Figure 15: Europe GaN RF Semiconductor Devices Industry Revenue (billion), by Country 2025 & 2033
- Figure 16: Europe GaN RF Semiconductor Devices Industry Volume (K Unit), by Country 2025 & 2033
- Figure 17: Europe GaN RF Semiconductor Devices Industry Revenue Share (%), by Country 2025 & 2033
- Figure 18: Europe GaN RF Semiconductor Devices Industry Volume Share (%), by Country 2025 & 2033
- Figure 19: Asia Pacific GaN RF Semiconductor Devices Industry Revenue (billion), by Application 2025 & 2033
- Figure 20: Asia Pacific GaN RF Semiconductor Devices Industry Volume (K Unit), by Application 2025 & 2033
- Figure 21: Asia Pacific GaN RF Semiconductor Devices Industry Revenue Share (%), by Application 2025 & 2033
- Figure 22: Asia Pacific GaN RF Semiconductor Devices Industry Volume Share (%), by Application 2025 & 2033
- Figure 23: Asia Pacific GaN RF Semiconductor Devices Industry Revenue (billion), by Country 2025 & 2033
- Figure 24: Asia Pacific GaN RF Semiconductor Devices Industry Volume (K Unit), by Country 2025 & 2033
- Figure 25: Asia Pacific GaN RF Semiconductor Devices Industry Revenue Share (%), by Country 2025 & 2033
- Figure 26: Asia Pacific GaN RF Semiconductor Devices Industry Volume Share (%), by Country 2025 & 2033
- Figure 27: Latin America GaN RF Semiconductor Devices Industry Revenue (billion), by Application 2025 & 2033
- Figure 28: Latin America GaN RF Semiconductor Devices Industry Volume (K Unit), by Application 2025 & 2033
- Figure 29: Latin America GaN RF Semiconductor Devices Industry Revenue Share (%), by Application 2025 & 2033
- Figure 30: Latin America GaN RF Semiconductor Devices Industry Volume Share (%), by Application 2025 & 2033
- Figure 31: Latin America GaN RF Semiconductor Devices Industry Revenue (billion), by Country 2025 & 2033
- Figure 32: Latin America GaN RF Semiconductor Devices Industry Volume (K Unit), by Country 2025 & 2033
- Figure 33: Latin America GaN RF Semiconductor Devices Industry Revenue Share (%), by Country 2025 & 2033
- Figure 34: Latin America GaN RF Semiconductor Devices Industry Volume Share (%), by Country 2025 & 2033
- Figure 35: Middle East and Africa GaN RF Semiconductor Devices Industry Revenue (billion), by Application 2025 & 2033
- Figure 36: Middle East and Africa GaN RF Semiconductor Devices Industry Volume (K Unit), by Application 2025 & 2033
- Figure 37: Middle East and Africa GaN RF Semiconductor Devices Industry Revenue Share (%), by Application 2025 & 2033
- Figure 38: Middle East and Africa GaN RF Semiconductor Devices Industry Volume Share (%), by Application 2025 & 2033
- Figure 39: Middle East and Africa GaN RF Semiconductor Devices Industry Revenue (billion), by Country 2025 & 2033
- Figure 40: Middle East and Africa GaN RF Semiconductor Devices Industry Volume (K Unit), by Country 2025 & 2033
- Figure 41: Middle East and Africa GaN RF Semiconductor Devices Industry Revenue Share (%), by Country 2025 & 2033
- Figure 42: Middle East and Africa GaN RF Semiconductor Devices Industry Volume Share (%), by Country 2025 & 2033
List of Tables
- Table 1: Global GaN RF Semiconductor Devices Industry Revenue billion Forecast, by Application 2020 & 2033
- Table 2: Global GaN RF Semiconductor Devices Industry Volume K Unit Forecast, by Application 2020 & 2033
- Table 3: Global GaN RF Semiconductor Devices Industry Revenue billion Forecast, by Region 2020 & 2033
- Table 4: Global GaN RF Semiconductor Devices Industry Volume K Unit Forecast, by Region 2020 & 2033
- Table 5: Global GaN RF Semiconductor Devices Industry Revenue billion Forecast, by Application 2020 & 2033
- Table 6: Global GaN RF Semiconductor Devices Industry Volume K Unit Forecast, by Application 2020 & 2033
- Table 7: Global GaN RF Semiconductor Devices Industry Revenue billion Forecast, by Country 2020 & 2033
- Table 8: Global GaN RF Semiconductor Devices Industry Volume K Unit Forecast, by Country 2020 & 2033
- Table 9: Global GaN RF Semiconductor Devices Industry Revenue billion Forecast, by Application 2020 & 2033
- Table 10: Global GaN RF Semiconductor Devices Industry Volume K Unit Forecast, by Application 2020 & 2033
- Table 11: Global GaN RF Semiconductor Devices Industry Revenue billion Forecast, by Country 2020 & 2033
- Table 12: Global GaN RF Semiconductor Devices Industry Volume K Unit Forecast, by Country 2020 & 2033
- Table 13: Global GaN RF Semiconductor Devices Industry Revenue billion Forecast, by Application 2020 & 2033
- Table 14: Global GaN RF Semiconductor Devices Industry Volume K Unit Forecast, by Application 2020 & 2033
- Table 15: Global GaN RF Semiconductor Devices Industry Revenue billion Forecast, by Country 2020 & 2033
- Table 16: Global GaN RF Semiconductor Devices Industry Volume K Unit Forecast, by Country 2020 & 2033
- Table 17: Global GaN RF Semiconductor Devices Industry Revenue billion Forecast, by Application 2020 & 2033
- Table 18: Global GaN RF Semiconductor Devices Industry Volume K Unit Forecast, by Application 2020 & 2033
- Table 19: Global GaN RF Semiconductor Devices Industry Revenue billion Forecast, by Country 2020 & 2033
- Table 20: Global GaN RF Semiconductor Devices Industry Volume K Unit Forecast, by Country 2020 & 2033
- Table 21: Global GaN RF Semiconductor Devices Industry Revenue billion Forecast, by Application 2020 & 2033
- Table 22: Global GaN RF Semiconductor Devices Industry Volume K Unit Forecast, by Application 2020 & 2033
- Table 23: Global GaN RF Semiconductor Devices Industry Revenue billion Forecast, by Country 2020 & 2033
- Table 24: Global GaN RF Semiconductor Devices Industry Volume K Unit Forecast, by Country 2020 & 2033
Frequently Asked Questions
1. What is the projected Compound Annual Growth Rate (CAGR) of the GaN RF Semiconductor Devices Industry?
The projected CAGR is approximately 18.5%.
2. Which companies are prominent players in the GaN RF Semiconductor Devices Industry?
Key companies in the market include Wolfspeed Inc (A CREE Company), GaN Systems, NXP Semiconductor, Fujitsu Semiconductor, Texas Instruments, Broadcom Inc, NTT Advanced Technology, Qorvo Inc, Efficient Power Conversion.
3. What are the main segments of the GaN RF Semiconductor Devices Industry?
The market segments include Application.
4. Can you provide details about the market size?
The market size is estimated to be USD 2.53 billion as of 2022.
5. What are some drivers contributing to market growth?
Proliferation of Long Term Evolution Wireless Networks.
6. What are the notable trends driving market growth?
Proliferation of Long Term Evolution Wireless Networks to Drive the Market Growth.
7. Are there any restraints impacting market growth?
Competition from SiC.
8. Can you provide examples of recent developments in the market?
September 2020 - NXP Semiconductor N.V. announced the opening of its 150 mm (6-inch) RF Gallium Nitride (GaN) fab in Chandler, Arizona, the most advanced fab dedicated to 5G RF power amplifiers in the United States. The new internal factory combines NXP's expertise as the industry leader in RF power and its high-volume manufacturing know-how, resulting in streamlined innovation that supports the expansion of 5G base stations and advanced communication infrastructure in the industrial, aerospace, and defense markets.
9. What pricing options are available for accessing the report?
Pricing options include single-user, multi-user, and enterprise licenses priced at USD 4750, USD 5250, and USD 8750 respectively.
10. Is the market size provided in terms of value or volume?
The market size is provided in terms of value, measured in billion and volume, measured in K Unit.
11. Are there any specific market keywords associated with the report?
Yes, the market keyword associated with the report is "GaN RF Semiconductor Devices Industry," which aids in identifying and referencing the specific market segment covered.
12. How do I determine which pricing option suits my needs best?
The pricing options vary based on user requirements and access needs. Individual users may opt for single-user licenses, while businesses requiring broader access may choose multi-user or enterprise licenses for cost-effective access to the report.
13. Are there any additional resources or data provided in the GaN RF Semiconductor Devices Industry report?
While the report offers comprehensive insights, it's advisable to review the specific contents or supplementary materials provided to ascertain if additional resources or data are available.
14. How can I stay updated on further developments or reports in the GaN RF Semiconductor Devices Industry?
To stay informed about further developments, trends, and reports in the GaN RF Semiconductor Devices Industry, consider subscribing to industry newsletters, following relevant companies and organizations, or regularly checking reputable industry news sources and publications.
Methodology
Step 1 - Identification of Relevant Samples Size from Population Database


Step 2 - Approaches for Defining Global Market Size (Value, Volume* & Price*)

Note*: In applicable scenarios
Step 3 - Data Sources
Primary Research
- Web Analytics
- Survey Reports
- Research Institute
- Latest Research Reports
- Opinion Leaders
Secondary Research
- Annual Reports
- White Paper
- Latest Press Release
- Industry Association
- Paid Database
- Investor Presentations

Step 4 - Data Triangulation
Involves using different sources of information in order to increase the validity of a study
These sources are likely to be stakeholders in a program - participants, other researchers, program staff, other community members, and so on.
Then we put all data in single framework & apply various statistical tools to find out the dynamic on the market.
During the analysis stage, feedback from the stakeholder groups would be compared to determine areas of agreement as well as areas of divergence