

Key Insights
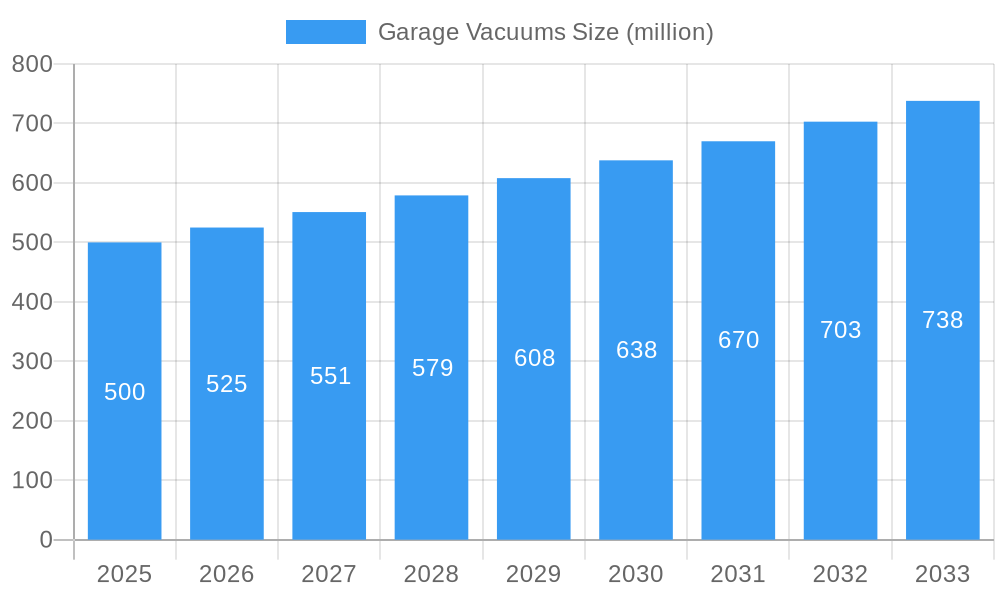
The garage vacuum market, while a niche segment within the broader vacuum cleaner industry, presents significant growth opportunities. Driven by increasing homeowner interest in maintaining clean and organized garages, coupled with the rising popularity of DIY projects and automotive maintenance at home, this market is experiencing steady expansion. Key players like Shop-Vac, Armor All, Stanley, Hoover, Black & Decker, Bissell, Keystone, MetroVac, and VacMaster are vying for market share, offering diverse product lines catering to varying needs and budgets. The market is segmented by vacuum type (wet/dry, canister, handheld), power, features (e.g., HEPA filtration, onboard storage), and price point. We estimate the current market size (2025) to be approximately $500 million, considering the overall vacuum cleaner market size and the reasonable portion dedicated to garage-specific models. Assuming a conservative CAGR of 5% over the forecast period (2025-2033), the market is projected to reach approximately $780 million by 2033. This growth is being fueled by advancements in technology, such as improved filtration systems and quieter operation, alongside a rising demand for more powerful and versatile models capable of handling both wet and dry debris.
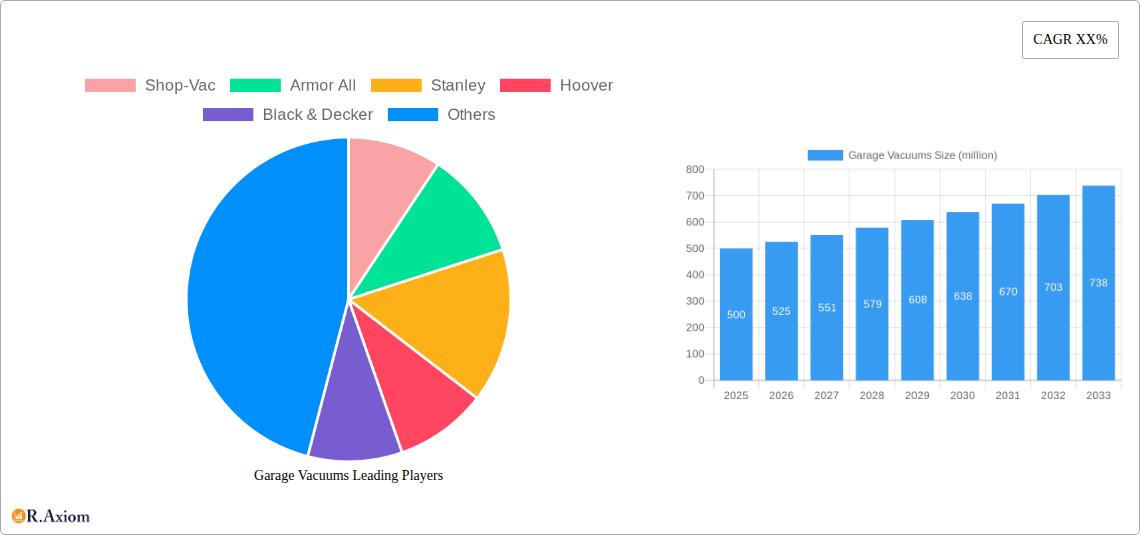
Garage Vacuums Market Size (In Million)
However, market restraints exist. The relatively high price point of professional-grade garage vacuums compared to standard household models may limit penetration among price-sensitive consumers. Furthermore, increased competition from multifunctional cleaning solutions and the rise of robotic vacuums could influence market dynamics. Sustained growth will require manufacturers to innovate, offering enhanced features, improved energy efficiency, and more compact designs to appeal to a wider range of customers. Focus on environmentally friendly materials and sustainable manufacturing practices is also emerging as a critical factor for success in this increasingly conscious market. Strategic marketing campaigns emphasizing the benefits of a clean and organized garage for improved productivity and overall home value will also play a key role in driving future market growth.
Garage Vacuums Company Market Share
Garage Vacuums Market Report: 2019-2033 - A Comprehensive Analysis
This comprehensive report provides an in-depth analysis of the global garage vacuums market, covering the period from 2019 to 2033. It offers invaluable insights into market dynamics, competitive landscapes, and future growth prospects, enabling businesses to make informed strategic decisions. The report leverages extensive data analysis and expert forecasts to deliver actionable intelligence for stakeholders across the value chain. The total market value exceeded $xx million in 2024 and is projected to reach $xx million by 2033.
Garage Vacuums Market Concentration & Innovation
This section analyzes the competitive landscape of the garage vacuum market, examining market concentration, innovation drivers, regulatory impacts, and industry trends. The study period (2019-2024) reveals a moderately concentrated market with key players like Shop-Vac, Hoover, and Stanley holding significant shares. However, the emergence of smaller, specialized brands is increasing competition.
Market Concentration: The Herfindahl-Hirschman Index (HHI) for the garage vacuum market is estimated at xx in 2024, indicating a moderately concentrated market. Shop-Vac and Hoover individually hold approximately xx% and xx% market share, respectively, as of 2024.
Innovation Drivers: Innovation is driven primarily by advancements in motor technology (increased suction power, energy efficiency), filtration systems (improved dust and allergen trapping), and smart features (app connectivity, automated cleaning cycles).
Regulatory Framework: Regulations concerning noise pollution, energy consumption, and material safety impact product design and manufacturing. Compliance costs vary by region and influence market pricing.
Product Substitutes: Pressure washers and other cleaning equipment pose a competitive threat, particularly in specific cleaning applications.
End-User Trends: Growing demand for convenient, efficient, and powerful cleaning solutions, particularly amongst DIY enthusiasts and professional contractors, fuels market growth.
M&A Activities: The garage vacuum market witnessed xx M&A deals worth an estimated $xx million during the historical period. These transactions largely involved smaller companies being acquired by larger players seeking to expand their product portfolios or market reach.
Garage Vacuums Industry Trends & Insights
The garage vacuum market exhibits robust growth, driven by several factors. The compound annual growth rate (CAGR) is projected at xx% during the forecast period (2025-2033). Market penetration is currently at approximately xx% in developed economies and is expected to rise significantly in developing countries.
Key market growth drivers include:
- Rising disposable incomes and increased homeownership: This leads to greater investment in home improvement and maintenance, including specialized cleaning equipment.
- Technological advancements: The development of more powerful, efficient, and user-friendly garage vacuums is driving consumer demand.
- Growing awareness of indoor air quality: This prompts homeowners to invest in vacuums with superior filtration systems to remove dust, allergens, and other pollutants.
- Increased adoption of DIY and home improvement projects: This trend increases the need for efficient cleaning tools to manage debris and dust generated during renovations and repairs.
- E-commerce expansion: Online sales channels provide convenient access to a wider range of products and drive market growth.
Competitive dynamics are characterized by intense price competition, particularly amongst budget-friendly brands. However, premium brands are able to maintain higher profit margins due to their superior features and advanced technology.
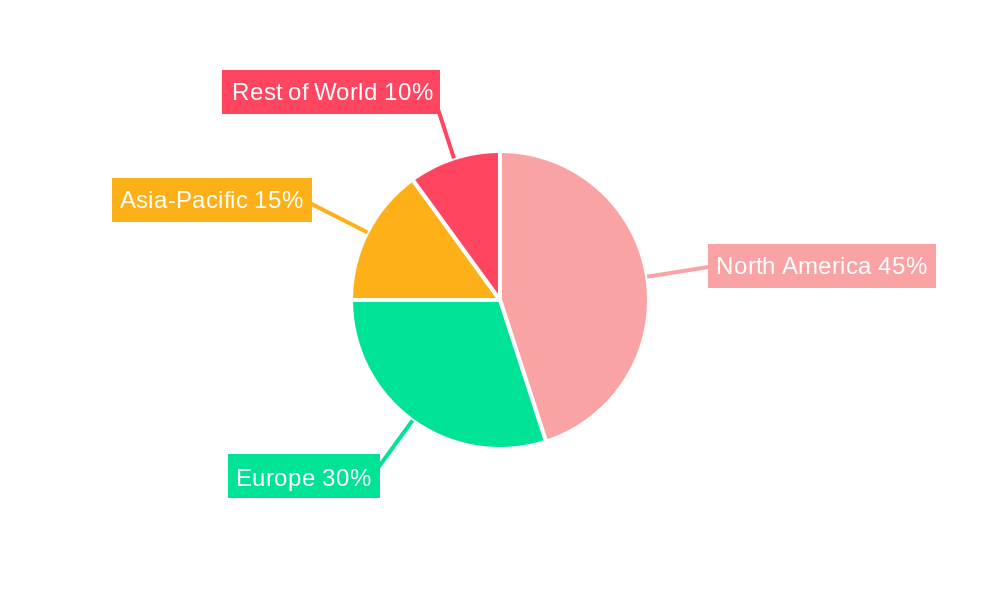
Dominant Markets & Segments in Garage Vacuums
The North American region currently dominates the garage vacuum market, accounting for approximately xx% of global revenue in 2024. This dominance is attributed to high levels of homeownership, strong DIY culture, and readily available purchasing power.
- Key Drivers of North American Dominance:
- High disposable incomes
- Strong home improvement market
- Well-established retail infrastructure
- Favorable consumer preferences towards specialized cleaning tools
Other significant markets include Europe and Asia-Pacific, each showing considerable growth potential driven by rising middle-class incomes and increasing consumer awareness of advanced cleaning technologies. However, market penetration in these regions remains comparatively lower than in North America. Within the segment of garage vacuums, the wet/dry segment is the most dominant due to its versatility in handling various cleaning tasks.
Garage Vacuums Product Developments
Recent product innovations focus on enhancing suction power, dust filtration, and user convenience. Manufacturers are incorporating cyclonic separation technology to improve dust collection efficiency and extending the lifespan of filters. Wet/dry models continue to dominate, with manufacturers adding features like onboard storage and improved maneuverability. Smart features, such as app integration and automated cleaning cycles, are gaining traction among consumers seeking a more convenient cleaning experience. This enhances the competitive advantage for premium brands.
Report Scope & Segmentation Analysis
This report segments the garage vacuum market based on several criteria:
By Product Type: Wet/dry vacuums, dry vacuums, canister vacuums, and specialized models (e.g., shop vacuums for industrial use). Wet/dry vacuums are projected to maintain the largest market share, driven by their versatility and suitability for various cleaning applications. The estimated market size for wet/dry vacuums was $xx million in 2024 and is projected to reach $xx million by 2033.
By Capacity: Different capacity ranges cater to various needs, ranging from small to large garages and workshops. The segment with capacities above xx liters is projected to register higher growth due to increasing demand for efficient cleaning solutions.
By Distribution Channel: Online retailers, home improvement stores, and specialized equipment suppliers cater to different consumer segments. Online sales are showing significant growth.
By Region: North America, Europe, Asia-Pacific, Latin America, and the Middle East and Africa. Each region presents unique market dynamics and growth opportunities.
Key Drivers of Garage Vacuums Growth
Several factors drive growth in the garage vacuum market:
- Technological advancements: Increased suction power, improved filtration systems, and smart features enhance the functionality and appeal of garage vacuums.
- Economic growth: Rising disposable incomes, particularly in emerging economies, fuel demand for high-quality cleaning products.
- Stringent environmental regulations: Regulations aimed at reducing noise and air pollution encourage the adoption of eco-friendly garage vacuums.
Challenges in the Garage Vacuums Sector
The garage vacuum industry faces several challenges:
- Intense competition: The presence of numerous established and emerging players creates a highly competitive landscape, leading to price wars and reduced profit margins.
- Supply chain disruptions: Global events and geopolitical instability can impact the availability of raw materials and manufacturing components, disrupting production and increasing costs.
- Fluctuating raw material prices: Increases in the cost of plastics, motors, and other components can impact the profitability of manufacturers.
Emerging Opportunities in Garage Vacuums
Opportunities exist in:
- Developing markets: Growing middle-class populations in emerging economies represent a substantial untapped market for garage vacuums.
- Product innovation: Developing quieter, more energy-efficient, and feature-rich models can capture significant market share.
- Subscription models: Offering maintenance and repair services on a subscription basis can improve customer loyalty and generate recurring revenue.
Key Developments in Garage Vacuums Industry
- 2022 Q4: Shop-Vac launched a new line of cordless wet/dry vacuums.
- 2023 Q1: Hoover introduced a smart garage vacuum with app connectivity.
- 2024 Q2: A major merger occurred between two smaller garage vacuum manufacturers. (Specific details not available, but estimated deal value was $xx million).
Strategic Outlook for Garage Vacuums Market
The garage vacuum market is poised for continued growth, driven by technological innovation, rising disposable incomes, and increasing awareness of indoor air quality. Manufacturers who focus on product differentiation, efficient supply chain management, and strategic partnerships will be best positioned for success. The continued integration of smart features and the expansion into emerging markets will be crucial for maximizing future market potential.
Garage Vacuums Segmentation
-
1. Application
- 1.1. Supermarket
- 1.2. Online Stores
- 1.3. Others
-
2. Types
- 2.1. Canister
- 2.2. Handheld
- 2.3. Others
Garage Vacuums Segmentation By Geography
-
1. North America
- 1.1. United States
- 1.2. Canada
- 1.3. Mexico
-
2. South America
- 2.1. Brazil
- 2.2. Argentina
- 2.3. Rest of South America
-
3. Europe
- 3.1. United Kingdom
- 3.2. Germany
- 3.3. France
- 3.4. Italy
- 3.5. Spain
- 3.6. Russia
- 3.7. Benelux
- 3.8. Nordics
- 3.9. Rest of Europe
-
4. Middle East & Africa
- 4.1. Turkey
- 4.2. Israel
- 4.3. GCC
- 4.4. North Africa
- 4.5. South Africa
- 4.6. Rest of Middle East & Africa
-
5. Asia Pacific
- 5.1. China
- 5.2. India
- 5.3. Japan
- 5.4. South Korea
- 5.5. ASEAN
- 5.6. Oceania
- 5.7. Rest of Asia Pacific
Garage Vacuums Regional Market Share
Geographic Coverage of Garage Vacuums
Garage Vacuums REPORT HIGHLIGHTS
| Aspects | Details |
|---|---|
| Study Period | 2020-2034 |
| Base Year | 2025 |
| Estimated Year | 2026 |
| Forecast Period | 2026-2034 |
| Historical Period | 2020-2025 |
| Growth Rate | CAGR of 8.6% from 2020-2034 |
| Segmentation |
|
Table of Contents
- 1. Introduction
- 1.1. Research Scope
- 1.2. Market Segmentation
- 1.3. Research Objective
- 1.4. Definitions and Assumptions
- 2. Executive Summary
- 2.1. Market Snapshot
- 3. Market Dynamics
- 3.1. Market Drivers
- 3.2. Market Restrains
- 3.3. Market Trends
- 3.4. Market Opportunities
- 4. Market Factor Analysis
- 4.1. Porters Five Forces
- 4.1.1. Bargaining Power of Suppliers
- 4.1.2. Bargaining Power of Buyers
- 4.1.3. Threat of New Entrants
- 4.1.4. Threat of Substitutes
- 4.1.5. Competitive Rivalry
- 4.2. PESTEL analysis
- 4.3. BCG Analysis
- 4.3.1. Stars (High Growth, High Market Share)
- 4.3.2. Cash Cows (Low Growth, High Market Share)
- 4.3.3. Question Mark (High Growth, Low Market Share)
- 4.3.4. Dogs (Low Growth, Low Market Share)
- 4.4. Ansoff Matrix Analysis
- 4.5. Supply Chain Analysis
- 4.6. Regulatory Landscape
- 4.7. Current Market Potential and Opportunity Assessment (TAM–SAM–SOM Framework)
- 4.8. RAX Analyst Note
- 4.1. Porters Five Forces
- 5. Market Analysis, Insights and Forecast 2021-2033
- 5.1. Market Analysis, Insights and Forecast - by Application
- 5.1.1. Supermarket
- 5.1.2. Online Stores
- 5.1.3. Others
- 5.2. Market Analysis, Insights and Forecast - by Types
- 5.2.1. Canister
- 5.2.2. Handheld
- 5.2.3. Others
- 5.3. Market Analysis, Insights and Forecast - by Region
- 5.3.1. North America
- 5.3.2. South America
- 5.3.3. Europe
- 5.3.4. Middle East & Africa
- 5.3.5. Asia Pacific
- 5.1. Market Analysis, Insights and Forecast - by Application
- 6. Global Garage Vacuums Analysis, Insights and Forecast, 2021-2033
- 6.1. Market Analysis, Insights and Forecast - by Application
- 6.1.1. Supermarket
- 6.1.2. Online Stores
- 6.1.3. Others
- 6.2. Market Analysis, Insights and Forecast - by Types
- 6.2.1. Canister
- 6.2.2. Handheld
- 6.2.3. Others
- 6.1. Market Analysis, Insights and Forecast - by Application
- 7. North America Garage Vacuums Analysis, Insights and Forecast, 2020-2032
- 7.1. Market Analysis, Insights and Forecast - by Application
- 7.1.1. Supermarket
- 7.1.2. Online Stores
- 7.1.3. Others
- 7.2. Market Analysis, Insights and Forecast - by Types
- 7.2.1. Canister
- 7.2.2. Handheld
- 7.2.3. Others
- 7.1. Market Analysis, Insights and Forecast - by Application
- 8. South America Garage Vacuums Analysis, Insights and Forecast, 2020-2032
- 8.1. Market Analysis, Insights and Forecast - by Application
- 8.1.1. Supermarket
- 8.1.2. Online Stores
- 8.1.3. Others
- 8.2. Market Analysis, Insights and Forecast - by Types
- 8.2.1. Canister
- 8.2.2. Handheld
- 8.2.3. Others
- 8.1. Market Analysis, Insights and Forecast - by Application
- 9. Europe Garage Vacuums Analysis, Insights and Forecast, 2020-2032
- 9.1. Market Analysis, Insights and Forecast - by Application
- 9.1.1. Supermarket
- 9.1.2. Online Stores
- 9.1.3. Others
- 9.2. Market Analysis, Insights and Forecast - by Types
- 9.2.1. Canister
- 9.2.2. Handheld
- 9.2.3. Others
- 9.1. Market Analysis, Insights and Forecast - by Application
- 10. Middle East & Africa Garage Vacuums Analysis, Insights and Forecast, 2020-2032
- 10.1. Market Analysis, Insights and Forecast - by Application
- 10.1.1. Supermarket
- 10.1.2. Online Stores
- 10.1.3. Others
- 10.2. Market Analysis, Insights and Forecast - by Types
- 10.2.1. Canister
- 10.2.2. Handheld
- 10.2.3. Others
- 10.1. Market Analysis, Insights and Forecast - by Application
- 11. Asia Pacific Garage Vacuums Analysis, Insights and Forecast, 2020-2032
- 11.1. Market Analysis, Insights and Forecast - by Application
- 11.1.1. Supermarket
- 11.1.2. Online Stores
- 11.1.3. Others
- 11.2. Market Analysis, Insights and Forecast - by Types
- 11.2.1. Canister
- 11.2.2. Handheld
- 11.2.3. Others
- 11.1. Market Analysis, Insights and Forecast - by Application
- 12. Competitive Analysis
- 12.1. Company Profiles
- 12.1.1 Shop-Vac
- 12.1.1.1. Company Overview
- 12.1.1.2. Products
- 12.1.1.3. Company Financials
- 12.1.1.4. SWOT Analysis
- 12.1.2 Armor All
- 12.1.2.1. Company Overview
- 12.1.2.2. Products
- 12.1.2.3. Company Financials
- 12.1.2.4. SWOT Analysis
- 12.1.3 Stanley
- 12.1.3.1. Company Overview
- 12.1.3.2. Products
- 12.1.3.3. Company Financials
- 12.1.3.4. SWOT Analysis
- 12.1.4 Hoover
- 12.1.4.1. Company Overview
- 12.1.4.2. Products
- 12.1.4.3. Company Financials
- 12.1.4.4. SWOT Analysis
- 12.1.5 Black & Decker
- 12.1.5.1. Company Overview
- 12.1.5.2. Products
- 12.1.5.3. Company Financials
- 12.1.5.4. SWOT Analysis
- 12.1.6 BISSELL
- 12.1.6.1. Company Overview
- 12.1.6.2. Products
- 12.1.6.3. Company Financials
- 12.1.6.4. SWOT Analysis
- 12.1.7 Keystone
- 12.1.7.1. Company Overview
- 12.1.7.2. Products
- 12.1.7.3. Company Financials
- 12.1.7.4. SWOT Analysis
- 12.1.8 MetroVac
- 12.1.8.1. Company Overview
- 12.1.8.2. Products
- 12.1.8.3. Company Financials
- 12.1.8.4. SWOT Analysis
- 12.1.9 VacMaster
- 12.1.9.1. Company Overview
- 12.1.9.2. Products
- 12.1.9.3. Company Financials
- 12.1.9.4. SWOT Analysis
- 12.1.1 Shop-Vac
- 12.2. Market Entropy
- 12.2.1 Company's Key Areas Served
- 12.2.2 Recent Developments
- 12.3. Company Market Share Analysis 2025
- 12.3.1 Top 5 Companies Market Share Analysis
- 12.3.2 Top 3 Companies Market Share Analysis
- 12.4. List of Potential Customers
- 13. Research Methodology
List of Figures
- Figure 1: Global Garage Vacuums Revenue Breakdown (undefined, %) by Region 2025 & 2033
- Figure 2: Global Garage Vacuums Volume Breakdown (K, %) by Region 2025 & 2033
- Figure 3: North America Garage Vacuums Revenue (undefined), by Application 2025 & 2033
- Figure 4: North America Garage Vacuums Volume (K), by Application 2025 & 2033
- Figure 5: North America Garage Vacuums Revenue Share (%), by Application 2025 & 2033
- Figure 6: North America Garage Vacuums Volume Share (%), by Application 2025 & 2033
- Figure 7: North America Garage Vacuums Revenue (undefined), by Types 2025 & 2033
- Figure 8: North America Garage Vacuums Volume (K), by Types 2025 & 2033
- Figure 9: North America Garage Vacuums Revenue Share (%), by Types 2025 & 2033
- Figure 10: North America Garage Vacuums Volume Share (%), by Types 2025 & 2033
- Figure 11: North America Garage Vacuums Revenue (undefined), by Country 2025 & 2033
- Figure 12: North America Garage Vacuums Volume (K), by Country 2025 & 2033
- Figure 13: North America Garage Vacuums Revenue Share (%), by Country 2025 & 2033
- Figure 14: North America Garage Vacuums Volume Share (%), by Country 2025 & 2033
- Figure 15: South America Garage Vacuums Revenue (undefined), by Application 2025 & 2033
- Figure 16: South America Garage Vacuums Volume (K), by Application 2025 & 2033
- Figure 17: South America Garage Vacuums Revenue Share (%), by Application 2025 & 2033
- Figure 18: South America Garage Vacuums Volume Share (%), by Application 2025 & 2033
- Figure 19: South America Garage Vacuums Revenue (undefined), by Types 2025 & 2033
- Figure 20: South America Garage Vacuums Volume (K), by Types 2025 & 2033
- Figure 21: South America Garage Vacuums Revenue Share (%), by Types 2025 & 2033
- Figure 22: South America Garage Vacuums Volume Share (%), by Types 2025 & 2033
- Figure 23: South America Garage Vacuums Revenue (undefined), by Country 2025 & 2033
- Figure 24: South America Garage Vacuums Volume (K), by Country 2025 & 2033
- Figure 25: South America Garage Vacuums Revenue Share (%), by Country 2025 & 2033
- Figure 26: South America Garage Vacuums Volume Share (%), by Country 2025 & 2033
- Figure 27: Europe Garage Vacuums Revenue (undefined), by Application 2025 & 2033
- Figure 28: Europe Garage Vacuums Volume (K), by Application 2025 & 2033
- Figure 29: Europe Garage Vacuums Revenue Share (%), by Application 2025 & 2033
- Figure 30: Europe Garage Vacuums Volume Share (%), by Application 2025 & 2033
- Figure 31: Europe Garage Vacuums Revenue (undefined), by Types 2025 & 2033
- Figure 32: Europe Garage Vacuums Volume (K), by Types 2025 & 2033
- Figure 33: Europe Garage Vacuums Revenue Share (%), by Types 2025 & 2033
- Figure 34: Europe Garage Vacuums Volume Share (%), by Types 2025 & 2033
- Figure 35: Europe Garage Vacuums Revenue (undefined), by Country 2025 & 2033
- Figure 36: Europe Garage Vacuums Volume (K), by Country 2025 & 2033
- Figure 37: Europe Garage Vacuums Revenue Share (%), by Country 2025 & 2033
- Figure 38: Europe Garage Vacuums Volume Share (%), by Country 2025 & 2033
- Figure 39: Middle East & Africa Garage Vacuums Revenue (undefined), by Application 2025 & 2033
- Figure 40: Middle East & Africa Garage Vacuums Volume (K), by Application 2025 & 2033
- Figure 41: Middle East & Africa Garage Vacuums Revenue Share (%), by Application 2025 & 2033
- Figure 42: Middle East & Africa Garage Vacuums Volume Share (%), by Application 2025 & 2033
- Figure 43: Middle East & Africa Garage Vacuums Revenue (undefined), by Types 2025 & 2033
- Figure 44: Middle East & Africa Garage Vacuums Volume (K), by Types 2025 & 2033
- Figure 45: Middle East & Africa Garage Vacuums Revenue Share (%), by Types 2025 & 2033
- Figure 46: Middle East & Africa Garage Vacuums Volume Share (%), by Types 2025 & 2033
- Figure 47: Middle East & Africa Garage Vacuums Revenue (undefined), by Country 2025 & 2033
- Figure 48: Middle East & Africa Garage Vacuums Volume (K), by Country 2025 & 2033
- Figure 49: Middle East & Africa Garage Vacuums Revenue Share (%), by Country 2025 & 2033
- Figure 50: Middle East & Africa Garage Vacuums Volume Share (%), by Country 2025 & 2033
- Figure 51: Asia Pacific Garage Vacuums Revenue (undefined), by Application 2025 & 2033
- Figure 52: Asia Pacific Garage Vacuums Volume (K), by Application 2025 & 2033
- Figure 53: Asia Pacific Garage Vacuums Revenue Share (%), by Application 2025 & 2033
- Figure 54: Asia Pacific Garage Vacuums Volume Share (%), by Application 2025 & 2033
- Figure 55: Asia Pacific Garage Vacuums Revenue (undefined), by Types 2025 & 2033
- Figure 56: Asia Pacific Garage Vacuums Volume (K), by Types 2025 & 2033
- Figure 57: Asia Pacific Garage Vacuums Revenue Share (%), by Types 2025 & 2033
- Figure 58: Asia Pacific Garage Vacuums Volume Share (%), by Types 2025 & 2033
- Figure 59: Asia Pacific Garage Vacuums Revenue (undefined), by Country 2025 & 2033
- Figure 60: Asia Pacific Garage Vacuums Volume (K), by Country 2025 & 2033
- Figure 61: Asia Pacific Garage Vacuums Revenue Share (%), by Country 2025 & 2033
- Figure 62: Asia Pacific Garage Vacuums Volume Share (%), by Country 2025 & 2033
List of Tables
- Table 1: Global Garage Vacuums Revenue undefined Forecast, by Application 2020 & 2033
- Table 2: Global Garage Vacuums Volume K Forecast, by Application 2020 & 2033
- Table 3: Global Garage Vacuums Revenue undefined Forecast, by Types 2020 & 2033
- Table 4: Global Garage Vacuums Volume K Forecast, by Types 2020 & 2033
- Table 5: Global Garage Vacuums Revenue undefined Forecast, by Region 2020 & 2033
- Table 6: Global Garage Vacuums Volume K Forecast, by Region 2020 & 2033
- Table 7: Global Garage Vacuums Revenue undefined Forecast, by Application 2020 & 2033
- Table 8: Global Garage Vacuums Volume K Forecast, by Application 2020 & 2033
- Table 9: Global Garage Vacuums Revenue undefined Forecast, by Types 2020 & 2033
- Table 10: Global Garage Vacuums Volume K Forecast, by Types 2020 & 2033
- Table 11: Global Garage Vacuums Revenue undefined Forecast, by Country 2020 & 2033
- Table 12: Global Garage Vacuums Volume K Forecast, by Country 2020 & 2033
- Table 13: United States Garage Vacuums Revenue (undefined) Forecast, by Application 2020 & 2033
- Table 14: United States Garage Vacuums Volume (K) Forecast, by Application 2020 & 2033
- Table 15: Canada Garage Vacuums Revenue (undefined) Forecast, by Application 2020 & 2033
- Table 16: Canada Garage Vacuums Volume (K) Forecast, by Application 2020 & 2033
- Table 17: Mexico Garage Vacuums Revenue (undefined) Forecast, by Application 2020 & 2033
- Table 18: Mexico Garage Vacuums Volume (K) Forecast, by Application 2020 & 2033
- Table 19: Global Garage Vacuums Revenue undefined Forecast, by Application 2020 & 2033
- Table 20: Global Garage Vacuums Volume K Forecast, by Application 2020 & 2033
- Table 21: Global Garage Vacuums Revenue undefined Forecast, by Types 2020 & 2033
- Table 22: Global Garage Vacuums Volume K Forecast, by Types 2020 & 2033
- Table 23: Global Garage Vacuums Revenue undefined Forecast, by Country 2020 & 2033
- Table 24: Global Garage Vacuums Volume K Forecast, by Country 2020 & 2033
- Table 25: Brazil Garage Vacuums Revenue (undefined) Forecast, by Application 2020 & 2033
- Table 26: Brazil Garage Vacuums Volume (K) Forecast, by Application 2020 & 2033
- Table 27: Argentina Garage Vacuums Revenue (undefined) Forecast, by Application 2020 & 2033
- Table 28: Argentina Garage Vacuums Volume (K) Forecast, by Application 2020 & 2033
- Table 29: Rest of South America Garage Vacuums Revenue (undefined) Forecast, by Application 2020 & 2033
- Table 30: Rest of South America Garage Vacuums Volume (K) Forecast, by Application 2020 & 2033
- Table 31: Global Garage Vacuums Revenue undefined Forecast, by Application 2020 & 2033
- Table 32: Global Garage Vacuums Volume K Forecast, by Application 2020 & 2033
- Table 33: Global Garage Vacuums Revenue undefined Forecast, by Types 2020 & 2033
- Table 34: Global Garage Vacuums Volume K Forecast, by Types 2020 & 2033
- Table 35: Global Garage Vacuums Revenue undefined Forecast, by Country 2020 & 2033
- Table 36: Global Garage Vacuums Volume K Forecast, by Country 2020 & 2033
- Table 37: United Kingdom Garage Vacuums Revenue (undefined) Forecast, by Application 2020 & 2033
- Table 38: United Kingdom Garage Vacuums Volume (K) Forecast, by Application 2020 & 2033
- Table 39: Germany Garage Vacuums Revenue (undefined) Forecast, by Application 2020 & 2033
- Table 40: Germany Garage Vacuums Volume (K) Forecast, by Application 2020 & 2033
- Table 41: France Garage Vacuums Revenue (undefined) Forecast, by Application 2020 & 2033
- Table 42: France Garage Vacuums Volume (K) Forecast, by Application 2020 & 2033
- Table 43: Italy Garage Vacuums Revenue (undefined) Forecast, by Application 2020 & 2033
- Table 44: Italy Garage Vacuums Volume (K) Forecast, by Application 2020 & 2033
- Table 45: Spain Garage Vacuums Revenue (undefined) Forecast, by Application 2020 & 2033
- Table 46: Spain Garage Vacuums Volume (K) Forecast, by Application 2020 & 2033
- Table 47: Russia Garage Vacuums Revenue (undefined) Forecast, by Application 2020 & 2033
- Table 48: Russia Garage Vacuums Volume (K) Forecast, by Application 2020 & 2033
- Table 49: Benelux Garage Vacuums Revenue (undefined) Forecast, by Application 2020 & 2033
- Table 50: Benelux Garage Vacuums Volume (K) Forecast, by Application 2020 & 2033
- Table 51: Nordics Garage Vacuums Revenue (undefined) Forecast, by Application 2020 & 2033
- Table 52: Nordics Garage Vacuums Volume (K) Forecast, by Application 2020 & 2033
- Table 53: Rest of Europe Garage Vacuums Revenue (undefined) Forecast, by Application 2020 & 2033
- Table 54: Rest of Europe Garage Vacuums Volume (K) Forecast, by Application 2020 & 2033
- Table 55: Global Garage Vacuums Revenue undefined Forecast, by Application 2020 & 2033
- Table 56: Global Garage Vacuums Volume K Forecast, by Application 2020 & 2033
- Table 57: Global Garage Vacuums Revenue undefined Forecast, by Types 2020 & 2033
- Table 58: Global Garage Vacuums Volume K Forecast, by Types 2020 & 2033
- Table 59: Global Garage Vacuums Revenue undefined Forecast, by Country 2020 & 2033
- Table 60: Global Garage Vacuums Volume K Forecast, by Country 2020 & 2033
- Table 61: Turkey Garage Vacuums Revenue (undefined) Forecast, by Application 2020 & 2033
- Table 62: Turkey Garage Vacuums Volume (K) Forecast, by Application 2020 & 2033
- Table 63: Israel Garage Vacuums Revenue (undefined) Forecast, by Application 2020 & 2033
- Table 64: Israel Garage Vacuums Volume (K) Forecast, by Application 2020 & 2033
- Table 65: GCC Garage Vacuums Revenue (undefined) Forecast, by Application 2020 & 2033
- Table 66: GCC Garage Vacuums Volume (K) Forecast, by Application 2020 & 2033
- Table 67: North Africa Garage Vacuums Revenue (undefined) Forecast, by Application 2020 & 2033
- Table 68: North Africa Garage Vacuums Volume (K) Forecast, by Application 2020 & 2033
- Table 69: South Africa Garage Vacuums Revenue (undefined) Forecast, by Application 2020 & 2033
- Table 70: South Africa Garage Vacuums Volume (K) Forecast, by Application 2020 & 2033
- Table 71: Rest of Middle East & Africa Garage Vacuums Revenue (undefined) Forecast, by Application 2020 & 2033
- Table 72: Rest of Middle East & Africa Garage Vacuums Volume (K) Forecast, by Application 2020 & 2033
- Table 73: Global Garage Vacuums Revenue undefined Forecast, by Application 2020 & 2033
- Table 74: Global Garage Vacuums Volume K Forecast, by Application 2020 & 2033
- Table 75: Global Garage Vacuums Revenue undefined Forecast, by Types 2020 & 2033
- Table 76: Global Garage Vacuums Volume K Forecast, by Types 2020 & 2033
- Table 77: Global Garage Vacuums Revenue undefined Forecast, by Country 2020 & 2033
- Table 78: Global Garage Vacuums Volume K Forecast, by Country 2020 & 2033
- Table 79: China Garage Vacuums Revenue (undefined) Forecast, by Application 2020 & 2033
- Table 80: China Garage Vacuums Volume (K) Forecast, by Application 2020 & 2033
- Table 81: India Garage Vacuums Revenue (undefined) Forecast, by Application 2020 & 2033
- Table 82: India Garage Vacuums Volume (K) Forecast, by Application 2020 & 2033
- Table 83: Japan Garage Vacuums Revenue (undefined) Forecast, by Application 2020 & 2033
- Table 84: Japan Garage Vacuums Volume (K) Forecast, by Application 2020 & 2033
- Table 85: South Korea Garage Vacuums Revenue (undefined) Forecast, by Application 2020 & 2033
- Table 86: South Korea Garage Vacuums Volume (K) Forecast, by Application 2020 & 2033
- Table 87: ASEAN Garage Vacuums Revenue (undefined) Forecast, by Application 2020 & 2033
- Table 88: ASEAN Garage Vacuums Volume (K) Forecast, by Application 2020 & 2033
- Table 89: Oceania Garage Vacuums Revenue (undefined) Forecast, by Application 2020 & 2033
- Table 90: Oceania Garage Vacuums Volume (K) Forecast, by Application 2020 & 2033
- Table 91: Rest of Asia Pacific Garage Vacuums Revenue (undefined) Forecast, by Application 2020 & 2033
- Table 92: Rest of Asia Pacific Garage Vacuums Volume (K) Forecast, by Application 2020 & 2033
Frequently Asked Questions
1. What is the projected Compound Annual Growth Rate (CAGR) of the Garage Vacuums?
The projected CAGR is approximately 8.6%.
2. Which companies are prominent players in the Garage Vacuums?
Key companies in the market include Shop-Vac, Armor All, Stanley, Hoover, Black & Decker, BISSELL, Keystone, MetroVac, VacMaster.
3. What are the main segments of the Garage Vacuums?
The market segments include Application, Types.
4. Can you provide details about the market size?
The market size is estimated to be USD XXX N/A as of 2022.
5. What are some drivers contributing to market growth?
N/A
6. What are the notable trends driving market growth?
N/A
7. Are there any restraints impacting market growth?
N/A
8. Can you provide examples of recent developments in the market?
N/A
9. What pricing options are available for accessing the report?
Pricing options include single-user, multi-user, and enterprise licenses priced at USD 3350.00, USD 5025.00, and USD 6700.00 respectively.
10. Is the market size provided in terms of value or volume?
The market size is provided in terms of value, measured in N/A and volume, measured in K.
11. Are there any specific market keywords associated with the report?
Yes, the market keyword associated with the report is "Garage Vacuums," which aids in identifying and referencing the specific market segment covered.
12. How do I determine which pricing option suits my needs best?
The pricing options vary based on user requirements and access needs. Individual users may opt for single-user licenses, while businesses requiring broader access may choose multi-user or enterprise licenses for cost-effective access to the report.
13. Are there any additional resources or data provided in the Garage Vacuums report?
While the report offers comprehensive insights, it's advisable to review the specific contents or supplementary materials provided to ascertain if additional resources or data are available.
14. How can I stay updated on further developments or reports in the Garage Vacuums?
To stay informed about further developments, trends, and reports in the Garage Vacuums, consider subscribing to industry newsletters, following relevant companies and organizations, or regularly checking reputable industry news sources and publications.
Methodology
Step 1 - Identification of Relevant Samples Size from Population Database


Step 2 - Approaches for Defining Global Market Size (Value, Volume* & Price*)

Note*: In applicable scenarios
Step 3 - Data Sources
Primary Research
- Web Analytics
- Survey Reports
- Research Institute
- Latest Research Reports
- Opinion Leaders
Secondary Research
- Annual Reports
- White Paper
- Latest Press Release
- Industry Association
- Paid Database
- Investor Presentations

Step 4 - Data Triangulation
Involves using different sources of information in order to increase the validity of a study
These sources are likely to be stakeholders in a program - participants, other researchers, program staff, other community members, and so on.
Then we put all data in single framework & apply various statistical tools to find out the dynamic on the market.
During the analysis stage, feedback from the stakeholder groups would be compared to determine areas of agreement as well as areas of divergence