

Key Insights
The GCC Dangerous Goods Freight Market is experiencing robust growth, driven by the region's expanding petrochemical and industrial sectors, increased cross-border trade, and the rising demand for specialized logistics solutions. The market's compound annual growth rate (CAGR) exceeding 5% indicates a significant upward trajectory projected through 2033. Key drivers include the ongoing infrastructure development projects within the GCC, stricter regulations surrounding the handling and transportation of hazardous materials necessitating specialized services, and the growing adoption of advanced technologies like real-time tracking and monitoring systems to enhance safety and efficiency. The market is segmented by service type (transportation, warehousing & inventory management, and value-added services) and geographically across the six GCC countries (Saudi Arabia, UAE, Kuwait, Qatar, Bahrain, and Oman). Saudi Arabia and the UAE are currently the largest markets, benefiting from their substantial industrial bases and strategic locations. However, other GCC nations are experiencing rapid growth, driven by diversification initiatives and increasing investments in logistics infrastructure. While challenges exist, such as fluctuating oil prices and potential regulatory changes, the overall market outlook remains positive, promising considerable opportunities for established logistics providers and new entrants alike. The market is characterized by a mix of international and regional players, with competition focusing on service quality, specialized expertise, and technological capabilities.
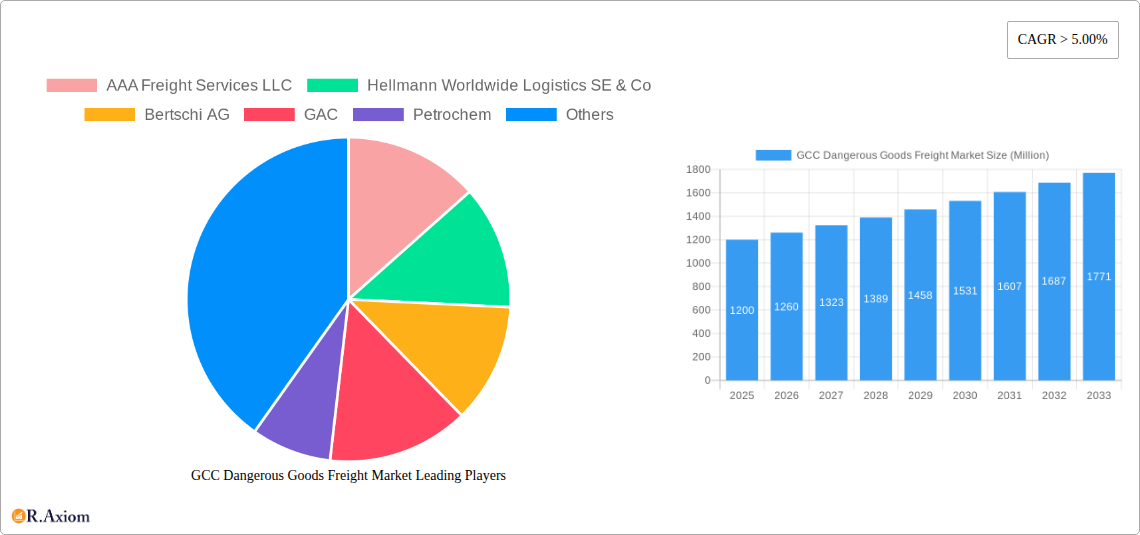
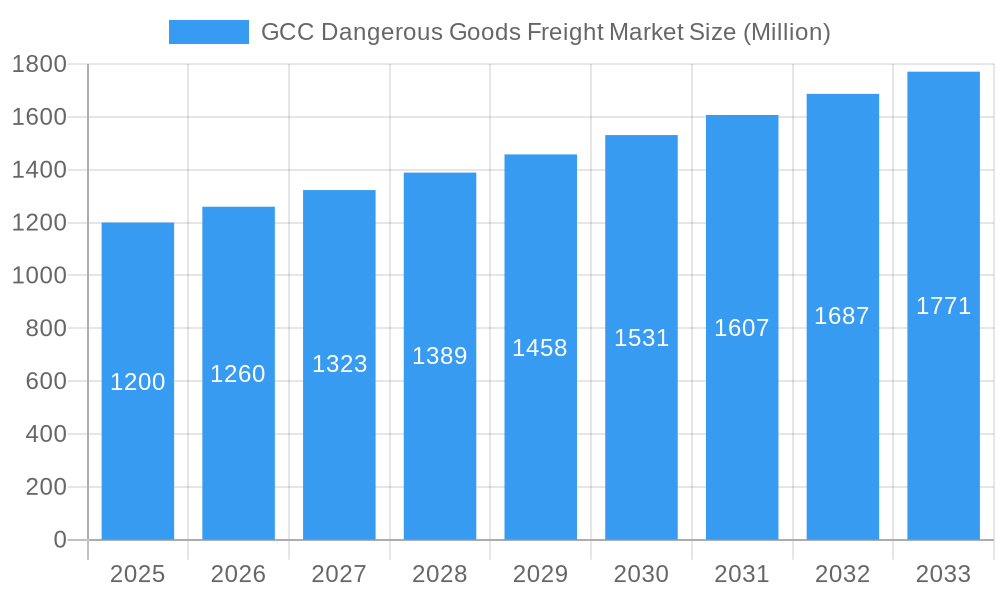
GCC Dangerous Goods Freight Market Market Size (In Billion)
The forecast for the GCC Dangerous Goods Freight Market indicates continued expansion, fueled by sustained industrial growth and increasing government focus on enhancing logistics efficiency across the region. The growth is anticipated to be particularly strong in sectors such as chemicals, pharmaceuticals, and energy, which necessitate specialized handling and transportation of dangerous goods. The ongoing investments in port infrastructure and related technologies are further bolstering market expansion. Market participants are adapting to evolving regulatory landscapes by implementing robust safety protocols and investing in technology to minimize risks and comply with international standards. Competitive dynamics will likely intensify, particularly with the entry of new players offering innovative solutions and the continuous adoption of advanced technologies. Furthermore, mergers and acquisitions could reshape the market landscape. The increasing focus on sustainability and environmental responsibility within the logistics sector presents both opportunities and challenges, pushing companies to adopt environmentally friendly practices and technologies.
GCC Dangerous Goods Freight Market Company Market Share
GCC Dangerous Goods Freight Market: A Comprehensive Report (2019-2033)
This detailed report provides a comprehensive analysis of the GCC Dangerous Goods Freight Market, offering invaluable insights for industry stakeholders, investors, and strategic decision-makers. With a study period spanning 2019-2033, a base year of 2025, and a forecast period of 2025-2033, this report leverages historical data (2019-2024) and incorporates the latest market trends to provide accurate projections and actionable recommendations. The market size is estimated at XX Million in 2025 and is projected to reach XX Million by 2033, with a CAGR of xx%.
GCC Dangerous Goods Freight Market Market Concentration & Innovation
The GCC dangerous goods freight market exhibits a moderately concentrated landscape, with several key players commanding significant market share. AAA Freight Services LLC, Hellmann Worldwide Logistics SE & Co, Bertschi AG, GAC, Petrochem, Agility, Al Ghazal Transport UAE, BDP INTERNATIONAL, Al Futtaim - Logistics, and TALKE Group are among the prominent players, although the exact market share distribution remains dynamic. Competition is primarily based on service quality, specialized expertise in handling hazardous materials, technological capabilities, and network reach across the GCC countries.
Innovation within the sector is driven by advancements in technology, including real-time tracking systems, improved safety protocols, and digitalized documentation processes. Stringent regulatory frameworks, such as those imposed by the International Maritime Organization (IMO) and the International Air Transport Association (IATA), also spur innovation in safer and more efficient transportation methods. The market witnesses continuous developments in specialized containers, advanced tracking devices, and risk management software. Product substitutes are limited due to the specialized nature of handling dangerous goods; however, some companies are exploring alternative modes of transportation (e.g., rail transport) to mitigate reliance on road transportation. M&A activity plays a role in market consolidation, as seen in recent acquisitions. For example, Magnate Worldwide's acquisition of Cargo Logistics Group in June 2023 exemplifies this trend. While precise M&A deal values are not publicly available for all transactions in this sector, the overall deal values are estimated to be in the range of XX Million annually. End-user trends are shaped by increasing demand for safer, more efficient, and transparent logistics solutions, further driving innovation within the industry.
GCC Dangerous Goods Freight Market Industry Trends & Insights
The GCC dangerous goods freight market is experiencing robust growth, propelled by factors such as the region's expanding petrochemical and industrial sectors, growth in e-commerce, and increased cross-border trade. Technological disruptions, like the adoption of blockchain technology for enhanced supply chain transparency and the implementation of advanced analytics for optimized route planning, are transforming the sector. Consumer preferences increasingly favor reliable, secure, and environmentally conscious logistics providers. The market penetration of advanced tracking systems is rising steadily, reaching xx% in 2025 and expected to further increase in the forecast period. Competitive dynamics are shaped by pricing pressures, technological advancements, and regulatory compliance requirements. The market’s growth is expected to continue at a CAGR of xx% during the forecast period, driven by the factors mentioned above. The increasing adoption of digital technologies and improved infrastructure further fuels market expansion.
Dominant Markets & Segments in GCC Dangerous Goods Freight Market
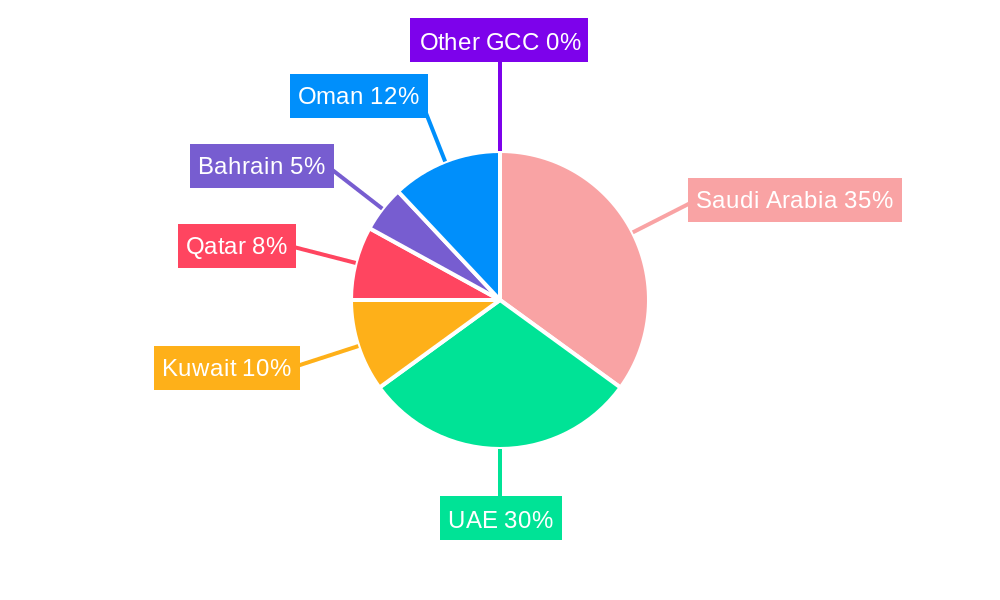
By Country: Saudi Arabia and the United Arab Emirates (UAE) are the dominant markets in the GCC region, together accounting for approximately xx% of the total market share in 2025.
Key Drivers (Saudi Arabia & UAE):
- Large and diversified economies
- Extensive industrial and petrochemical infrastructure
- Significant government investments in logistics infrastructure
- Strategic geographic locations
Dominance Analysis: Saudi Arabia's significant presence in the oil and gas sector, coupled with its large and expanding industrial base, makes it a crucial market for dangerous goods transportation. The UAE's role as a major trade and logistics hub in the region also significantly contributes to its dominance. Kuwait, Qatar, Oman, and Bahrain present sizeable markets with growing industrial sectors, though their current market share is relatively smaller compared to Saudi Arabia and the UAE.
By Service: Transportation services constitute the largest segment, with xx% market share in 2025, followed by warehousing and inventory management, and value-added services.
- Key Drivers (Transportation): High demand for efficient and safe transportation solutions for hazardous materials.
- Key Drivers (Warehousing & Inventory): Increasing need for secure storage and management of dangerous goods.
- Key Drivers (Value-Added Services): Growing demand for specialized services like packaging, labeling, and compliance consulting.
GCC Dangerous Goods Freight Market Product Developments
Recent product innovations focus on improving safety, efficiency, and environmental sustainability. This includes the development of advanced tracking and monitoring systems, specialized containers designed for specific hazardous materials, and the implementation of digital platforms for streamlined documentation and compliance management. These advancements improve the overall efficiency and reduce risks associated with the transportation of dangerous goods, significantly enhancing the market fit and competitive advantages of companies adopting them. Technological trends such as IoT and AI are playing an increasingly important role in optimizing operations and enhancing safety protocols.
Report Scope & Segmentation Analysis
This report segments the GCC Dangerous Goods Freight Market by service type (Transportation, Warehousing and Inventory Management, Value-added Services) and by country (Saudi Arabia, United Arab Emirates, Kuwait, Qatar, Bahrain, Oman). Each segment's analysis includes growth projections, market sizes, and competitive landscapes. The transportation segment is projected to experience the fastest growth, driven by increased industrial activity and cross-border trade. The warehousing and inventory management segment is also expected to witness robust growth, fueled by the demand for secure storage solutions. The value-added services segment is poised for growth due to the increasing need for specialized expertise in handling dangerous goods. Country-wise, Saudi Arabia and the UAE are expected to maintain their dominant positions, driven by their large economies and industrial hubs. Other GCC countries are anticipated to show steady growth, although at a slightly slower pace.
Key Drivers of GCC Dangerous Goods Freight Market Growth
The GCC dangerous goods freight market's growth is fueled by several key factors: the expanding petrochemical and industrial sectors, increased infrastructure development supporting logistics and transportation networks, and rising cross-border trade within the GCC and beyond. Government initiatives promoting economic diversification and the growth of the logistics sector are also crucial drivers. The increasing adoption of advanced technologies, including real-time tracking and digitalization of documentation processes, further contributes to market expansion. The growing awareness of safety and regulatory compliance is also a significant factor influencing market growth.
Challenges in the GCC Dangerous Goods Freight Market Sector
The GCC dangerous goods freight market faces challenges such as stringent regulatory requirements, which necessitate significant investments in compliance and safety protocols. Fluctuations in oil prices and other global economic events can impact the demand for transportation services. Supply chain disruptions, geopolitical instability, and intense competition among logistics providers add to the difficulties. These challenges collectively lead to increased operational costs and potentially limit profit margins for some operators. The impact on the market can vary, but it's estimated that approximately xx Million in potential revenue is lost annually due to these challenges.
Emerging Opportunities in GCC Dangerous Goods Freight Market
Emerging opportunities lie in the adoption of advanced technologies, such as AI-powered route optimization and predictive maintenance for vehicles and equipment. The growing demand for sustainable and environmentally friendly logistics solutions opens avenues for specialized services focusing on reducing carbon footprints. Furthermore, the expansion of e-commerce and the growth of specialized sectors like healthcare and pharmaceuticals create new avenues for the transportation of temperature-sensitive and hazardous materials. The potential for new technological solutions to streamline processes and improve efficiency presents substantial opportunities for market expansion.
Leading Players in the GCC Dangerous Goods Freight Market Market
- AAA Freight Services LLC
- Hellmann Worldwide Logistics SE & Co
- Bertschi AG
- GAC
- Petrochem
- Agility
- Al Ghazal Transport UAE
- BDP INTERNATIONAL
- Al Futtaim - Logistics
- TALKE Group
Key Developments in GCC Dangerous Goods Freight Market Industry
June 2023: Magnate Worldwide acquires Cargo Logistics Group, expanding its footprint and service offerings within the dangerous goods logistics sector. This acquisition signals consolidation within the market and an increased focus on specialized logistics solutions.
April 2023: dnata adopts IATA's DG AutoCheck Connect API, furthering the digitalization of the air cargo industry and improving data transfer efficiency in handling dangerous goods shipments. This development highlights the increasing adoption of technological solutions to improve safety and efficiency.
Strategic Outlook for GCC Dangerous Goods Freight Market Market
The GCC dangerous goods freight market is poised for continued growth, driven by sustained economic expansion in the region and increasing demand for specialized logistics services. Technological advancements, regulatory changes, and the growing focus on sustainability will shape future market dynamics. Companies that effectively leverage technology to enhance safety, efficiency, and transparency will be well-positioned for success. The market's long-term outlook remains positive, with significant opportunities for growth and innovation.
GCC Dangerous Goods Freight Market Segmentation
-
1. Service
- 1.1. Transportation
- 1.2. Warehousing and Inventory Management
- 1.3. Value-added Services
GCC Dangerous Goods Freight Market Segmentation By Geography
-
1. North America
- 1.1. United States
- 1.2. Canada
- 1.3. Mexico
-
2. South America
- 2.1. Brazil
- 2.2. Argentina
- 2.3. Rest of South America
-
3. Europe
- 3.1. United Kingdom
- 3.2. Germany
- 3.3. France
- 3.4. Italy
- 3.5. Spain
- 3.6. Russia
- 3.7. Benelux
- 3.8. Nordics
- 3.9. Rest of Europe
-
4. Middle East & Africa
- 4.1. Turkey
- 4.2. Israel
- 4.3. GCC
- 4.4. North Africa
- 4.5. South Africa
- 4.6. Rest of Middle East & Africa
-
5. Asia Pacific
- 5.1. China
- 5.2. India
- 5.3. Japan
- 5.4. South Korea
- 5.5. ASEAN
- 5.6. Oceania
- 5.7. Rest of Asia Pacific
GCC Dangerous Goods Freight Market Regional Market Share
Geographic Coverage of GCC Dangerous Goods Freight Market
GCC Dangerous Goods Freight Market REPORT HIGHLIGHTS
| Aspects | Details |
|---|---|
| Study Period | 2020-2034 |
| Base Year | 2025 |
| Estimated Year | 2026 |
| Forecast Period | 2026-2034 |
| Historical Period | 2020-2025 |
| Growth Rate | CAGR of > 5.00% from 2020-2034 |
| Segmentation |
|
Table of Contents
- 1. Introduction
- 1.1. Research Scope
- 1.2. Market Segmentation
- 1.3. Research Objective
- 1.4. Definitions and Assumptions
- 2. Executive Summary
- 2.1. Market Snapshot
- 3. Market Dynamics
- 3.1. Market Drivers
- 3.2. Market Restrains
- 3.3. Market Trends
- 3.4. Market Opportunities
- 4. Market Factor Analysis
- 4.1. Porters Five Forces
- 4.1.1. Bargaining Power of Suppliers
- 4.1.2. Bargaining Power of Buyers
- 4.1.3. Threat of New Entrants
- 4.1.4. Threat of Substitutes
- 4.1.5. Competitive Rivalry
- 4.2. PESTEL analysis
- 4.3. BCG Analysis
- 4.3.1. Stars (High Growth, High Market Share)
- 4.3.2. Cash Cows (Low Growth, High Market Share)
- 4.3.3. Question Mark (High Growth, Low Market Share)
- 4.3.4. Dogs (Low Growth, Low Market Share)
- 4.4. Ansoff Matrix Analysis
- 4.5. Supply Chain Analysis
- 4.6. Regulatory Landscape
- 4.7. Current Market Potential and Opportunity Assessment (TAM–SAM–SOM Framework)
- 4.8. RAX Analyst Note
- 4.1. Porters Five Forces
- 5. Market Analysis, Insights and Forecast 2021-2033
- 5.1. Market Analysis, Insights and Forecast - by Service
- 5.1.1. Transportation
- 5.1.2. Warehousing and Inventory Management
- 5.1.3. Value-added Services
- 5.2. Market Analysis, Insights and Forecast - by Region
- 5.2.1. North America
- 5.2.2. South America
- 5.2.3. Europe
- 5.2.4. Middle East & Africa
- 5.2.5. Asia Pacific
- 5.1. Market Analysis, Insights and Forecast - by Service
- 6. Global GCC Dangerous Goods Freight Market Analysis, Insights and Forecast, 2021-2033
- 6.1. Market Analysis, Insights and Forecast - by Service
- 6.1.1. Transportation
- 6.1.2. Warehousing and Inventory Management
- 6.1.3. Value-added Services
- 6.1. Market Analysis, Insights and Forecast - by Service
- 7. North America GCC Dangerous Goods Freight Market Analysis, Insights and Forecast, 2020-2032
- 7.1. Market Analysis, Insights and Forecast - by Service
- 7.1.1. Transportation
- 7.1.2. Warehousing and Inventory Management
- 7.1.3. Value-added Services
- 7.1. Market Analysis, Insights and Forecast - by Service
- 8. South America GCC Dangerous Goods Freight Market Analysis, Insights and Forecast, 2020-2032
- 8.1. Market Analysis, Insights and Forecast - by Service
- 8.1.1. Transportation
- 8.1.2. Warehousing and Inventory Management
- 8.1.3. Value-added Services
- 8.1. Market Analysis, Insights and Forecast - by Service
- 9. Europe GCC Dangerous Goods Freight Market Analysis, Insights and Forecast, 2020-2032
- 9.1. Market Analysis, Insights and Forecast - by Service
- 9.1.1. Transportation
- 9.1.2. Warehousing and Inventory Management
- 9.1.3. Value-added Services
- 9.1. Market Analysis, Insights and Forecast - by Service
- 10. Middle East & Africa GCC Dangerous Goods Freight Market Analysis, Insights and Forecast, 2020-2032
- 10.1. Market Analysis, Insights and Forecast - by Service
- 10.1.1. Transportation
- 10.1.2. Warehousing and Inventory Management
- 10.1.3. Value-added Services
- 10.1. Market Analysis, Insights and Forecast - by Service
- 11. Asia Pacific GCC Dangerous Goods Freight Market Analysis, Insights and Forecast, 2020-2032
- 11.1. Market Analysis, Insights and Forecast - by Service
- 11.1.1. Transportation
- 11.1.2. Warehousing and Inventory Management
- 11.1.3. Value-added Services
- 11.1. Market Analysis, Insights and Forecast - by Service
- 12. Competitive Analysis
- 12.1. Company Profiles
- 12.1.1 AAA Freight Services LLC
- 12.1.1.1. Company Overview
- 12.1.1.2. Products
- 12.1.1.3. Company Financials
- 12.1.1.4. SWOT Analysis
- 12.1.2 Hellmann Worldwide Logistics SE & Co
- 12.1.2.1. Company Overview
- 12.1.2.2. Products
- 12.1.2.3. Company Financials
- 12.1.2.4. SWOT Analysis
- 12.1.3 Bertschi AG
- 12.1.3.1. Company Overview
- 12.1.3.2. Products
- 12.1.3.3. Company Financials
- 12.1.3.4. SWOT Analysis
- 12.1.4 GAC
- 12.1.4.1. Company Overview
- 12.1.4.2. Products
- 12.1.4.3. Company Financials
- 12.1.4.4. SWOT Analysis
- 12.1.5 Petrochem
- 12.1.5.1. Company Overview
- 12.1.5.2. Products
- 12.1.5.3. Company Financials
- 12.1.5.4. SWOT Analysis
- 12.1.6 Agility
- 12.1.6.1. Company Overview
- 12.1.6.2. Products
- 12.1.6.3. Company Financials
- 12.1.6.4. SWOT Analysis
- 12.1.7 Al Ghazal Transport UAE**List Not Exhaustive
- 12.1.7.1. Company Overview
- 12.1.7.2. Products
- 12.1.7.3. Company Financials
- 12.1.7.4. SWOT Analysis
- 12.1.8 BDP INTERNATIONAL
- 12.1.8.1. Company Overview
- 12.1.8.2. Products
- 12.1.8.3. Company Financials
- 12.1.8.4. SWOT Analysis
- 12.1.9 Al Futtaim - Logistics
- 12.1.9.1. Company Overview
- 12.1.9.2. Products
- 12.1.9.3. Company Financials
- 12.1.9.4. SWOT Analysis
- 12.1.10 TALKE Group
- 12.1.10.1. Company Overview
- 12.1.10.2. Products
- 12.1.10.3. Company Financials
- 12.1.10.4. SWOT Analysis
- 12.1.1 AAA Freight Services LLC
- 12.2. Market Entropy
- 12.2.1 Company's Key Areas Served
- 12.2.2 Recent Developments
- 12.3. Company Market Share Analysis 2025
- 12.3.1 Top 5 Companies Market Share Analysis
- 12.3.2 Top 3 Companies Market Share Analysis
- 12.4. List of Potential Customers
- 13. Research Methodology
List of Figures
- Figure 1: Global GCC Dangerous Goods Freight Market Revenue Breakdown (Million, %) by Region 2025 & 2033
- Figure 2: North America GCC Dangerous Goods Freight Market Revenue (Million), by Service 2025 & 2033
- Figure 3: North America GCC Dangerous Goods Freight Market Revenue Share (%), by Service 2025 & 2033
- Figure 4: North America GCC Dangerous Goods Freight Market Revenue (Million), by Country 2025 & 2033
- Figure 5: North America GCC Dangerous Goods Freight Market Revenue Share (%), by Country 2025 & 2033
- Figure 6: South America GCC Dangerous Goods Freight Market Revenue (Million), by Service 2025 & 2033
- Figure 7: South America GCC Dangerous Goods Freight Market Revenue Share (%), by Service 2025 & 2033
- Figure 8: South America GCC Dangerous Goods Freight Market Revenue (Million), by Country 2025 & 2033
- Figure 9: South America GCC Dangerous Goods Freight Market Revenue Share (%), by Country 2025 & 2033
- Figure 10: Europe GCC Dangerous Goods Freight Market Revenue (Million), by Service 2025 & 2033
- Figure 11: Europe GCC Dangerous Goods Freight Market Revenue Share (%), by Service 2025 & 2033
- Figure 12: Europe GCC Dangerous Goods Freight Market Revenue (Million), by Country 2025 & 2033
- Figure 13: Europe GCC Dangerous Goods Freight Market Revenue Share (%), by Country 2025 & 2033
- Figure 14: Middle East & Africa GCC Dangerous Goods Freight Market Revenue (Million), by Service 2025 & 2033
- Figure 15: Middle East & Africa GCC Dangerous Goods Freight Market Revenue Share (%), by Service 2025 & 2033
- Figure 16: Middle East & Africa GCC Dangerous Goods Freight Market Revenue (Million), by Country 2025 & 2033
- Figure 17: Middle East & Africa GCC Dangerous Goods Freight Market Revenue Share (%), by Country 2025 & 2033
- Figure 18: Asia Pacific GCC Dangerous Goods Freight Market Revenue (Million), by Service 2025 & 2033
- Figure 19: Asia Pacific GCC Dangerous Goods Freight Market Revenue Share (%), by Service 2025 & 2033
- Figure 20: Asia Pacific GCC Dangerous Goods Freight Market Revenue (Million), by Country 2025 & 2033
- Figure 21: Asia Pacific GCC Dangerous Goods Freight Market Revenue Share (%), by Country 2025 & 2033
List of Tables
- Table 1: Global GCC Dangerous Goods Freight Market Revenue Million Forecast, by Service 2020 & 2033
- Table 2: Global GCC Dangerous Goods Freight Market Revenue Million Forecast, by Region 2020 & 2033
- Table 3: Global GCC Dangerous Goods Freight Market Revenue Million Forecast, by Service 2020 & 2033
- Table 4: Global GCC Dangerous Goods Freight Market Revenue Million Forecast, by Country 2020 & 2033
- Table 5: United States GCC Dangerous Goods Freight Market Revenue (Million) Forecast, by Application 2020 & 2033
- Table 6: Canada GCC Dangerous Goods Freight Market Revenue (Million) Forecast, by Application 2020 & 2033
- Table 7: Mexico GCC Dangerous Goods Freight Market Revenue (Million) Forecast, by Application 2020 & 2033
- Table 8: Global GCC Dangerous Goods Freight Market Revenue Million Forecast, by Service 2020 & 2033
- Table 9: Global GCC Dangerous Goods Freight Market Revenue Million Forecast, by Country 2020 & 2033
- Table 10: Brazil GCC Dangerous Goods Freight Market Revenue (Million) Forecast, by Application 2020 & 2033
- Table 11: Argentina GCC Dangerous Goods Freight Market Revenue (Million) Forecast, by Application 2020 & 2033
- Table 12: Rest of South America GCC Dangerous Goods Freight Market Revenue (Million) Forecast, by Application 2020 & 2033
- Table 13: Global GCC Dangerous Goods Freight Market Revenue Million Forecast, by Service 2020 & 2033
- Table 14: Global GCC Dangerous Goods Freight Market Revenue Million Forecast, by Country 2020 & 2033
- Table 15: United Kingdom GCC Dangerous Goods Freight Market Revenue (Million) Forecast, by Application 2020 & 2033
- Table 16: Germany GCC Dangerous Goods Freight Market Revenue (Million) Forecast, by Application 2020 & 2033
- Table 17: France GCC Dangerous Goods Freight Market Revenue (Million) Forecast, by Application 2020 & 2033
- Table 18: Italy GCC Dangerous Goods Freight Market Revenue (Million) Forecast, by Application 2020 & 2033
- Table 19: Spain GCC Dangerous Goods Freight Market Revenue (Million) Forecast, by Application 2020 & 2033
- Table 20: Russia GCC Dangerous Goods Freight Market Revenue (Million) Forecast, by Application 2020 & 2033
- Table 21: Benelux GCC Dangerous Goods Freight Market Revenue (Million) Forecast, by Application 2020 & 2033
- Table 22: Nordics GCC Dangerous Goods Freight Market Revenue (Million) Forecast, by Application 2020 & 2033
- Table 23: Rest of Europe GCC Dangerous Goods Freight Market Revenue (Million) Forecast, by Application 2020 & 2033
- Table 24: Global GCC Dangerous Goods Freight Market Revenue Million Forecast, by Service 2020 & 2033
- Table 25: Global GCC Dangerous Goods Freight Market Revenue Million Forecast, by Country 2020 & 2033
- Table 26: Turkey GCC Dangerous Goods Freight Market Revenue (Million) Forecast, by Application 2020 & 2033
- Table 27: Israel GCC Dangerous Goods Freight Market Revenue (Million) Forecast, by Application 2020 & 2033
- Table 28: GCC GCC Dangerous Goods Freight Market Revenue (Million) Forecast, by Application 2020 & 2033
- Table 29: North Africa GCC Dangerous Goods Freight Market Revenue (Million) Forecast, by Application 2020 & 2033
- Table 30: South Africa GCC Dangerous Goods Freight Market Revenue (Million) Forecast, by Application 2020 & 2033
- Table 31: Rest of Middle East & Africa GCC Dangerous Goods Freight Market Revenue (Million) Forecast, by Application 2020 & 2033
- Table 32: Global GCC Dangerous Goods Freight Market Revenue Million Forecast, by Service 2020 & 2033
- Table 33: Global GCC Dangerous Goods Freight Market Revenue Million Forecast, by Country 2020 & 2033
- Table 34: China GCC Dangerous Goods Freight Market Revenue (Million) Forecast, by Application 2020 & 2033
- Table 35: India GCC Dangerous Goods Freight Market Revenue (Million) Forecast, by Application 2020 & 2033
- Table 36: Japan GCC Dangerous Goods Freight Market Revenue (Million) Forecast, by Application 2020 & 2033
- Table 37: South Korea GCC Dangerous Goods Freight Market Revenue (Million) Forecast, by Application 2020 & 2033
- Table 38: ASEAN GCC Dangerous Goods Freight Market Revenue (Million) Forecast, by Application 2020 & 2033
- Table 39: Oceania GCC Dangerous Goods Freight Market Revenue (Million) Forecast, by Application 2020 & 2033
- Table 40: Rest of Asia Pacific GCC Dangerous Goods Freight Market Revenue (Million) Forecast, by Application 2020 & 2033
Frequently Asked Questions
1. What is the projected Compound Annual Growth Rate (CAGR) of the GCC Dangerous Goods Freight Market?
The projected CAGR is approximately > 5.00%.
2. Which companies are prominent players in the GCC Dangerous Goods Freight Market?
Key companies in the market include AAA Freight Services LLC, Hellmann Worldwide Logistics SE & Co, Bertschi AG, GAC, Petrochem, Agility, Al Ghazal Transport UAE**List Not Exhaustive, BDP INTERNATIONAL, Al Futtaim - Logistics, TALKE Group.
3. What are the main segments of the GCC Dangerous Goods Freight Market?
The market segments include Service.
4. Can you provide details about the market size?
The market size is estimated to be USD XX Million as of 2022.
5. What are some drivers contributing to market growth?
Growing Chemical and Refinery Industries Driving Market Growth.
6. What are the notable trends driving market growth?
Recovery of Chemical Industry.
7. Are there any restraints impacting market growth?
Challenges in Cross Boarder Shipping.
8. Can you provide examples of recent developments in the market?
June 2023: Magnate Worldwide is pleased to announce the acquisition of Cargo Logistics Group, a leading custom logistics service provider. In line with Magnate's organic and M&A growth strategy, Cargo Logistics Group is highly specialized, providing comprehensive logistics solutions for international and domestic mission-critical supply chains. CLG will become part of Masterpiece International and expand its footprint, adding a direct presence in the Baltimore and Washington DC area
9. What pricing options are available for accessing the report?
Pricing options include single-user, multi-user, and enterprise licenses priced at USD 3800, USD 4500, and USD 5800 respectively.
10. Is the market size provided in terms of value or volume?
The market size is provided in terms of value, measured in Million.
11. Are there any specific market keywords associated with the report?
Yes, the market keyword associated with the report is "GCC Dangerous Goods Freight Market," which aids in identifying and referencing the specific market segment covered.
12. How do I determine which pricing option suits my needs best?
The pricing options vary based on user requirements and access needs. Individual users may opt for single-user licenses, while businesses requiring broader access may choose multi-user or enterprise licenses for cost-effective access to the report.
13. Are there any additional resources or data provided in the GCC Dangerous Goods Freight Market report?
While the report offers comprehensive insights, it's advisable to review the specific contents or supplementary materials provided to ascertain if additional resources or data are available.
14. How can I stay updated on further developments or reports in the GCC Dangerous Goods Freight Market?
To stay informed about further developments, trends, and reports in the GCC Dangerous Goods Freight Market, consider subscribing to industry newsletters, following relevant companies and organizations, or regularly checking reputable industry news sources and publications.
Methodology
Step 1 - Identification of Relevant Samples Size from Population Database


Step 2 - Approaches for Defining Global Market Size (Value, Volume* & Price*)

Note*: In applicable scenarios
Step 3 - Data Sources
Primary Research
- Web Analytics
- Survey Reports
- Research Institute
- Latest Research Reports
- Opinion Leaders
Secondary Research
- Annual Reports
- White Paper
- Latest Press Release
- Industry Association
- Paid Database
- Investor Presentations

Step 4 - Data Triangulation
Involves using different sources of information in order to increase the validity of a study
These sources are likely to be stakeholders in a program - participants, other researchers, program staff, other community members, and so on.
Then we put all data in single framework & apply various statistical tools to find out the dynamic on the market.
During the analysis stage, feedback from the stakeholder groups would be compared to determine areas of agreement as well as areas of divergence