Generative Design Industry Unlocking Growth Opportunities: Analysis and Forecast 2025-2033

Generative Design Industry by Deployment (On-premise, Cloud), by End User Vertical (Automotive, Aerospace and Defense, Architecture and Construction, Industrial Manufacturing, Other End User Verticals), by North America (United States, Canada, Rest of North America), by Europe (Germany, United Kingdom, France, Spain, Rest of Europe), by Asia Pacific (China, Japan, India, Rest of Asia Pacific), by Latin America (Brazil, Argentina, Rest of Latin America), by Middle East and Africa (UAE, Saudi Arabia, South Africa, Rest of Middle East and Africa) Forecast 2025-2033

Aug 25 2025
Base Year: 2024

234 Pages
Main Logo

Generative Design Industry Unlocking Growth Opportunities: Analysis and Forecast 2025-2033


Home
Industries
Technology, Media and Telecom
sponsor image
sponsor image
sponsor image
sponsor image
sponsor image
sponsor image
sponsor image
sponsor image
sponsor image
sponsor image
sponsor image
sponsor image
sponsor image
sponsor image
sponsor image
sponsor image
sponsor image
sponsor image
sponsor image
sponsor image

Tailored for you

  • In-depth Analysis Tailored to Specified Regions or Segments
  • Company Profiles Customized to User Preferences
  • Comprehensive Insights Focused on Specific Segments or Regions
  • Customized Evaluation of Competitive Landscape to Meet Your Needs
  • Tailored Customization to Address Other Specific Requirements
Ask for customization


Key Insights

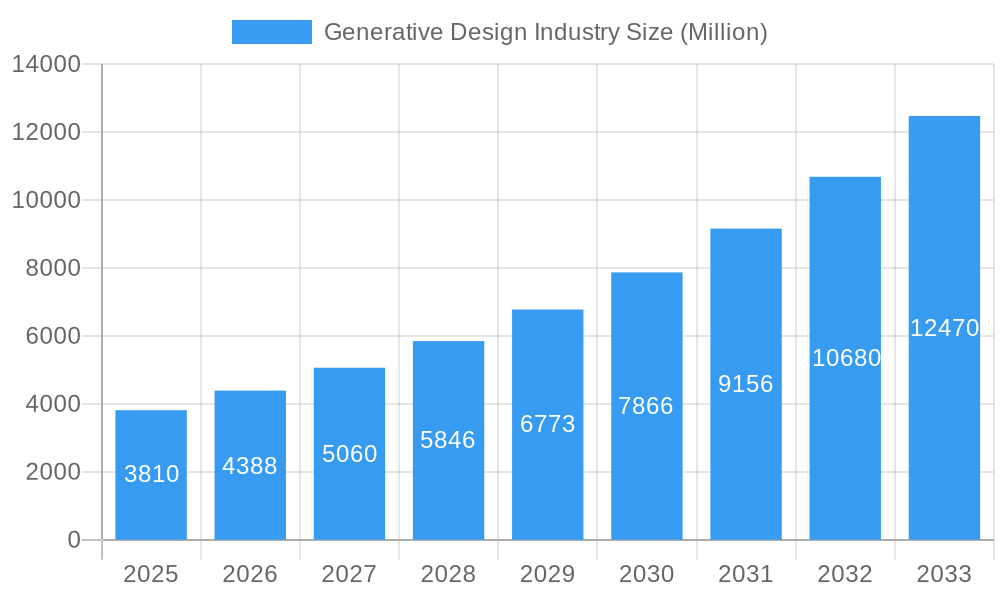
The generative design market is experiencing robust growth, projected to reach $3.81 billion in 2025 and maintain a Compound Annual Growth Rate (CAGR) of 15.41% from 2025 to 2033. This expansion is fueled by several key drivers. Firstly, the increasing need for optimization across various industries, including automotive, aerospace, and manufacturing, is driving adoption. Generative design tools significantly reduce design time and material costs while enhancing product performance and sustainability. Secondly, advancements in artificial intelligence (AI) and machine learning (ML) are continuously improving the capabilities of generative design software, making it more accessible and efficient. This includes improved algorithms for optimization and the integration of advanced simulation tools for more accurate and robust designs. Finally, the growing availability of cloud-based solutions is expanding access to generative design software, particularly for smaller companies and those lacking in-house computational resources.
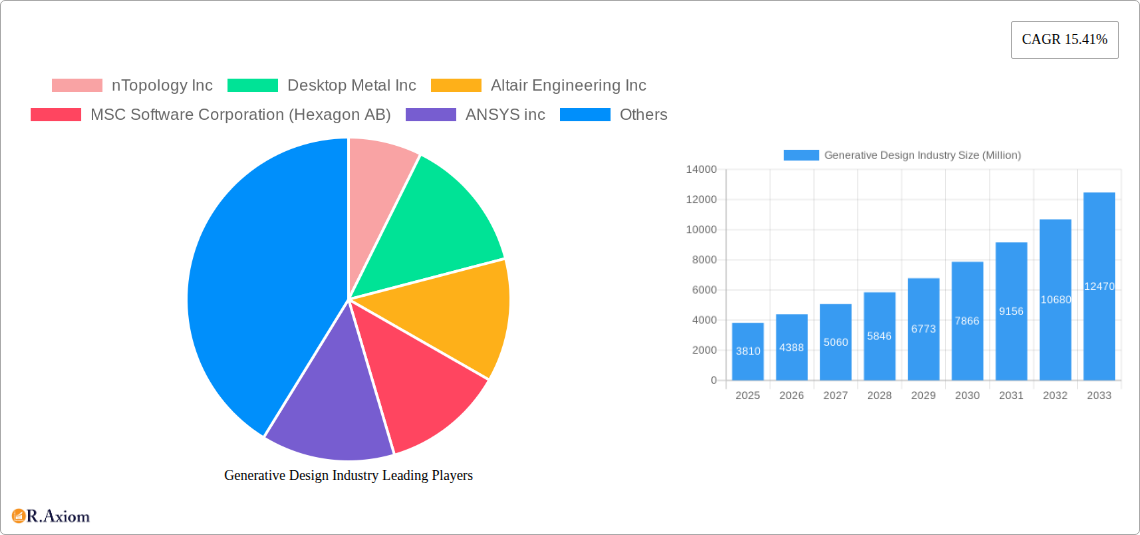
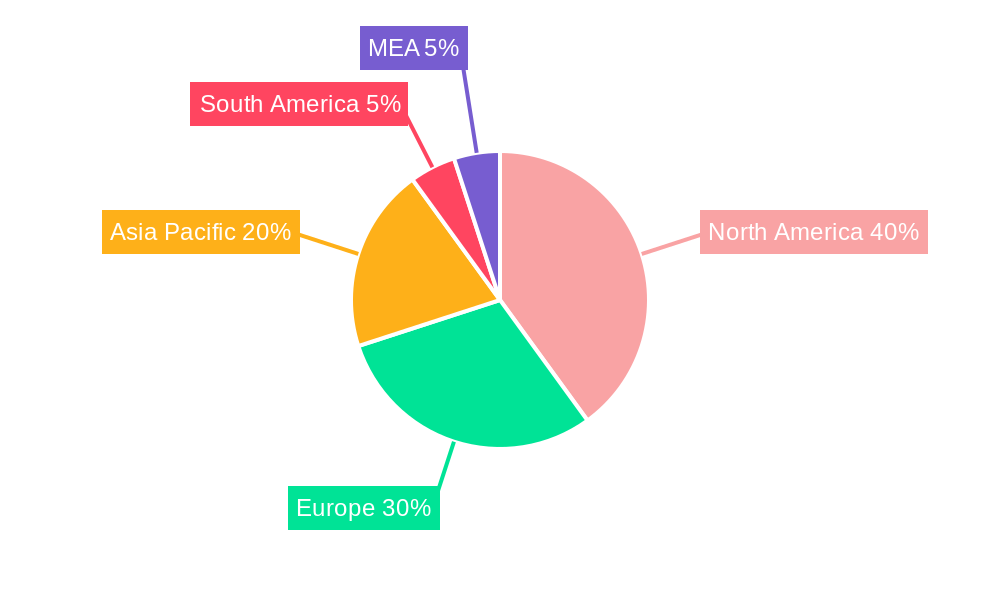
Despite the substantial growth potential, the market faces certain restraints. The high initial investment cost of software and specialized hardware can be a barrier to entry for smaller businesses. Furthermore, a lack of skilled professionals proficient in using these advanced design tools creates a significant hurdle for wider adoption. However, the ongoing development of user-friendly interfaces and the increasing availability of training programs are steadily mitigating these challenges. The market segmentation reveals a strong preference for cloud-based deployment models due to their scalability and cost-effectiveness. The automotive, aerospace, and industrial manufacturing sectors remain the largest consumers of generative design technologies, though architectural and construction applications are also experiencing rapid growth, driven by the need to create efficient and sustainable building designs. The North American market currently holds a significant share, although Asia-Pacific is projected to witness substantial growth in the coming years due to increasing manufacturing activities and technological advancements in the region.

Generative Design Industry Research Report - Market Size, Growth & Forecast

Generative Design Industry: A Comprehensive Market Report (2019-2033)

This comprehensive report provides an in-depth analysis of the Generative Design industry, covering market size, growth drivers, competitive landscape, and future outlook from 2019 to 2033. The study period spans from 2019 to 2033, with 2025 serving as the base and estimated year. The forecast period covers 2025-2033, and the historical period encompasses 2019-2024. The report features detailed segmentation analysis across deployment models (on-premise, cloud), end-user verticals (automotive, aerospace & defense, architecture & construction, industrial manufacturing, others), and leading market players. The report projects a market value of $XX Million by 2033, with a CAGR of XX% during the forecast period.

Generative Design Industry Market Concentration & Innovation

The Generative Design industry is characterized by a moderately concentrated market, with a few key players holding significant market share. While precise market share data for individual companies is commercially sensitive, nTopology Inc, Desktop Metal Inc, Altair Engineering Inc, MSC Software Corporation (Hexagon AB), and ANSYS inc are consistently recognized as leading vendors. The industry exhibits strong innovation drivers, fueled by advancements in AI, machine learning, and additive manufacturing technologies. Regulatory frameworks, particularly concerning data privacy and intellectual property, are evolving and will continue to shape market dynamics. Product substitutes, such as traditional CAD software with advanced optimization tools, pose a competitive challenge. End-user trends towards automation, efficiency, and sustainable design are key growth factors.

The industry has witnessed significant M&A activity in recent years. Notably, the acquisition of ParaMatters by Carbon in August 2022, valued at approximately $XX Million, signifies the increasing consolidation within the space. This deal highlights the strategic importance of generative design capabilities for additive manufacturing companies. Other significant M&A transactions, though not publicly disclosed with precise values, have contributed to shaping the competitive landscape. Further, the successful funding round for Diabatix in January 2022 underscores investor confidence in the potential of AI-driven generative design solutions.

Generative Design Industry Industry Trends & Insights

The Generative Design industry is experiencing rapid growth, driven by several factors. The increasing adoption of additive manufacturing (3D printing) is a primary catalyst, enabling the creation of complex, lightweight, and optimized designs previously impossible with traditional manufacturing methods. Technological disruptions, such as advancements in AI and machine learning algorithms, further enhance the capabilities and efficiency of generative design software. Consumer preferences for customized and sustainable products are pushing manufacturers towards utilizing generative design to optimize product performance and reduce material waste. The competitive dynamics are marked by intense innovation, strategic partnerships, and acquisitions, all contributing to the overall market growth. The market is expected to reach $XX Million in 2025 and grow at a CAGR of XX% during the forecast period, achieving a market penetration rate of XX% by 2033. The high entry barrier due to expertise requirement in algorithm development and software integration is a significant barrier for entrants.

Generative Design Industry Growth

Dominant Markets & Segments in Generative Design Industry

The automotive and aerospace & defense sectors are currently the dominant end-user verticals for generative design, driven by the need for lightweight, high-performance components. The high demand for fuel efficiency and improved safety standards further contributes to this dominance. The industrial manufacturing segment is also experiencing significant growth, with companies adopting generative design to optimize production processes and reduce manufacturing costs. The architecture and construction sector is showing increasing adoption, leveraging generative design for the design of complex and efficient building structures and infrastructure.

  • Key Drivers for Automotive & Aerospace: stringent regulations regarding fuel efficiency, demands for lightweight designs, the need for optimized aerodynamic performance.
  • Key Drivers for Industrial Manufacturing: enhanced production efficiency, reduced manufacturing costs, optimized product design for improved functionality.
  • Key Drivers for Architecture & Construction: optimized structural design, material reduction, cost savings in building construction.

Cloud-based deployment models are gaining traction due to their scalability, accessibility, and cost-effectiveness. However, on-premise deployments continue to be preferred by organizations with high security requirements and sensitive data. While North America currently holds the largest market share, the Asia-Pacific region is expected to witness the fastest growth due to increasing industrialization and technological advancements.

Generative Design Industry Product Developments

Recent product developments focus on enhancing the ease of use, integration with existing CAD/CAM software, and expanding the application scope of generative design software. New features include advanced simulation capabilities, improved optimization algorithms, and automated design workflows. Companies are strategically focusing on developing solutions that cater to specific industry needs, offering customized features and workflows to enhance the market fit. The competitive advantage lies in the efficiency and accuracy of algorithms and the intuitive user interfaces that streamline the design process.

Report Scope & Segmentation Analysis

This report segments the generative design market based on deployment (on-premise and cloud) and end-user verticals (automotive, aerospace and defense, architecture and construction, industrial manufacturing, and others).

Deployment: The on-premise segment currently holds a larger market share due to data security concerns but the cloud segment is projected to experience higher growth due to cost efficiency and accessibility.

End-User Verticals: The automotive sector is expected to remain the largest segment, followed by aerospace and defense. However, the industrial manufacturing sector is expected to showcase significant growth in the coming years. The architecture and construction sector is projected to grow at a slower pace but shows immense potential for future development. The "other" category will encompass diverse sectors adopting generative design solutions. Each segment demonstrates unique growth trajectories and competitive dynamics, influenced by industry-specific factors.

Key Drivers of Generative Design Industry Growth

Several factors contribute to the growth of the generative design industry. Technological advancements in artificial intelligence, machine learning, and additive manufacturing are paramount. The increasing need for product customization and efficient manufacturing processes further fuels market demand. Favorable government policies and investments in research and development are also contributing to the industry's expansion. The automotive and aerospace sectors, in particular, have strong incentives to adopt generative design for weight reduction and improved performance.

Challenges in the Generative Design Industry Sector

Despite the positive growth outlook, challenges remain. The high cost of software and specialized expertise required to utilize these technologies can be a barrier to entry for smaller companies. Integration with existing manufacturing workflows can be complex and time-consuming. Moreover, the relatively nascent nature of this technology means that industry standards and best practices are still evolving, leading to uncertainties. Addressing these challenges will be crucial for sustainable growth.

Emerging Opportunities in Generative Design Industry

Emerging opportunities include expansion into new industries (e.g., consumer goods, healthcare) and integration with other emerging technologies like the metaverse and digital twins. The development of user-friendly software and cloud-based solutions will improve accessibility and adoption rates. The integration of generative design into broader digital design workflows promises to increase efficiency and reduce design cycles. Focus on sustainable design practices will also open new avenues.

Leading Players in the Generative Design Industry Market

  • nTopology Inc
  • Desktop Metal Inc
  • Altair Engineering Inc
  • MSC Software Corporation (Hexagon AB)
  • ANSYS inc
  • Caracol AM
  • Autodesk Inc
  • Dassault Systèmes SE
  • Bentley Systems Inc
  • Paramatters
  • Diabatix

Key Developments in Generative Design Industry Industry

  • August 2022: ParaMatters, a provider of generative design software for additive manufacturing, was acquired by Carbon. This acquisition strengthened Carbon's generative design capabilities for additive manufacturing.
  • January 2022: Diabatix NV, specializing in AI-driven generative thermal design, secured funding from Saffelberg Investments, accelerating the growth of its Coldstream platform.

Strategic Outlook for Generative Design Industry Market

The generative design industry holds immense potential for future growth. Continued technological advancements, coupled with increasing adoption across various industries, will drive market expansion. Focus on ease of use, accessibility, and integration with existing workflows will be crucial for broader market penetration. The industry is poised for significant growth, fueled by the increasing need for efficient, sustainable, and customized product design. Strategic partnerships and collaborations will play a significant role in accelerating innovation and market adoption.

Generative Design Industry Segmentation

  • 1. Deployment
    • 1.1. On-premise
    • 1.2. Cloud
  • 2. End User Vertical
    • 2.1. Automotive
    • 2.2. Aerospace and Defense
    • 2.3. Architecture and Construction
    • 2.4. Industrial Manufacturing
    • 2.5. Other End User Verticals

Generative Design Industry Segmentation By Geography

  • 1. North America
    • 1.1. United States
    • 1.2. Canada
    • 1.3. Rest of North America
  • 2. Europe
    • 2.1. Germany
    • 2.2. United Kingdom
    • 2.3. France
    • 2.4. Spain
    • 2.5. Rest of Europe
  • 3. Asia Pacific
    • 3.1. China
    • 3.2. Japan
    • 3.3. India
    • 3.4. Rest of Asia Pacific
  • 4. Latin America
    • 4.1. Brazil
    • 4.2. Argentina
    • 4.3. Rest of Latin America
  • 5. Middle East and Africa
    • 5.1. UAE
    • 5.2. Saudi Arabia
    • 5.3. South Africa
    • 5.4. Rest of Middle East and Africa
Generative Design Industry Regional Share


Generative Design Industry REPORT HIGHLIGHTS

AspectsDetails
Study Period 2019-2033
Base Year 2024
Estimated Year 2025
Forecast Period2025-2033
Historical Period2019-2024
Growth RateCAGR of 15.41% from 2019-2033
Segmentation
    • By Deployment
      • On-premise
      • Cloud
    • By End User Vertical
      • Automotive
      • Aerospace and Defense
      • Architecture and Construction
      • Industrial Manufacturing
      • Other End User Verticals
  • By Geography
    • North America
      • United States
      • Canada
      • Rest of North America
    • Europe
      • Germany
      • United Kingdom
      • France
      • Spain
      • Rest of Europe
    • Asia Pacific
      • China
      • Japan
      • India
      • Rest of Asia Pacific
    • Latin America
      • Brazil
      • Argentina
      • Rest of Latin America
    • Middle East and Africa
      • UAE
      • Saudi Arabia
      • South Africa
      • Rest of Middle East and Africa


Table of Contents

  1. 1. Introduction
    • 1.1. Research Scope
    • 1.2. Market Segmentation
    • 1.3. Research Methodology
    • 1.4. Definitions and Assumptions
  2. 2. Executive Summary
    • 2.1. Introduction
  3. 3. Market Dynamics
    • 3.1. Introduction
      • 3.2. Market Drivers
        • 3.2.1. Rise in latest technology in automobile segment to boost the market; Growing Demand for Advanced Technologies to Drive Product Innovation and Production Efficiency
      • 3.3. Market Restrains
        • 3.3.1. Fluctuating Market Demands and Customization Issues
      • 3.4. Market Trends
        • 3.4.1. Automotive To Hold Significant Share
  4. 4. Market Factor Analysis
    • 4.1. Porters Five Forces
    • 4.2. Supply/Value Chain
    • 4.3. PESTEL analysis
    • 4.4. Market Entropy
    • 4.5. Patent/Trademark Analysis
  5. 5. Global Generative Design Industry Analysis, Insights and Forecast, 2019-2031
    • 5.1. Market Analysis, Insights and Forecast - by Deployment
      • 5.1.1. On-premise
      • 5.1.2. Cloud
    • 5.2. Market Analysis, Insights and Forecast - by End User Vertical
      • 5.2.1. Automotive
      • 5.2.2. Aerospace and Defense
      • 5.2.3. Architecture and Construction
      • 5.2.4. Industrial Manufacturing
      • 5.2.5. Other End User Verticals
    • 5.3. Market Analysis, Insights and Forecast - by Region
      • 5.3.1. North America
      • 5.3.2. Europe
      • 5.3.3. Asia Pacific
      • 5.3.4. Latin America
      • 5.3.5. Middle East and Africa
  6. 6. North America Generative Design Industry Analysis, Insights and Forecast, 2019-2031
    • 6.1. Market Analysis, Insights and Forecast - by Deployment
      • 6.1.1. On-premise
      • 6.1.2. Cloud
    • 6.2. Market Analysis, Insights and Forecast - by End User Vertical
      • 6.2.1. Automotive
      • 6.2.2. Aerospace and Defense
      • 6.2.3. Architecture and Construction
      • 6.2.4. Industrial Manufacturing
      • 6.2.5. Other End User Verticals
  7. 7. Europe Generative Design Industry Analysis, Insights and Forecast, 2019-2031
    • 7.1. Market Analysis, Insights and Forecast - by Deployment
      • 7.1.1. On-premise
      • 7.1.2. Cloud
    • 7.2. Market Analysis, Insights and Forecast - by End User Vertical
      • 7.2.1. Automotive
      • 7.2.2. Aerospace and Defense
      • 7.2.3. Architecture and Construction
      • 7.2.4. Industrial Manufacturing
      • 7.2.5. Other End User Verticals
  8. 8. Asia Pacific Generative Design Industry Analysis, Insights and Forecast, 2019-2031
    • 8.1. Market Analysis, Insights and Forecast - by Deployment
      • 8.1.1. On-premise
      • 8.1.2. Cloud
    • 8.2. Market Analysis, Insights and Forecast - by End User Vertical
      • 8.2.1. Automotive
      • 8.2.2. Aerospace and Defense
      • 8.2.3. Architecture and Construction
      • 8.2.4. Industrial Manufacturing
      • 8.2.5. Other End User Verticals
  9. 9. Latin America Generative Design Industry Analysis, Insights and Forecast, 2019-2031
    • 9.1. Market Analysis, Insights and Forecast - by Deployment
      • 9.1.1. On-premise
      • 9.1.2. Cloud
    • 9.2. Market Analysis, Insights and Forecast - by End User Vertical
      • 9.2.1. Automotive
      • 9.2.2. Aerospace and Defense
      • 9.2.3. Architecture and Construction
      • 9.2.4. Industrial Manufacturing
      • 9.2.5. Other End User Verticals
  10. 10. Middle East and Africa Generative Design Industry Analysis, Insights and Forecast, 2019-2031
    • 10.1. Market Analysis, Insights and Forecast - by Deployment
      • 10.1.1. On-premise
      • 10.1.2. Cloud
    • 10.2. Market Analysis, Insights and Forecast - by End User Vertical
      • 10.2.1. Automotive
      • 10.2.2. Aerospace and Defense
      • 10.2.3. Architecture and Construction
      • 10.2.4. Industrial Manufacturing
      • 10.2.5. Other End User Verticals
  11. 11. North America Generative Design Industry Analysis, Insights and Forecast, 2019-2031
      • 11.1. Market Analysis, Insights and Forecast - By Country/Sub-region
        • 11.1.1 United States
        • 11.1.2 Canada
        • 11.1.3 Mexico
  12. 12. Europe Generative Design Industry Analysis, Insights and Forecast, 2019-2031
      • 12.1. Market Analysis, Insights and Forecast - By Country/Sub-region
        • 12.1.1 Germany
        • 12.1.2 United Kingdom
        • 12.1.3 France
        • 12.1.4 Spain
        • 12.1.5 Italy
        • 12.1.6 Spain
        • 12.1.7 Belgium
        • 12.1.8 Netherland
        • 12.1.9 Nordics
        • 12.1.10 Rest of Europe
  13. 13. Asia Pacific Generative Design Industry Analysis, Insights and Forecast, 2019-2031
      • 13.1. Market Analysis, Insights and Forecast - By Country/Sub-region
        • 13.1.1 China
        • 13.1.2 Japan
        • 13.1.3 India
        • 13.1.4 South Korea
        • 13.1.5 Southeast Asia
        • 13.1.6 Australia
        • 13.1.7 Indonesia
        • 13.1.8 Phillipes
        • 13.1.9 Singapore
        • 13.1.10 Thailandc
        • 13.1.11 Rest of Asia Pacific
  14. 14. South America Generative Design Industry Analysis, Insights and Forecast, 2019-2031
      • 14.1. Market Analysis, Insights and Forecast - By Country/Sub-region
        • 14.1.1 Brazil
        • 14.1.2 Argentina
        • 14.1.3 Peru
        • 14.1.4 Chile
        • 14.1.5 Colombia
        • 14.1.6 Ecuador
        • 14.1.7 Venezuela
        • 14.1.8 Rest of South America
  15. 15. North America Generative Design Industry Analysis, Insights and Forecast, 2019-2031
      • 15.1. Market Analysis, Insights and Forecast - By Country/Sub-region
        • 15.1.1 United States
        • 15.1.2 Canada
        • 15.1.3 Mexico
  16. 16. MEA Generative Design Industry Analysis, Insights and Forecast, 2019-2031
      • 16.1. Market Analysis, Insights and Forecast - By Country/Sub-region
        • 16.1.1 United Arab Emirates
        • 16.1.2 Saudi Arabia
        • 16.1.3 South Africa
        • 16.1.4 Rest of Middle East and Africa
  17. 17. Competitive Analysis
    • 17.1. Global Market Share Analysis 2024
      • 17.2. Company Profiles
        • 17.2.1 nTopology Inc
          • 17.2.1.1. Overview
          • 17.2.1.2. Products
          • 17.2.1.3. SWOT Analysis
          • 17.2.1.4. Recent Developments
          • 17.2.1.5. Financials (Based on Availability)
        • 17.2.2 Desktop Metal Inc
          • 17.2.2.1. Overview
          • 17.2.2.2. Products
          • 17.2.2.3. SWOT Analysis
          • 17.2.2.4. Recent Developments
          • 17.2.2.5. Financials (Based on Availability)
        • 17.2.3 Altair Engineering Inc
          • 17.2.3.1. Overview
          • 17.2.3.2. Products
          • 17.2.3.3. SWOT Analysis
          • 17.2.3.4. Recent Developments
          • 17.2.3.5. Financials (Based on Availability)
        • 17.2.4 MSC Software Corporation (Hexagon AB)
          • 17.2.4.1. Overview
          • 17.2.4.2. Products
          • 17.2.4.3. SWOT Analysis
          • 17.2.4.4. Recent Developments
          • 17.2.4.5. Financials (Based on Availability)
        • 17.2.5 ANSYS inc
          • 17.2.5.1. Overview
          • 17.2.5.2. Products
          • 17.2.5.3. SWOT Analysis
          • 17.2.5.4. Recent Developments
          • 17.2.5.5. Financials (Based on Availability)
        • 17.2.6 Caracol AM
          • 17.2.6.1. Overview
          • 17.2.6.2. Products
          • 17.2.6.3. SWOT Analysis
          • 17.2.6.4. Recent Developments
          • 17.2.6.5. Financials (Based on Availability)
        • 17.2.7 Autodesk Inc
          • 17.2.7.1. Overview
          • 17.2.7.2. Products
          • 17.2.7.3. SWOT Analysis
          • 17.2.7.4. Recent Developments
          • 17.2.7.5. Financials (Based on Availability)
        • 17.2.8 Dassault Systèmes SE
          • 17.2.8.1. Overview
          • 17.2.8.2. Products
          • 17.2.8.3. SWOT Analysis
          • 17.2.8.4. Recent Developments
          • 17.2.8.5. Financials (Based on Availability)
        • 17.2.9 Bentley Systems Inc
          • 17.2.9.1. Overview
          • 17.2.9.2. Products
          • 17.2.9.3. SWOT Analysis
          • 17.2.9.4. Recent Developments
          • 17.2.9.5. Financials (Based on Availability)
        • 17.2.10 Paramatters
          • 17.2.10.1. Overview
          • 17.2.10.2. Products
          • 17.2.10.3. SWOT Analysis
          • 17.2.10.4. Recent Developments
          • 17.2.10.5. Financials (Based on Availability)
        • 17.2.11 Diabatix
          • 17.2.11.1. Overview
          • 17.2.11.2. Products
          • 17.2.11.3. SWOT Analysis
          • 17.2.11.4. Recent Developments
          • 17.2.11.5. Financials (Based on Availability)

List of Figures

  1. Figure 1: Global Generative Design Industry Revenue Breakdown (Million, %) by Region 2024 & 2032
  2. Figure 2: Global Generative Design Industry Volume Breakdown (K Unit, %) by Region 2024 & 2032
  3. Figure 3: North America Generative Design Industry Revenue (Million), by Country 2024 & 2032
  4. Figure 4: North America Generative Design Industry Volume (K Unit), by Country 2024 & 2032
  5. Figure 5: North America Generative Design Industry Revenue Share (%), by Country 2024 & 2032
  6. Figure 6: North America Generative Design Industry Volume Share (%), by Country 2024 & 2032
  7. Figure 7: Europe Generative Design Industry Revenue (Million), by Country 2024 & 2032
  8. Figure 8: Europe Generative Design Industry Volume (K Unit), by Country 2024 & 2032
  9. Figure 9: Europe Generative Design Industry Revenue Share (%), by Country 2024 & 2032
  10. Figure 10: Europe Generative Design Industry Volume Share (%), by Country 2024 & 2032
  11. Figure 11: Asia Pacific Generative Design Industry Revenue (Million), by Country 2024 & 2032
  12. Figure 12: Asia Pacific Generative Design Industry Volume (K Unit), by Country 2024 & 2032
  13. Figure 13: Asia Pacific Generative Design Industry Revenue Share (%), by Country 2024 & 2032
  14. Figure 14: Asia Pacific Generative Design Industry Volume Share (%), by Country 2024 & 2032
  15. Figure 15: South America Generative Design Industry Revenue (Million), by Country 2024 & 2032
  16. Figure 16: South America Generative Design Industry Volume (K Unit), by Country 2024 & 2032
  17. Figure 17: South America Generative Design Industry Revenue Share (%), by Country 2024 & 2032
  18. Figure 18: South America Generative Design Industry Volume Share (%), by Country 2024 & 2032
  19. Figure 19: North America Generative Design Industry Revenue (Million), by Country 2024 & 2032
  20. Figure 20: North America Generative Design Industry Volume (K Unit), by Country 2024 & 2032
  21. Figure 21: North America Generative Design Industry Revenue Share (%), by Country 2024 & 2032
  22. Figure 22: North America Generative Design Industry Volume Share (%), by Country 2024 & 2032
  23. Figure 23: MEA Generative Design Industry Revenue (Million), by Country 2024 & 2032
  24. Figure 24: MEA Generative Design Industry Volume (K Unit), by Country 2024 & 2032
  25. Figure 25: MEA Generative Design Industry Revenue Share (%), by Country 2024 & 2032
  26. Figure 26: MEA Generative Design Industry Volume Share (%), by Country 2024 & 2032
  27. Figure 27: North America Generative Design Industry Revenue (Million), by Deployment 2024 & 2032
  28. Figure 28: North America Generative Design Industry Volume (K Unit), by Deployment 2024 & 2032
  29. Figure 29: North America Generative Design Industry Revenue Share (%), by Deployment 2024 & 2032
  30. Figure 30: North America Generative Design Industry Volume Share (%), by Deployment 2024 & 2032
  31. Figure 31: North America Generative Design Industry Revenue (Million), by End User Vertical 2024 & 2032
  32. Figure 32: North America Generative Design Industry Volume (K Unit), by End User Vertical 2024 & 2032
  33. Figure 33: North America Generative Design Industry Revenue Share (%), by End User Vertical 2024 & 2032
  34. Figure 34: North America Generative Design Industry Volume Share (%), by End User Vertical 2024 & 2032
  35. Figure 35: North America Generative Design Industry Revenue (Million), by Country 2024 & 2032
  36. Figure 36: North America Generative Design Industry Volume (K Unit), by Country 2024 & 2032
  37. Figure 37: North America Generative Design Industry Revenue Share (%), by Country 2024 & 2032
  38. Figure 38: North America Generative Design Industry Volume Share (%), by Country 2024 & 2032
  39. Figure 39: Europe Generative Design Industry Revenue (Million), by Deployment 2024 & 2032
  40. Figure 40: Europe Generative Design Industry Volume (K Unit), by Deployment 2024 & 2032
  41. Figure 41: Europe Generative Design Industry Revenue Share (%), by Deployment 2024 & 2032
  42. Figure 42: Europe Generative Design Industry Volume Share (%), by Deployment 2024 & 2032
  43. Figure 43: Europe Generative Design Industry Revenue (Million), by End User Vertical 2024 & 2032
  44. Figure 44: Europe Generative Design Industry Volume (K Unit), by End User Vertical 2024 & 2032
  45. Figure 45: Europe Generative Design Industry Revenue Share (%), by End User Vertical 2024 & 2032
  46. Figure 46: Europe Generative Design Industry Volume Share (%), by End User Vertical 2024 & 2032
  47. Figure 47: Europe Generative Design Industry Revenue (Million), by Country 2024 & 2032
  48. Figure 48: Europe Generative Design Industry Volume (K Unit), by Country 2024 & 2032
  49. Figure 49: Europe Generative Design Industry Revenue Share (%), by Country 2024 & 2032
  50. Figure 50: Europe Generative Design Industry Volume Share (%), by Country 2024 & 2032
  51. Figure 51: Asia Pacific Generative Design Industry Revenue (Million), by Deployment 2024 & 2032
  52. Figure 52: Asia Pacific Generative Design Industry Volume (K Unit), by Deployment 2024 & 2032
  53. Figure 53: Asia Pacific Generative Design Industry Revenue Share (%), by Deployment 2024 & 2032
  54. Figure 54: Asia Pacific Generative Design Industry Volume Share (%), by Deployment 2024 & 2032
  55. Figure 55: Asia Pacific Generative Design Industry Revenue (Million), by End User Vertical 2024 & 2032
  56. Figure 56: Asia Pacific Generative Design Industry Volume (K Unit), by End User Vertical 2024 & 2032
  57. Figure 57: Asia Pacific Generative Design Industry Revenue Share (%), by End User Vertical 2024 & 2032
  58. Figure 58: Asia Pacific Generative Design Industry Volume Share (%), by End User Vertical 2024 & 2032
  59. Figure 59: Asia Pacific Generative Design Industry Revenue (Million), by Country 2024 & 2032
  60. Figure 60: Asia Pacific Generative Design Industry Volume (K Unit), by Country 2024 & 2032
  61. Figure 61: Asia Pacific Generative Design Industry Revenue Share (%), by Country 2024 & 2032
  62. Figure 62: Asia Pacific Generative Design Industry Volume Share (%), by Country 2024 & 2032
  63. Figure 63: Latin America Generative Design Industry Revenue (Million), by Deployment 2024 & 2032
  64. Figure 64: Latin America Generative Design Industry Volume (K Unit), by Deployment 2024 & 2032
  65. Figure 65: Latin America Generative Design Industry Revenue Share (%), by Deployment 2024 & 2032
  66. Figure 66: Latin America Generative Design Industry Volume Share (%), by Deployment 2024 & 2032
  67. Figure 67: Latin America Generative Design Industry Revenue (Million), by End User Vertical 2024 & 2032
  68. Figure 68: Latin America Generative Design Industry Volume (K Unit), by End User Vertical 2024 & 2032
  69. Figure 69: Latin America Generative Design Industry Revenue Share (%), by End User Vertical 2024 & 2032
  70. Figure 70: Latin America Generative Design Industry Volume Share (%), by End User Vertical 2024 & 2032
  71. Figure 71: Latin America Generative Design Industry Revenue (Million), by Country 2024 & 2032
  72. Figure 72: Latin America Generative Design Industry Volume (K Unit), by Country 2024 & 2032
  73. Figure 73: Latin America Generative Design Industry Revenue Share (%), by Country 2024 & 2032
  74. Figure 74: Latin America Generative Design Industry Volume Share (%), by Country 2024 & 2032
  75. Figure 75: Middle East and Africa Generative Design Industry Revenue (Million), by Deployment 2024 & 2032
  76. Figure 76: Middle East and Africa Generative Design Industry Volume (K Unit), by Deployment 2024 & 2032
  77. Figure 77: Middle East and Africa Generative Design Industry Revenue Share (%), by Deployment 2024 & 2032
  78. Figure 78: Middle East and Africa Generative Design Industry Volume Share (%), by Deployment 2024 & 2032
  79. Figure 79: Middle East and Africa Generative Design Industry Revenue (Million), by End User Vertical 2024 & 2032
  80. Figure 80: Middle East and Africa Generative Design Industry Volume (K Unit), by End User Vertical 2024 & 2032
  81. Figure 81: Middle East and Africa Generative Design Industry Revenue Share (%), by End User Vertical 2024 & 2032
  82. Figure 82: Middle East and Africa Generative Design Industry Volume Share (%), by End User Vertical 2024 & 2032
  83. Figure 83: Middle East and Africa Generative Design Industry Revenue (Million), by Country 2024 & 2032
  84. Figure 84: Middle East and Africa Generative Design Industry Volume (K Unit), by Country 2024 & 2032
  85. Figure 85: Middle East and Africa Generative Design Industry Revenue Share (%), by Country 2024 & 2032
  86. Figure 86: Middle East and Africa Generative Design Industry Volume Share (%), by Country 2024 & 2032

List of Tables

  1. Table 1: Global Generative Design Industry Revenue Million Forecast, by Region 2019 & 2032
  2. Table 2: Global Generative Design Industry Volume K Unit Forecast, by Region 2019 & 2032
  3. Table 3: Global Generative Design Industry Revenue Million Forecast, by Deployment 2019 & 2032
  4. Table 4: Global Generative Design Industry Volume K Unit Forecast, by Deployment 2019 & 2032
  5. Table 5: Global Generative Design Industry Revenue Million Forecast, by End User Vertical 2019 & 2032
  6. Table 6: Global Generative Design Industry Volume K Unit Forecast, by End User Vertical 2019 & 2032
  7. Table 7: Global Generative Design Industry Revenue Million Forecast, by Region 2019 & 2032
  8. Table 8: Global Generative Design Industry Volume K Unit Forecast, by Region 2019 & 2032
  9. Table 9: Global Generative Design Industry Revenue Million Forecast, by Country 2019 & 2032
  10. Table 10: Global Generative Design Industry Volume K Unit Forecast, by Country 2019 & 2032
  11. Table 11: United States Generative Design Industry Revenue (Million) Forecast, by Application 2019 & 2032
  12. Table 12: United States Generative Design Industry Volume (K Unit) Forecast, by Application 2019 & 2032
  13. Table 13: Canada Generative Design Industry Revenue (Million) Forecast, by Application 2019 & 2032
  14. Table 14: Canada Generative Design Industry Volume (K Unit) Forecast, by Application 2019 & 2032
  15. Table 15: Mexico Generative Design Industry Revenue (Million) Forecast, by Application 2019 & 2032
  16. Table 16: Mexico Generative Design Industry Volume (K Unit) Forecast, by Application 2019 & 2032
  17. Table 17: Global Generative Design Industry Revenue Million Forecast, by Country 2019 & 2032
  18. Table 18: Global Generative Design Industry Volume K Unit Forecast, by Country 2019 & 2032
  19. Table 19: Germany Generative Design Industry Revenue (Million) Forecast, by Application 2019 & 2032
  20. Table 20: Germany Generative Design Industry Volume (K Unit) Forecast, by Application 2019 & 2032
  21. Table 21: United Kingdom Generative Design Industry Revenue (Million) Forecast, by Application 2019 & 2032
  22. Table 22: United Kingdom Generative Design Industry Volume (K Unit) Forecast, by Application 2019 & 2032
  23. Table 23: France Generative Design Industry Revenue (Million) Forecast, by Application 2019 & 2032
  24. Table 24: France Generative Design Industry Volume (K Unit) Forecast, by Application 2019 & 2032
  25. Table 25: Spain Generative Design Industry Revenue (Million) Forecast, by Application 2019 & 2032
  26. Table 26: Spain Generative Design Industry Volume (K Unit) Forecast, by Application 2019 & 2032
  27. Table 27: Italy Generative Design Industry Revenue (Million) Forecast, by Application 2019 & 2032
  28. Table 28: Italy Generative Design Industry Volume (K Unit) Forecast, by Application 2019 & 2032
  29. Table 29: Spain Generative Design Industry Revenue (Million) Forecast, by Application 2019 & 2032
  30. Table 30: Spain Generative Design Industry Volume (K Unit) Forecast, by Application 2019 & 2032
  31. Table 31: Belgium Generative Design Industry Revenue (Million) Forecast, by Application 2019 & 2032
  32. Table 32: Belgium Generative Design Industry Volume (K Unit) Forecast, by Application 2019 & 2032
  33. Table 33: Netherland Generative Design Industry Revenue (Million) Forecast, by Application 2019 & 2032
  34. Table 34: Netherland Generative Design Industry Volume (K Unit) Forecast, by Application 2019 & 2032
  35. Table 35: Nordics Generative Design Industry Revenue (Million) Forecast, by Application 2019 & 2032
  36. Table 36: Nordics Generative Design Industry Volume (K Unit) Forecast, by Application 2019 & 2032
  37. Table 37: Rest of Europe Generative Design Industry Revenue (Million) Forecast, by Application 2019 & 2032
  38. Table 38: Rest of Europe Generative Design Industry Volume (K Unit) Forecast, by Application 2019 & 2032
  39. Table 39: Global Generative Design Industry Revenue Million Forecast, by Country 2019 & 2032
  40. Table 40: Global Generative Design Industry Volume K Unit Forecast, by Country 2019 & 2032
  41. Table 41: China Generative Design Industry Revenue (Million) Forecast, by Application 2019 & 2032
  42. Table 42: China Generative Design Industry Volume (K Unit) Forecast, by Application 2019 & 2032
  43. Table 43: Japan Generative Design Industry Revenue (Million) Forecast, by Application 2019 & 2032
  44. Table 44: Japan Generative Design Industry Volume (K Unit) Forecast, by Application 2019 & 2032
  45. Table 45: India Generative Design Industry Revenue (Million) Forecast, by Application 2019 & 2032
  46. Table 46: India Generative Design Industry Volume (K Unit) Forecast, by Application 2019 & 2032
  47. Table 47: South Korea Generative Design Industry Revenue (Million) Forecast, by Application 2019 & 2032
  48. Table 48: South Korea Generative Design Industry Volume (K Unit) Forecast, by Application 2019 & 2032
  49. Table 49: Southeast Asia Generative Design Industry Revenue (Million) Forecast, by Application 2019 & 2032
  50. Table 50: Southeast Asia Generative Design Industry Volume (K Unit) Forecast, by Application 2019 & 2032
  51. Table 51: Australia Generative Design Industry Revenue (Million) Forecast, by Application 2019 & 2032
  52. Table 52: Australia Generative Design Industry Volume (K Unit) Forecast, by Application 2019 & 2032
  53. Table 53: Indonesia Generative Design Industry Revenue (Million) Forecast, by Application 2019 & 2032
  54. Table 54: Indonesia Generative Design Industry Volume (K Unit) Forecast, by Application 2019 & 2032
  55. Table 55: Phillipes Generative Design Industry Revenue (Million) Forecast, by Application 2019 & 2032
  56. Table 56: Phillipes Generative Design Industry Volume (K Unit) Forecast, by Application 2019 & 2032
  57. Table 57: Singapore Generative Design Industry Revenue (Million) Forecast, by Application 2019 & 2032
  58. Table 58: Singapore Generative Design Industry Volume (K Unit) Forecast, by Application 2019 & 2032
  59. Table 59: Thailandc Generative Design Industry Revenue (Million) Forecast, by Application 2019 & 2032
  60. Table 60: Thailandc Generative Design Industry Volume (K Unit) Forecast, by Application 2019 & 2032
  61. Table 61: Rest of Asia Pacific Generative Design Industry Revenue (Million) Forecast, by Application 2019 & 2032
  62. Table 62: Rest of Asia Pacific Generative Design Industry Volume (K Unit) Forecast, by Application 2019 & 2032
  63. Table 63: Global Generative Design Industry Revenue Million Forecast, by Country 2019 & 2032
  64. Table 64: Global Generative Design Industry Volume K Unit Forecast, by Country 2019 & 2032
  65. Table 65: Brazil Generative Design Industry Revenue (Million) Forecast, by Application 2019 & 2032
  66. Table 66: Brazil Generative Design Industry Volume (K Unit) Forecast, by Application 2019 & 2032
  67. Table 67: Argentina Generative Design Industry Revenue (Million) Forecast, by Application 2019 & 2032
  68. Table 68: Argentina Generative Design Industry Volume (K Unit) Forecast, by Application 2019 & 2032
  69. Table 69: Peru Generative Design Industry Revenue (Million) Forecast, by Application 2019 & 2032
  70. Table 70: Peru Generative Design Industry Volume (K Unit) Forecast, by Application 2019 & 2032
  71. Table 71: Chile Generative Design Industry Revenue (Million) Forecast, by Application 2019 & 2032
  72. Table 72: Chile Generative Design Industry Volume (K Unit) Forecast, by Application 2019 & 2032
  73. Table 73: Colombia Generative Design Industry Revenue (Million) Forecast, by Application 2019 & 2032
  74. Table 74: Colombia Generative Design Industry Volume (K Unit) Forecast, by Application 2019 & 2032
  75. Table 75: Ecuador Generative Design Industry Revenue (Million) Forecast, by Application 2019 & 2032
  76. Table 76: Ecuador Generative Design Industry Volume (K Unit) Forecast, by Application 2019 & 2032
  77. Table 77: Venezuela Generative Design Industry Revenue (Million) Forecast, by Application 2019 & 2032
  78. Table 78: Venezuela Generative Design Industry Volume (K Unit) Forecast, by Application 2019 & 2032
  79. Table 79: Rest of South America Generative Design Industry Revenue (Million) Forecast, by Application 2019 & 2032
  80. Table 80: Rest of South America Generative Design Industry Volume (K Unit) Forecast, by Application 2019 & 2032
  81. Table 81: Global Generative Design Industry Revenue Million Forecast, by Country 2019 & 2032
  82. Table 82: Global Generative Design Industry Volume K Unit Forecast, by Country 2019 & 2032
  83. Table 83: United States Generative Design Industry Revenue (Million) Forecast, by Application 2019 & 2032
  84. Table 84: United States Generative Design Industry Volume (K Unit) Forecast, by Application 2019 & 2032
  85. Table 85: Canada Generative Design Industry Revenue (Million) Forecast, by Application 2019 & 2032
  86. Table 86: Canada Generative Design Industry Volume (K Unit) Forecast, by Application 2019 & 2032
  87. Table 87: Mexico Generative Design Industry Revenue (Million) Forecast, by Application 2019 & 2032
  88. Table 88: Mexico Generative Design Industry Volume (K Unit) Forecast, by Application 2019 & 2032
  89. Table 89: Global Generative Design Industry Revenue Million Forecast, by Country 2019 & 2032
  90. Table 90: Global Generative Design Industry Volume K Unit Forecast, by Country 2019 & 2032
  91. Table 91: United Arab Emirates Generative Design Industry Revenue (Million) Forecast, by Application 2019 & 2032
  92. Table 92: United Arab Emirates Generative Design Industry Volume (K Unit) Forecast, by Application 2019 & 2032
  93. Table 93: Saudi Arabia Generative Design Industry Revenue (Million) Forecast, by Application 2019 & 2032
  94. Table 94: Saudi Arabia Generative Design Industry Volume (K Unit) Forecast, by Application 2019 & 2032
  95. Table 95: South Africa Generative Design Industry Revenue (Million) Forecast, by Application 2019 & 2032
  96. Table 96: South Africa Generative Design Industry Volume (K Unit) Forecast, by Application 2019 & 2032
  97. Table 97: Rest of Middle East and Africa Generative Design Industry Revenue (Million) Forecast, by Application 2019 & 2032
  98. Table 98: Rest of Middle East and Africa Generative Design Industry Volume (K Unit) Forecast, by Application 2019 & 2032
  99. Table 99: Global Generative Design Industry Revenue Million Forecast, by Deployment 2019 & 2032
  100. Table 100: Global Generative Design Industry Volume K Unit Forecast, by Deployment 2019 & 2032
  101. Table 101: Global Generative Design Industry Revenue Million Forecast, by End User Vertical 2019 & 2032
  102. Table 102: Global Generative Design Industry Volume K Unit Forecast, by End User Vertical 2019 & 2032
  103. Table 103: Global Generative Design Industry Revenue Million Forecast, by Country 2019 & 2032
  104. Table 104: Global Generative Design Industry Volume K Unit Forecast, by Country 2019 & 2032
  105. Table 105: United States Generative Design Industry Revenue (Million) Forecast, by Application 2019 & 2032
  106. Table 106: United States Generative Design Industry Volume (K Unit) Forecast, by Application 2019 & 2032
  107. Table 107: Canada Generative Design Industry Revenue (Million) Forecast, by Application 2019 & 2032
  108. Table 108: Canada Generative Design Industry Volume (K Unit) Forecast, by Application 2019 & 2032
  109. Table 109: Rest of North America Generative Design Industry Revenue (Million) Forecast, by Application 2019 & 2032
  110. Table 110: Rest of North America Generative Design Industry Volume (K Unit) Forecast, by Application 2019 & 2032
  111. Table 111: Global Generative Design Industry Revenue Million Forecast, by Deployment 2019 & 2032
  112. Table 112: Global Generative Design Industry Volume K Unit Forecast, by Deployment 2019 & 2032
  113. Table 113: Global Generative Design Industry Revenue Million Forecast, by End User Vertical 2019 & 2032
  114. Table 114: Global Generative Design Industry Volume K Unit Forecast, by End User Vertical 2019 & 2032
  115. Table 115: Global Generative Design Industry Revenue Million Forecast, by Country 2019 & 2032
  116. Table 116: Global Generative Design Industry Volume K Unit Forecast, by Country 2019 & 2032
  117. Table 117: Germany Generative Design Industry Revenue (Million) Forecast, by Application 2019 & 2032
  118. Table 118: Germany Generative Design Industry Volume (K Unit) Forecast, by Application 2019 & 2032
  119. Table 119: United Kingdom Generative Design Industry Revenue (Million) Forecast, by Application 2019 & 2032
  120. Table 120: United Kingdom Generative Design Industry Volume (K Unit) Forecast, by Application 2019 & 2032
  121. Table 121: France Generative Design Industry Revenue (Million) Forecast, by Application 2019 & 2032
  122. Table 122: France Generative Design Industry Volume (K Unit) Forecast, by Application 2019 & 2032
  123. Table 123: Spain Generative Design Industry Revenue (Million) Forecast, by Application 2019 & 2032
  124. Table 124: Spain Generative Design Industry Volume (K Unit) Forecast, by Application 2019 & 2032
  125. Table 125: Rest of Europe Generative Design Industry Revenue (Million) Forecast, by Application 2019 & 2032
  126. Table 126: Rest of Europe Generative Design Industry Volume (K Unit) Forecast, by Application 2019 & 2032
  127. Table 127: Global Generative Design Industry Revenue Million Forecast, by Deployment 2019 & 2032
  128. Table 128: Global Generative Design Industry Volume K Unit Forecast, by Deployment 2019 & 2032
  129. Table 129: Global Generative Design Industry Revenue Million Forecast, by End User Vertical 2019 & 2032
  130. Table 130: Global Generative Design Industry Volume K Unit Forecast, by End User Vertical 2019 & 2032
  131. Table 131: Global Generative Design Industry Revenue Million Forecast, by Country 2019 & 2032
  132. Table 132: Global Generative Design Industry Volume K Unit Forecast, by Country 2019 & 2032
  133. Table 133: China Generative Design Industry Revenue (Million) Forecast, by Application 2019 & 2032
  134. Table 134: China Generative Design Industry Volume (K Unit) Forecast, by Application 2019 & 2032
  135. Table 135: Japan Generative Design Industry Revenue (Million) Forecast, by Application 2019 & 2032
  136. Table 136: Japan Generative Design Industry Volume (K Unit) Forecast, by Application 2019 & 2032
  137. Table 137: India Generative Design Industry Revenue (Million) Forecast, by Application 2019 & 2032
  138. Table 138: India Generative Design Industry Volume (K Unit) Forecast, by Application 2019 & 2032
  139. Table 139: Rest of Asia Pacific Generative Design Industry Revenue (Million) Forecast, by Application 2019 & 2032
  140. Table 140: Rest of Asia Pacific Generative Design Industry Volume (K Unit) Forecast, by Application 2019 & 2032
  141. Table 141: Global Generative Design Industry Revenue Million Forecast, by Deployment 2019 & 2032
  142. Table 142: Global Generative Design Industry Volume K Unit Forecast, by Deployment 2019 & 2032
  143. Table 143: Global Generative Design Industry Revenue Million Forecast, by End User Vertical 2019 & 2032
  144. Table 144: Global Generative Design Industry Volume K Unit Forecast, by End User Vertical 2019 & 2032
  145. Table 145: Global Generative Design Industry Revenue Million Forecast, by Country 2019 & 2032
  146. Table 146: Global Generative Design Industry Volume K Unit Forecast, by Country 2019 & 2032
  147. Table 147: Brazil Generative Design Industry Revenue (Million) Forecast, by Application 2019 & 2032
  148. Table 148: Brazil Generative Design Industry Volume (K Unit) Forecast, by Application 2019 & 2032
  149. Table 149: Argentina Generative Design Industry Revenue (Million) Forecast, by Application 2019 & 2032
  150. Table 150: Argentina Generative Design Industry Volume (K Unit) Forecast, by Application 2019 & 2032
  151. Table 151: Rest of Latin America Generative Design Industry Revenue (Million) Forecast, by Application 2019 & 2032
  152. Table 152: Rest of Latin America Generative Design Industry Volume (K Unit) Forecast, by Application 2019 & 2032
  153. Table 153: Global Generative Design Industry Revenue Million Forecast, by Deployment 2019 & 2032
  154. Table 154: Global Generative Design Industry Volume K Unit Forecast, by Deployment 2019 & 2032
  155. Table 155: Global Generative Design Industry Revenue Million Forecast, by End User Vertical 2019 & 2032
  156. Table 156: Global Generative Design Industry Volume K Unit Forecast, by End User Vertical 2019 & 2032
  157. Table 157: Global Generative Design Industry Revenue Million Forecast, by Country 2019 & 2032
  158. Table 158: Global Generative Design Industry Volume K Unit Forecast, by Country 2019 & 2032
  159. Table 159: UAE Generative Design Industry Revenue (Million) Forecast, by Application 2019 & 2032
  160. Table 160: UAE Generative Design Industry Volume (K Unit) Forecast, by Application 2019 & 2032
  161. Table 161: Saudi Arabia Generative Design Industry Revenue (Million) Forecast, by Application 2019 & 2032
  162. Table 162: Saudi Arabia Generative Design Industry Volume (K Unit) Forecast, by Application 2019 & 2032
  163. Table 163: South Africa Generative Design Industry Revenue (Million) Forecast, by Application 2019 & 2032
  164. Table 164: South Africa Generative Design Industry Volume (K Unit) Forecast, by Application 2019 & 2032
  165. Table 165: Rest of Middle East and Africa Generative Design Industry Revenue (Million) Forecast, by Application 2019 & 2032
  166. Table 166: Rest of Middle East and Africa Generative Design Industry Volume (K Unit) Forecast, by Application 2019 & 2032


Frequently Asked Questions

1. What is the projected Compound Annual Growth Rate (CAGR) of the Generative Design Industry?

The projected CAGR is approximately 15.41%.

2. Which companies are prominent players in the Generative Design Industry?

Key companies in the market include nTopology Inc, Desktop Metal Inc, Altair Engineering Inc, MSC Software Corporation (Hexagon AB), ANSYS inc, Caracol AM, Autodesk Inc, Dassault Systèmes SE, Bentley Systems Inc, Paramatters, Diabatix.

3. What are the main segments of the Generative Design Industry?

The market segments include Deployment, End User Vertical.

4. Can you provide details about the market size?

The market size is estimated to be USD 3.81 Million as of 2022.

5. What are some drivers contributing to market growth?

Rise in latest technology in automobile segment to boost the market; Growing Demand for Advanced Technologies to Drive Product Innovation and Production Efficiency.

6. What are the notable trends driving market growth?

Automotive To Hold Significant Share.

7. Are there any restraints impacting market growth?

Fluctuating Market Demands and Customization Issues.

8. Can you provide examples of recent developments in the market?

August 2022 - The provider of generative design software for additive manufacturing, ParaMatters, was acquired by Carbon, a company that develops technology for 3D printing. This acquisition would add topology optimization to Carbon's present software capabilities. Carbon could use the ParaMatters software to increase its generative design capabilities for additive manufacturing.

9. What pricing options are available for accessing the report?

Pricing options include single-user, multi-user, and enterprise licenses priced at USD 4750, USD 5250, and USD 8750 respectively.

10. Is the market size provided in terms of value or volume?

The market size is provided in terms of value, measured in Million and volume, measured in K Unit.

11. Are there any specific market keywords associated with the report?

Yes, the market keyword associated with the report is "Generative Design Industry," which aids in identifying and referencing the specific market segment covered.

12. How do I determine which pricing option suits my needs best?

The pricing options vary based on user requirements and access needs. Individual users may opt for single-user licenses, while businesses requiring broader access may choose multi-user or enterprise licenses for cost-effective access to the report.

13. Are there any additional resources or data provided in the Generative Design Industry report?

While the report offers comprehensive insights, it's advisable to review the specific contents or supplementary materials provided to ascertain if additional resources or data are available.

14. How can I stay updated on further developments or reports in the Generative Design Industry?

To stay informed about further developments, trends, and reports in the Generative Design Industry, consider subscribing to industry newsletters, following relevant companies and organizations, or regularly checking reputable industry news sources and publications.


Methodology

Step 1 - Identification of Relevant Samples Size from Population Database

Step Chart
Bar Chart
Method Chart

Step 2 - Approaches for Defining Global Market Size (Value, Volume* & Price*)

Approach Chart
Top-down and bottom-up approaches are used to validate the global market size and estimate the market size for manufactures, regional segments, product, and application.

Note*: In applicable scenarios

Step 3 - Data Sources

Primary Research

  • Web Analytics
  • Survey Reports
  • Research Institute
  • Latest Research Reports
  • Opinion Leaders

Secondary Research

  • Annual Reports
  • White Paper
  • Latest Press Release
  • Industry Association
  • Paid Database
  • Investor Presentations
Analyst Chart

Step 4 - Data Triangulation

Involves using different sources of information in order to increase the validity of a study

These sources are likely to be stakeholders in a program - participants, other researchers, program staff, other community members, and so on.

Then we put all data in single framework & apply various statistical tools to find out the dynamic on the market.

During the analysis stage, feedback from the stakeholder groups would be compared to determine areas of agreement as well as areas of divergence

Additionally, after gathering mixed and scattered data from a wide range of sources, data is triangulated and correlated to come up with estimated figures which are further validated through primary mediums or industry experts, opinion leaders.

About Research Axiom

Research Axiom delivers in-depth market research, industry analysis, and consulting for pharmaceuticals, automotive, IT, and consumer goods. Our reports provide the clarity you need to make informed decisions and drive innovation.

Our team combines primary research, advanced analytics, and sector expertise to deliver actionable intelligence. We offer syndicated reports, custom research, and consulting services tailored to your business needs.

At Research Axiom, we are committed to quality, transparency, and client satisfaction. Every report is rigorously validated to ensure accuracy and relevance. Our global perspective and local expertise help you understand both the big picture and the finer details of your market.

Stay informed with Research Axiom. Subscribe to our newsletter for the latest updates and research highlights, and follow us on social media for real-time insights. Research Axiom – Turning Data into Business Advantage.

artwork spiralartwork spiralRelated Reports
artwork underline

Exploring Consumer Shifts in Pipeline Transportation Software Market Market 2025-2033

The size of the Pipeline Transportation Software Market market was valued at USD 96.29 Million in 2024 and is projected to reach USD 166.42 Million by 2033, with an expected CAGR of 8.13% during the forecast period.

December 2025
Base Year: 2024
No Of Pages: 234
Price: $4750

Outsourcing Services Market Is Set To Reach XXX Million By 2033, Growing At A CAGR Of XX

Explore the global Outsourcing Services Market analysis, including market size, CAGR of 6.40%, key drivers, trends, and segments like BPO, ITO, and KPO. Get insights into regional growth and leading companies.

December 2025
Base Year: 2024
No Of Pages: 234
Price: $4750

Exploring Innovations in Passive Biometrics Verification Industry: Market Dynamics 2025-2033

Discover the explosive growth of the Passive Biometrics Verification market, driven by AI, cloud adoption, and the need for seamless security. Explore market size, CAGR, drivers, and leading companies shaping the future of authentication.

December 2025
Base Year: 2024
No Of Pages: 234
Price: $4750

Analyzing Competitor Moves: Africa Data Center Server Market Growth Outlook 2025-2033

The size of the Africa Data Center Server Market market was valued at USD XX Million in 2024 and is projected to reach USD XXX Million by 2033, with an expected CAGR of 15.40% during the forecast period.

December 2025
Base Year: 2024
No Of Pages: 234
Price: $4750

Vietnam Data Center Rack Market Market’s Strategic Roadmap: Insights for 2025-2033

The size of the Vietnam Data Center Rack Market market was valued at USD XX Million in 2024 and is projected to reach USD XXX Million by 2033, with an expected CAGR of 7.70% during the forecast period.

December 2025
Base Year: 2024
No Of Pages: 197
Price: $3800

Professional Microphone Market Industry Analysis and Consumer Behavior

The size of the Professional Microphone Market market was valued at USD XX Million in 2024 and is projected to reach USD XXX Million by 2033, with an expected CAGR of 5.80% during the forecast period.

December 2025
Base Year: 2024
No Of Pages: 234
Price: $4750

Market Deep Dive: Exploring India Industrial Sensors and Transmitters Market Trends 2025-2033

Explore the booming India industrial sensors and transmitters market, projected at $1.25 billion with a 9.37% CAGR. Discover key drivers, trends, and segments fueling this growth.

December 2025
Base Year: 2024
No Of Pages: 197
Price: $3800

Strategic Growth Drivers for Infrastructure Monitoring Market Software Market Market

Explore the dynamic Infrastructure Monitoring Market Software, projected for significant growth driven by digital transformation and smart technologies. Discover key trends, drivers, and regional market share.

December 2025
Base Year: 2024
No Of Pages: 234
Price: $4750

Latin America Smartwatch Industry Market Consumption Trends: Growth Analysis 2025-2033

The size of the Latin America Smartwatch Industry market was valued at USD XX Million in 2024 and is projected to reach USD XXX Million by 2033, with an expected CAGR of 13.40% during the forecast period.

December 2025
Base Year: 2024
No Of Pages: 210
Price: $4750

ANZ Geospatial Analytics Market Market Overview: Growth and Insights

Explore the booming ANZ Geospatial Analytics Market, forecast to reach USD 1.33 billion by 2033 with a 9.13% CAGR. Discover key drivers, trends, and segments shaping this vital industry.

December 2025
Base Year: 2024
No Of Pages: 210
Price: $4750

BLE Beacon Industry Analysis Uncovered: Market Drivers and Forecasts 2025-2033

Explore the booming BLE Beacon market, driven by retail innovation, smart cities, and advanced indoor positioning. Discover market size, CAGR, key drivers, and regional trends shaping this dynamic industry.

December 2025
Base Year: 2024
No Of Pages: 234
Price: $4750

Growth Trajectories in US Electrical Enclosures Industry: Industry Outlook to 2033

The size of the US Electrical Enclosures Industry market was valued at USD 1.95 Million in 2024 and is projected to reach USD 3.32 Million by 2033, with an expected CAGR of 7.91% during the forecast period.

December 2025
Base Year: 2024
No Of Pages: 197
Price: $3800

Exploring Consumer Shifts in US Marketing Analytics Industry Market 2025-2033

The size of the US Marketing Analytics Industry market was valued at USD 4.66 Million in 2024 and is projected to reach USD XXX Million by 2033, with an expected CAGR of 12.73">> 12.73% during the forecast period.

December 2025
Base Year: 2024
No Of Pages: 197
Price: $3800

VCSEL Market Market Expansion: Growth Outlook 2025-2033

Explore the booming VCSEL market, projected for 18.60% CAGR growth through 2033. Discover key drivers like 5G, AI, and autonomous vehicles, and analyze growth in telecom, automotive, and consumer electronics.

December 2025
Base Year: 2024
No Of Pages: 234
Price: $4750

Cone Crushers Industry Market Size and Trends 2025-2033: Comprehensive Outlook

The size of the Cone Crushers Industry market was valued at USD 1.86 Million in 2024 and is projected to reach USD 2.63 Million by 2033, with an expected CAGR of 5.10% during the forecast period.

December 2025
Base Year: 2024
No Of Pages: 234
Price: $4750

Exploring SEA Digital Transformation Market Growth Trajectories: CAGR Insights 2025-2033

Explore the dynamic global digital transformation market, projected to reach $53.96 billion with a 19.51% CAGR. Discover key drivers like XR, IoT, AI, Blockchain, and emerging trends shaping industries from manufacturing to healthcare.

December 2025
Base Year: 2024
No Of Pages: 197
Price: $3800

Albania E-commerce Industry Market’s Consumer Insights and Trends

Explore the booming Albania e-commerce market with a projected CAGR of 11.90%. Discover key drivers, emerging trends in beauty, fashion, and electronics, and expert insights for businesses and consumers.

December 2025
Base Year: 2024
No Of Pages: 197
Price: $3800

M2M Connections Industry Growth Opportunities: Market Size Forecast to 2033

The size of the M2M Connections Industry market was valued at USD 37.30 Million in 2024 and is projected to reach USD 60.84 Million by 2033, with an expected CAGR of 7.24% during the forecast period.

December 2025
Base Year: 2024
No Of Pages: 234
Price: $4750

Market Deep Dive: Exploring Smart Food Logistics Market Trends 2025-2033

Explore the rapidly growing Smart Food Logistics Market, projected to reach $13.80 billion with a 14.61% CAGR. Discover key drivers, technologies like IoT and AI, and market trends impacting food supply chain efficiency and safety.

December 2025
Base Year: 2024
No Of Pages: 234
Price: $4750

Demand Patterns in Latvia Facility Management Market Market: Projections to 2033

Explore the dynamic Latvia Facility Management market analysis, key insights, market size, drivers, and trends from 2019-2033. Discover growth opportunities in integrated FM solutions.

December 2025
Base Year: 2024
No Of Pages: 197
Price: $3800

Future-Forward Strategies for Asia Pacific LED Packaging Market Industry

Explore the dynamic Asia Pacific LED Packaging Market, projected to reach over USD 12,500 million by 2025. Discover key growth drivers, segment insights (COB, SMD, CSP), leading companies, and future trends shaping this 6.70% CAGR market through 2033.

December 2025
Base Year: 2024
No Of Pages: 210
Price: $4750

Strategic Projections for Smart E-Drive Market Market Expansion

Explore the dynamic Smart E-Drive market forecast, drivers, and trends from 2019-2033. Discover key insights, market size, and regional analysis for AC drives, DC drives, and servo drives.

December 2025
Base Year: 2024
No Of Pages: 234
Price: $4750

Smart Garage Door Opener And Controller Market Market Demand Dynamics: Insights 2025-2033

Explore the booming Smart Garage Door Opener and Controller Market trends, driven by security and convenience. Discover market size, CAGR 9.43%, and growth drivers like Wi-Fi and Bluetooth technology.

December 2025
Base Year: 2024
No Of Pages: 234
Price: $4750

Night Vision Cameras Market Insightful Analysis: Trends, Competitor Dynamics, and Opportunities 2025-2033

The size of the Night Vision Cameras Market market was valued at USD 5.82 Million in 2024 and is projected to reach USD 12.69 Million by 2033, with an expected CAGR of 11.78% during the forecast period.

December 2025
Base Year: 2024
No Of Pages: 234
Price: $4750

Kenya ICT Market in Emerging Markets: Analysis and Projections 2025-2033

Explore the booming Kenyan ICT market analysis, highlighting key drivers like digital transformation in BFSI and government. Discover market size, CAGR, trends in cloud, AI, and telecommunication services, and challenges for SMEs.

November 2025
Base Year: 2024
No Of Pages: 197
Price: $3800

MEMS-Based Oscillator Industry: Competitive Landscape and Growth Trends 2025-2033

Explore the rapidly expanding MEMS-Based Oscillator Market, projected to reach over \$1.5 billion by 2033 with a remarkable 28.76% CAGR. Discover key drivers like IoT, automotive ADAS, and consumer electronics, alongside dominant segments and regional growth.

November 2025
Base Year: 2024
No Of Pages: 234
Price: $4750

United Arab Emirates Data Center Networking Market Future-Proofing Growth: Strategic Insights and Analysis 2025-2033

Explore the booming UAE data center networking market, projecting 14.40% CAGR to reach over $500M by 2033. Key drivers include cloud adoption, AI, and smart city initiatives. Get market size, growth, and key trends.

November 2025
Base Year: 2024
No Of Pages: 197
Price: $3800

Understanding Consumer Behavior in Cannabis Lighting Industry Market: 2025-2033

The size of the Cannabis Lighting Industry market was valued at USD XX Million in 2024 and is projected to reach USD XXX Million by 2033, with an expected CAGR of 7.60% during the forecast period.

November 2025
Base Year: 2024
No Of Pages: 234
Price: $4750

Emerging Europe Smart Card Industry Trends and Opportunities

The size of the Europe Smart Card Industry market was valued at USD XX Million in 2024 and is projected to reach USD XXX Million by 2033, with an expected CAGR of 3.80% during the forecast period.

November 2025
Base Year: 2024
No Of Pages: 210
Price: $4750

Strategic Analysis of Push Buttons & Signaling Devices Industry Market Growth 2025-2033

Explore the dynamic Push Buttons & Signaling Devices market, driven by industrial automation and IIoT integration. Discover key insights, growth drivers, and regional trends from 2019-2033.

November 2025
Base Year: 2024
No Of Pages: 234
Price: $4750

Exploring Barriers in Behavioral Biometrics Market Market: Trends and Analysis 2025-2033

The size of the Behavioral Biometrics Market market was valued at USD 2.13 Million in 2024 and is projected to reach USD 11.76 Million by 2033, with an expected CAGR of 27.64% during the forecast period.

November 2025
Base Year: 2024
No Of Pages: 234
Price: $4750

Overcoming Challenges in Nigeria Data Center Market Market: Strategic Insights 2025-2033

The size of the Nigeria Data Center Market market was valued at USD XX Million in 2024 and is projected to reach USD XXX Million by 2033, with an expected CAGR of 21.06% during the forecast period.

November 2025
Base Year: 2024
No Of Pages: 197
Price: $3800

Key Drivers for South Africa Data Center Storage Market Market Growth: Projections 2025-2033

Explore the dynamic South Africa Data Center Storage Market. Uncover key growth drivers, emerging trends like All-Flash and Hybrid Storage, and market size projections up to 2033. Essential insights for IT leaders and investors in this rapidly evolving sector.

November 2025
Base Year: 2024
No Of Pages: 197
Price: $3800

Neuromarketing Market 2025-2033 Trends: Unveiling Growth Opportunities and Competitor Dynamics

Explore the rapidly expanding Neuromarketing market, projected to reach \$1.57 billion by 2025 with an 8.89% CAGR. Discover key drivers, trends, restraints, and leading companies revolutionizing consumer insights across BFSI, retail, and more.

November 2025
Base Year: 2024
No Of Pages: 234
Price: $4750

Strategic Analysis of Global Payroll Services Market Industry Opportunities

Explore the booming Global Payroll Services Market! Discover key insights, market size of USD 26.60 million, and a strong 4.56% CAGR. Understand drivers, trends, restraints, and dominant players like ADP and Workday shaping the future of payroll processing for small, medium, and large businesses.

November 2025
Base Year: 2024
No Of Pages: 234
Price: $4750

Consumer Trends in Biometrics-as-a-Service Industry Market 2025-2033

The size of the Biometrics-as-a-Service Industry market was valued at USD XX Million in 2024 and is projected to reach USD XXX Million by 2033, with an expected CAGR of 22.76% during the forecast period.

November 2025
Base Year: 2024
No Of Pages: 234
Price: $4750

Spain Data Center Physical Security Market XX CAGR Growth Analysis 2025-2033

Explore the dynamic Spain Data Center Physical Security Market. Discover key insights, growth drivers, and trends shaping the €30.60M market with a 15.90% CAGR through 2033. Leading solutions include video surveillance and access control.

November 2025
Base Year: 2024
No Of Pages: 197
Price: $3800

Asia Pacific Smartphone Camera Lens Market Market’s Technological Evolution: Trends and Analysis 2025-2033

Explore the dynamic Asia Pacific smartphone camera lens market, driven by innovation and demand for advanced mobile photography. Discover key insights, market size, CAGR, drivers, restraints, and leading companies shaping the future of smartphone optics.

November 2025
Base Year: 2024
No Of Pages: 210
Price: $4750

Latin America Wireless Sensors Industry Analysis 2025 and Forecasts 2033: Unveiling Growth Opportunities

The size of the Latin America Wireless Sensors Industry market was valued at USD XX Million in 2024 and is projected to reach USD XXX Million by 2033, with an expected CAGR of 18.50% during the forecast period.

November 2025
Base Year: 2024
No Of Pages: 197
Price: $3800

Strategic Growth Drivers for UK E-Commerce Industry Market

Explore the booming UK E-Commerce market forecast: £280.55M by 2025 with a 21.76% CAGR. Discover key drivers, trends, restraints, and top companies shaping online retail in the UK.

November 2025
Base Year: 2024
No Of Pages: 197
Price: $3800

Unveiling APAC LiDAR Industry Growth Patterns: CAGR Analysis and Forecasts 2025-2033

Explore the booming APAC LiDAR market: Drivers, trends, key players, and projections for autonomous driving, engineering, and industrial applications. Get detailed market size and growth forecasts for 2025-2033.

November 2025
Base Year: 2024
No Of Pages: 197
Price: $3800

Robots Market for Commercial Buildings Soars to XXX Million, witnessing a CAGR of XX during the forecast period 2025-2033

Explore the booming Robots Market for Commercial Buildings, projected to reach $25.18 billion by 2033 with a staggering 25.70% CAGR. Discover key drivers, segment insights, and regional growth.

November 2025
Base Year: 2024
No Of Pages: 234
Price: $4750

Automated 3D Printing Market Growth Opportunities: Market Size Forecast to 2033

The size of the Automated 3D Printing Market market was valued at USD 2.13 Million in 2024 and is projected to reach USD 18.80 Million by 2033, with an expected CAGR of 36.49% during the forecast period.

November 2025
Base Year: 2024
No Of Pages: 234
Price: $4750

Analyzing Competitor Moves: X Ray Machine Manufacturing Industry Growth Outlook 2025-2033

Explore the dynamic X-ray machine manufacturing industry forecast (2025-2033) with a CAGR of 5.69%. Discover market size, growth drivers, key segments (digital X-ray, portable X-ray), leading companies, and regional trends in healthcare and beyond.

November 2025
Base Year: 2024
No Of Pages: 234
Price: $4750

Market Deep Dive: Exploring Romania Cybersecurity Market Trends 2025-2033

Explore the booming Romanian cybersecurity market, projected to reach USD 175.15 million by 2025 with a 10.89% CAGR. Discover key drivers, growth trends, and leading segments in this vital industry.

November 2025
Base Year: 2024
No Of Pages: 197
Price: $3800

Comprehensive Overview of User Activity Monitoring Industry Trends: 2025-2033

The size of the User Activity Monitoring Industry market was valued at USD XX Million in 2024 and is projected to reach USD XXX Million by 2033, with an expected CAGR of 22.10% during the forecast period.

November 2025
Base Year: 2024
No Of Pages: 234
Price: $4750

Saudi Arabia POS Terminal Industry Unlocking Growth Potential: Analysis and Forecasts 2025-2033

Explore the booming Saudi Arabia POS Terminal Market, driven by Vision 2030, digital transformation, and rising demand for mobile payment solutions. Discover key trends, market size, and growth forecasts.

November 2025
Base Year: 2024
No Of Pages: 197
Price: $3800

Emerging Markets Driving China Real Time Payments Industry Growth

Explore the booming China Real-Time Payments Industry. Discover market size, CAGR, key drivers like mobile payments & digital economy growth, and emerging trends. Get insights into P2P & P2B segments and leading companies.

November 2025
Base Year: 2024
No Of Pages: 197
Price: $3800

Comprehensive Review of Long Range Identification and Tracking Market Growth Potential

Explore the burgeoning Long Range Identification and Tracking (LRIT) market, driven by maritime security needs and regulatory compliance. Discover market size, CAGR, key drivers, trends, restraints, and segments, with forecasts up to 2033.

November 2025
Base Year: 2024
No Of Pages: 234
Price: $4750

Thailand Data Center Networking Market Growth Forecast and Consumer Insights

Explore the Thailand Data Center Networking Market's growth forecast, key drivers, and trends up to 2033. Discover insights on Ethernet switches, routers, SAN, and services vital for IT, BFSI, and government sectors.

November 2025
Base Year: 2024
No Of Pages: 197
Price: $3800
  • Home
  • About Us
  • Industries
    • Packaging
    • Retail
    • Hospitality and Tourism
    • Agriculture
    • Manufacturing Products and Services
    • Healthcare
    • Logistics
    • Aerospace & Defense
    • Chemicals & Materials
    • Professional and Commercial Services
    • Financial Services and Investment Intelligence
    • Food & Beverage
    • Consumer Goods and Services
    • Animal Nutrition & Wellness
    • Technology, Media and Telecom
    • Real Estate and Construction
    • Automotive
    • Home and Property Improvement
    • Energy & Power
  • Services
  • Contact
Main Logo
  • Home
  • About Us
  • Industries
    • Packaging
    • Retail
    • Hospitality and Tourism
    • Agriculture
    • Manufacturing Products and Services
    • Healthcare
    • Logistics
    • Aerospace & Defense
    • Chemicals & Materials
    • Professional and Commercial Services
    • Financial Services and Investment Intelligence
    • Food & Beverage
    • Consumer Goods and Services
    • Animal Nutrition & Wellness
    • Technology, Media and Telecom
    • Real Estate and Construction
    • Automotive
    • Home and Property Improvement
    • Energy & Power
  • Services
  • Contact
+17162654855
[email protected]

+17162654855

[email protected]

Business Address

Head Office

Ansec House 3 rd floor Tank Road, Yerwada, Pune, Maharashtra 411014

Contact Information

Craig Francis

Business Development Head

+17162654855

[email protected]

Secure Payment Partners

payment image
RetailPackagingLogisticsHealthcareAutomotiveAgricultureEnergy & PowerFood & BeverageAerospace & DefenseChemicals & MaterialsHospitality and TourismConsumer Goods and ServicesAnimal Nutrition & WellnessReal Estate and ConstructionTechnology, Media and TelecomHome and Property ImprovementManufacturing Products and ServicesFinancial Services and Investment Intelligence

© 2025 PRDUA Research & Media Private Limited, All rights reserved

Privacy Policy
Terms and Conditions
FAQ