

Key Insights
The global autonomous taxi market is poised for significant expansion, fueled by increasing urbanization, demand for efficient mobility, and advancements in self-driving technology. The projected CAGR of 99.1% from 2019 to 2024 underscores rapid market growth and innovation. The integration of electric and hybrid powertrains further supports sustainability objectives and operational cost reductions. While regulatory frameworks, public safety perceptions, and infrastructure development present challenges, the market's potential is substantial. Diverse service models, including rental and station-based options, cater to varied consumer needs. Market segmentation by autonomy level (Level 3 to Level 5), vehicle type (cars, vans/shuttles), and application (passenger and goods transport) highlights industry versatility and multiple revenue streams. Leading companies such as Waymo, Cruise, and Didi Chuxing are instrumental in driving innovation and competition. North America and Asia Pacific currently lead market development due to technological progress and supportive regulations, with Europe emerging as a significant growth region.
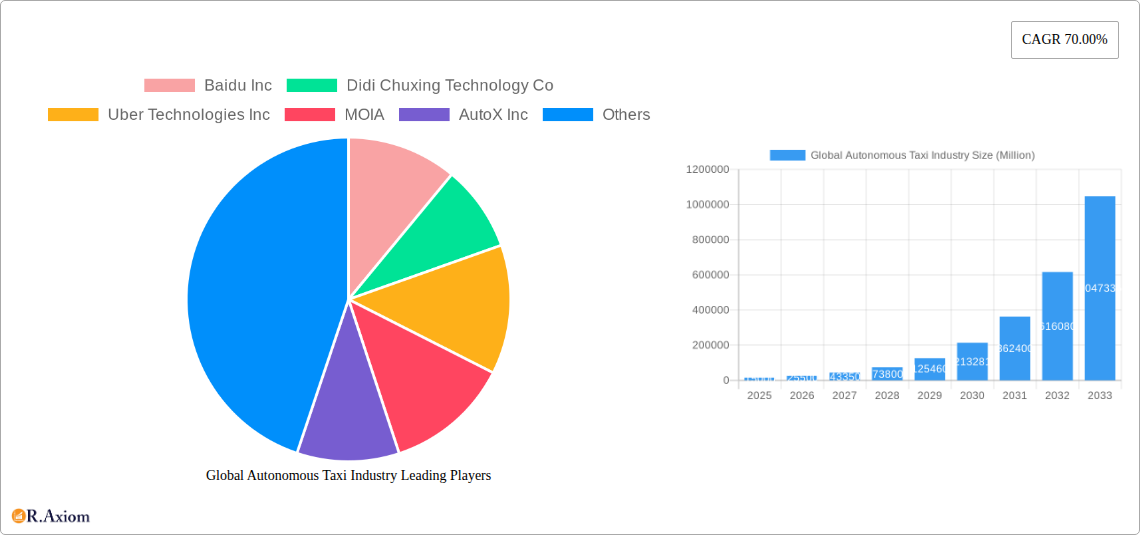
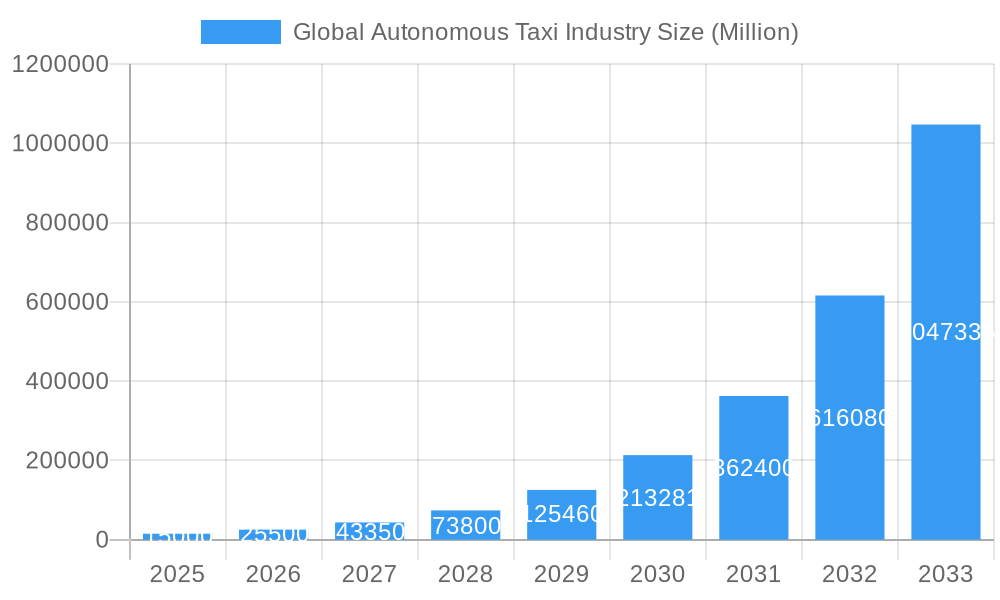
Global Autonomous Taxi Industry Market Size (In Million)
The forecast period from 2025 to 2033 anticipates sustained market growth, contingent upon technological breakthroughs, regulatory approvals, and consumer acceptance. Expect industry consolidation, strategic alliances, and a heightened focus on data security and privacy. Key growth drivers will include the development of robust autonomous vehicle infrastructure, including charging solutions for electric autonomous taxis, alongside addressing public safety and ethical considerations. Continuous advancements in sensor technology, mapping, and artificial intelligence will propel this transformative sector, redefining urban transportation.
Global Autonomous Taxi Industry Company Market Share
This comprehensive report offers critical insights into the Global Autonomous Taxi Industry for investors, stakeholders, and strategic planners. Covering 2019-2033 with a focus on 2025, it details market trends, competitive dynamics, technological evolution, and future growth prospects. Based on rigorous analysis, the market size is projected to reach $0.61 billion by 2033.
Global Autonomous Taxi Industry Market Concentration & Innovation
This section analyzes the competitive landscape of the global autonomous taxi industry, examining market concentration, innovation drivers, regulatory frameworks, and M&A activities. Key players like Baidu Inc, Didi Chuxing Technology Co, Uber Technologies Inc, MOIA, AutoX Inc, GM Cruise, Tesla Inc, Waymo LLC, APTV PLC, EasyMile, NAVYA SA, AB Volvo, and ZF Friedrichshafen AG are profiled, assessing their market share and strategic initiatives.
The industry demonstrates a moderately concentrated structure, with a few dominant players holding significant market share. However, numerous smaller companies are actively innovating, driving competition. Innovation is fueled by advancements in AI, sensor technology (like the 400-meter range Lidar sensor introduced by Agro AI in May 2021), and autonomous driving software. Regulatory frameworks vary significantly across geographies, influencing market entry and operational strategies. The increasing prevalence of electric vehicles is also shaping the industry's trajectory. Significant M&A activity is observed, with deal values totaling xx Million in the past five years, primarily driven by strategic acquisitions to enhance technological capabilities and expand market reach. End-user trends show a growing preference for convenient, affordable, and safe transportation solutions, which is driving demand for autonomous taxis.
Global Autonomous Taxi Industry Industry Trends & Insights
This section delves into the key trends and insights shaping the global autonomous taxi industry. The market is experiencing rapid growth, projected to achieve a Compound Annual Growth Rate (CAGR) of xx% during the forecast period (2025-2033). Market penetration is expected to increase significantly, driven by factors such as rising urbanization, increasing traffic congestion, growing demand for convenient transportation, and the decreasing cost of autonomous vehicle technology. Technological disruptions are continuously reshaping the industry, with advancements in AI, machine learning, and sensor technology enhancing the safety and efficiency of autonomous taxis. Consumer preferences are evolving towards on-demand, personalized, and sustainable transportation services, influencing the design and features of autonomous vehicles. Competitive dynamics are intensifying, with companies focusing on differentiation through innovative technologies, strategic partnerships, and expansion into new markets.
Dominant Markets & Segments in Global Autonomous Taxi Industry
This section identifies the leading regions, countries, and segments within the global autonomous taxi market. Based on our analysis, the dominant region is expected to be North America, driven by strong technological advancements, supportive regulatory frameworks, and high consumer adoption rates. Within this region, the United States is expected to remain the leading country.
- By Service Type: Rental-based services are currently dominant, but station-based models are expected to gain traction in the future.
- By Level of Autonomy: Level 4 autonomous vehicles are anticipated to hold the largest market share by 2033, followed by Level 5.
- By Propulsion: Electric Vehicles (EVs) are the fastest-growing segment, driven by environmental concerns and government incentives.
- By Vehicle: Cars currently dominate the market, but vans and shuttles are expected to see increased adoption for shared mobility solutions.
- By Application: Passenger transportation currently holds a larger market share compared to goods transportation. However, goods transportation is expected to witness significant growth in the coming years.
Key drivers for dominance include supportive government policies, robust technological infrastructure, and high consumer acceptance. Challenges include regulatory hurdles, infrastructure limitations, and concerns about safety and security.
Global Autonomous Taxi Industry Product Developments
The autonomous taxi industry is characterized by continuous product innovation, with advancements in sensor technology, AI algorithms, and vehicle design leading to safer, more efficient, and reliable autonomous vehicles. New applications are emerging, including goods transportation and specialized services for disabled passengers (as exemplified by Waymo's August 2022 feature introduction). Competitive advantages are derived from superior technology, robust safety features, and efficient operations.
Report Scope & Segmentation Analysis
This report provides a comprehensive analysis of the global autonomous taxi market, segmented by service type (rental-based, station-based), level of autonomy (Level 4, Level 5), propulsion (electric, hybrid, fuel cell electric), vehicle type (car, van/shuttle), and application (passenger transportation, goods transportation). Each segment's growth projections, market size, and competitive dynamics are thoroughly examined. For instance, the electric vehicle segment is anticipated to exhibit the highest growth rate due to environmental regulations and technological improvements.
Key Drivers of Global Autonomous Taxi Industry Growth
The growth of the autonomous taxi industry is driven by several factors, including advancements in artificial intelligence and sensor technology, increasing urbanization and traffic congestion, rising demand for convenient and affordable transportation, and supportive government policies promoting the adoption of autonomous vehicles.
Challenges in the Global Autonomous Taxi Industry Sector
The autonomous taxi industry faces several challenges, including the high initial investment costs associated with developing and deploying autonomous vehicles, regulatory hurdles related to safety and liability, concerns about cybersecurity and data privacy, and the need for robust infrastructure to support autonomous vehicle operations. These factors could collectively impact market growth by xx Million by 2033.
Emerging Opportunities in Global Autonomous Taxi Industry
The autonomous taxi industry presents several emerging opportunities, including expansion into new markets, development of innovative business models, and integration with smart city initiatives. The use of autonomous vehicles in goods transportation and specialized services (e.g., delivery, healthcare) holds significant potential for growth.
Leading Players in the Global Autonomous Taxi Industry Market
- Baidu Inc
- Didi Chuxing Technology Co
- Uber Technologies Inc
- MOIA
- AutoX Inc
- GM Cruise
- Tesla Inc
- Waymo LLC
- APTV PLC
- EasyMile
- NAVYA SA
- AB Volvo
- ZF Friedrichshafen AG
Key Developments in Global Autonomous Taxi Industry Industry
- August 2022: Waymo LLC introduced accessibility features for passengers with disabilities.
- December 2021: AutoX Inc. opened a production facility for Level 4 RoboTaxis in China.
- May 2021: Agro AI introduced a new high-resolution Lidar sensor with a 400-meter range.
Strategic Outlook for Global Autonomous Taxi Industry Market
The global autonomous taxi industry is poised for significant growth in the coming years, driven by continuous technological advancements, increasing demand for efficient and sustainable transportation, and supportive government regulations. New business models, strategic partnerships, and expansion into new markets will be key to success in this dynamic industry. The market is expected to reach xx Million by 2033.
Global Autonomous Taxi Industry Segmentation
-
1. Level of Autonomy
- 1.1. Level 4
- 1.2. Level 5
-
2. Propulsion
- 2.1. Electric Vehicles
- 2.2. Hybrid Vehicles
- 2.3. Fuel Cell Electric Vehicles
-
3. Vehicle
- 3.1. Car
- 3.2. Van/Shuttle
-
4. Application
- 4.1. Passenger Transportation
- 4.2. Goods Transportation
-
5. Service Type
- 5.1. Rental-Based
- 5.2. Station-Based
Global Autonomous Taxi Industry Segmentation By Geography
-
1. North America
- 1.1. United States
- 1.2. Canada
- 1.3. Rest of North America
-
2. Europe
- 2.1. Germany
- 2.2. United Kingdom
- 2.3. France
- 2.4. Italy
- 2.5. Spain
- 2.6. Rest of Europe
-
3. Asia Pacific
- 3.1. China
- 3.2. Japan
- 3.3. India
- 3.4. Rest of Asia Pacific
-
4. Rest of the World
- 4.1. South America
- 4.2. Middle East and Africa
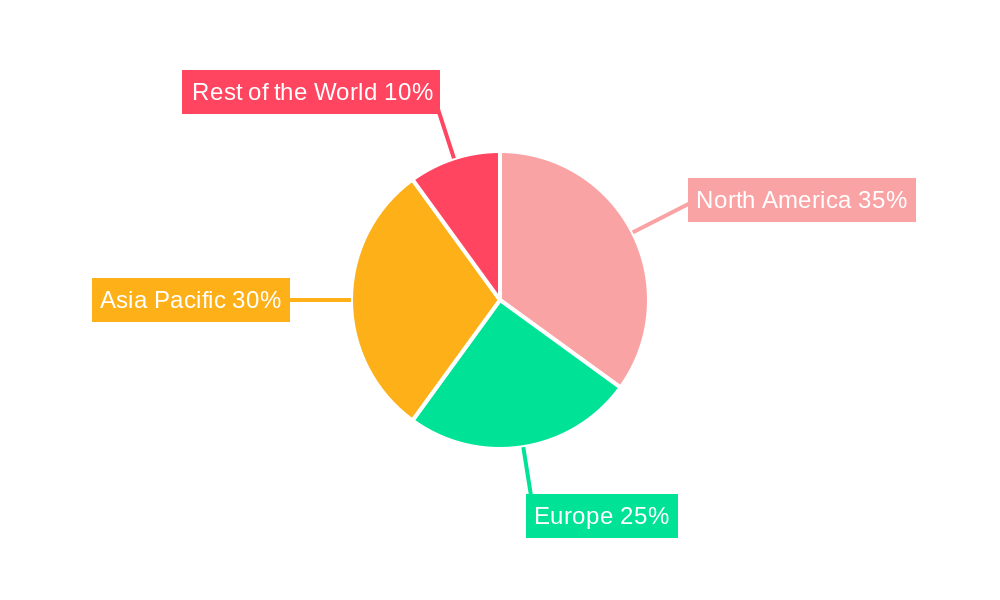
Global Autonomous Taxi Industry Regional Market Share
Geographic Coverage of Global Autonomous Taxi Industry
Global Autonomous Taxi Industry REPORT HIGHLIGHTS
| Aspects | Details |
|---|---|
| Study Period | 2020-2034 |
| Base Year | 2025 |
| Estimated Year | 2026 |
| Forecast Period | 2026-2034 |
| Historical Period | 2020-2025 |
| Growth Rate | CAGR of 99.1% from 2020-2034 |
| Segmentation |
|
Table of Contents
- 1. Introduction
- 1.1. Research Scope
- 1.2. Market Segmentation
- 1.3. Research Objective
- 1.4. Definitions and Assumptions
- 2. Executive Summary
- 2.1. Market Snapshot
- 3. Market Dynamics
- 3.1. Market Drivers
- 3.2. Market Restrains
- 3.3. Market Trends
- 3.4. Market Opportunities
- 4. Market Factor Analysis
- 4.1. Porters Five Forces
- 4.1.1. Bargaining Power of Suppliers
- 4.1.2. Bargaining Power of Buyers
- 4.1.3. Threat of New Entrants
- 4.1.4. Threat of Substitutes
- 4.1.5. Competitive Rivalry
- 4.2. PESTEL analysis
- 4.3. BCG Analysis
- 4.3.1. Stars (High Growth, High Market Share)
- 4.3.2. Cash Cows (Low Growth, High Market Share)
- 4.3.3. Question Mark (High Growth, Low Market Share)
- 4.3.4. Dogs (Low Growth, Low Market Share)
- 4.4. Ansoff Matrix Analysis
- 4.5. Supply Chain Analysis
- 4.6. Regulatory Landscape
- 4.7. Current Market Potential and Opportunity Assessment (TAM–SAM–SOM Framework)
- 4.8. RAX Analyst Note
- 4.1. Porters Five Forces
- 5. Market Analysis, Insights and Forecast 2021-2033
- 5.1. Market Analysis, Insights and Forecast - by Level of Autonomy
- 5.1.1. Level 4
- 5.1.2. Level 5
- 5.2. Market Analysis, Insights and Forecast - by Propulsion
- 5.2.1. Electric Vehicles
- 5.2.2. Hybrid Vehicles
- 5.2.3. Fuel Cell Electric Vehicles
- 5.3. Market Analysis, Insights and Forecast - by Vehicle
- 5.3.1. Car
- 5.3.2. Van/Shuttle
- 5.4. Market Analysis, Insights and Forecast - by Application
- 5.4.1. Passenger Transportation
- 5.4.2. Goods Transportation
- 5.5. Market Analysis, Insights and Forecast - by Service Type
- 5.5.1. Rental-Based
- 5.5.2. Station-Based
- 5.6. Market Analysis, Insights and Forecast - by Region
- 5.6.1. North America
- 5.6.2. Europe
- 5.6.3. Asia Pacific
- 5.6.4. Rest of the World
- 5.1. Market Analysis, Insights and Forecast - by Level of Autonomy
- 6. Global Autonomous Taxi Industry Analysis, Insights and Forecast, 2021-2033
- 6.1. Market Analysis, Insights and Forecast - by Level of Autonomy
- 6.1.1. Level 4
- 6.1.2. Level 5
- 6.2. Market Analysis, Insights and Forecast - by Propulsion
- 6.2.1. Electric Vehicles
- 6.2.2. Hybrid Vehicles
- 6.2.3. Fuel Cell Electric Vehicles
- 6.3. Market Analysis, Insights and Forecast - by Vehicle
- 6.3.1. Car
- 6.3.2. Van/Shuttle
- 6.4. Market Analysis, Insights and Forecast - by Application
- 6.4.1. Passenger Transportation
- 6.4.2. Goods Transportation
- 6.5. Market Analysis, Insights and Forecast - by Service Type
- 6.5.1. Rental-Based
- 6.5.2. Station-Based
- 6.1. Market Analysis, Insights and Forecast - by Level of Autonomy
- 7. North America Global Autonomous Taxi Industry Analysis, Insights and Forecast, 2020-2032
- 7.1. Market Analysis, Insights and Forecast - by Level of Autonomy
- 7.1.1. Level 4
- 7.1.2. Level 5
- 7.2. Market Analysis, Insights and Forecast - by Propulsion
- 7.2.1. Electric Vehicles
- 7.2.2. Hybrid Vehicles
- 7.2.3. Fuel Cell Electric Vehicles
- 7.3. Market Analysis, Insights and Forecast - by Vehicle
- 7.3.1. Car
- 7.3.2. Van/Shuttle
- 7.4. Market Analysis, Insights and Forecast - by Application
- 7.4.1. Passenger Transportation
- 7.4.2. Goods Transportation
- 7.5. Market Analysis, Insights and Forecast - by Service Type
- 7.5.1. Rental-Based
- 7.5.2. Station-Based
- 7.1. Market Analysis, Insights and Forecast - by Level of Autonomy
- 8. Europe Global Autonomous Taxi Industry Analysis, Insights and Forecast, 2020-2032
- 8.1. Market Analysis, Insights and Forecast - by Level of Autonomy
- 8.1.1. Level 4
- 8.1.2. Level 5
- 8.2. Market Analysis, Insights and Forecast - by Propulsion
- 8.2.1. Electric Vehicles
- 8.2.2. Hybrid Vehicles
- 8.2.3. Fuel Cell Electric Vehicles
- 8.3. Market Analysis, Insights and Forecast - by Vehicle
- 8.3.1. Car
- 8.3.2. Van/Shuttle
- 8.4. Market Analysis, Insights and Forecast - by Application
- 8.4.1. Passenger Transportation
- 8.4.2. Goods Transportation
- 8.5. Market Analysis, Insights and Forecast - by Service Type
- 8.5.1. Rental-Based
- 8.5.2. Station-Based
- 8.1. Market Analysis, Insights and Forecast - by Level of Autonomy
- 9. Asia Pacific Global Autonomous Taxi Industry Analysis, Insights and Forecast, 2020-2032
- 9.1. Market Analysis, Insights and Forecast - by Level of Autonomy
- 9.1.1. Level 4
- 9.1.2. Level 5
- 9.2. Market Analysis, Insights and Forecast - by Propulsion
- 9.2.1. Electric Vehicles
- 9.2.2. Hybrid Vehicles
- 9.2.3. Fuel Cell Electric Vehicles
- 9.3. Market Analysis, Insights and Forecast - by Vehicle
- 9.3.1. Car
- 9.3.2. Van/Shuttle
- 9.4. Market Analysis, Insights and Forecast - by Application
- 9.4.1. Passenger Transportation
- 9.4.2. Goods Transportation
- 9.5. Market Analysis, Insights and Forecast - by Service Type
- 9.5.1. Rental-Based
- 9.5.2. Station-Based
- 9.1. Market Analysis, Insights and Forecast - by Level of Autonomy
- 10. Rest of the World Global Autonomous Taxi Industry Analysis, Insights and Forecast, 2020-2032
- 10.1. Market Analysis, Insights and Forecast - by Level of Autonomy
- 10.1.1. Level 4
- 10.1.2. Level 5
- 10.2. Market Analysis, Insights and Forecast - by Propulsion
- 10.2.1. Electric Vehicles
- 10.2.2. Hybrid Vehicles
- 10.2.3. Fuel Cell Electric Vehicles
- 10.3. Market Analysis, Insights and Forecast - by Vehicle
- 10.3.1. Car
- 10.3.2. Van/Shuttle
- 10.4. Market Analysis, Insights and Forecast - by Application
- 10.4.1. Passenger Transportation
- 10.4.2. Goods Transportation
- 10.5. Market Analysis, Insights and Forecast - by Service Type
- 10.5.1. Rental-Based
- 10.5.2. Station-Based
- 10.1. Market Analysis, Insights and Forecast - by Level of Autonomy
- 11. Competitive Analysis
- 11.1. Company Profiles
- 11.1.1 Baidu Inc
- 11.1.1.1. Company Overview
- 11.1.1.2. Products
- 11.1.1.3. Company Financials
- 11.1.1.4. SWOT Analysis
- 11.1.2 Didi Chuxing Technology Co
- 11.1.2.1. Company Overview
- 11.1.2.2. Products
- 11.1.2.3. Company Financials
- 11.1.2.4. SWOT Analysis
- 11.1.3 Uber Technologies Inc
- 11.1.3.1. Company Overview
- 11.1.3.2. Products
- 11.1.3.3. Company Financials
- 11.1.3.4. SWOT Analysis
- 11.1.4 MOIA
- 11.1.4.1. Company Overview
- 11.1.4.2. Products
- 11.1.4.3. Company Financials
- 11.1.4.4. SWOT Analysis
- 11.1.5 AutoX Inc
- 11.1.5.1. Company Overview
- 11.1.5.2. Products
- 11.1.5.3. Company Financials
- 11.1.5.4. SWOT Analysis
- 11.1.6 GM Cruise
- 11.1.6.1. Company Overview
- 11.1.6.2. Products
- 11.1.6.3. Company Financials
- 11.1.6.4. SWOT Analysis
- 11.1.7 Tesla Inc *List Not Exhaustive
- 11.1.7.1. Company Overview
- 11.1.7.2. Products
- 11.1.7.3. Company Financials
- 11.1.7.4. SWOT Analysis
- 11.1.8 Waymo LLC
- 11.1.8.1. Company Overview
- 11.1.8.2. Products
- 11.1.8.3. Company Financials
- 11.1.8.4. SWOT Analysis
- 11.1.9 APTIV PLC
- 11.1.9.1. Company Overview
- 11.1.9.2. Products
- 11.1.9.3. Company Financials
- 11.1.9.4. SWOT Analysis
- 11.1.10 EasyMile
- 11.1.10.1. Company Overview
- 11.1.10.2. Products
- 11.1.10.3. Company Financials
- 11.1.10.4. SWOT Analysis
- 11.1.11 NAVYA SA
- 11.1.11.1. Company Overview
- 11.1.11.2. Products
- 11.1.11.3. Company Financials
- 11.1.11.4. SWOT Analysis
- 11.1.12 AB Volvo
- 11.1.12.1. Company Overview
- 11.1.12.2. Products
- 11.1.12.3. Company Financials
- 11.1.12.4. SWOT Analysis
- 11.1.13 ZF Friedrichshafen AG
- 11.1.13.1. Company Overview
- 11.1.13.2. Products
- 11.1.13.3. Company Financials
- 11.1.13.4. SWOT Analysis
- 11.1.1 Baidu Inc
- 11.2. Market Entropy
- 11.2.1 Company's Key Areas Served
- 11.2.2 Recent Developments
- 11.3. Company Market Share Analysis 2025
- 11.3.1 Top 5 Companies Market Share Analysis
- 11.3.2 Top 3 Companies Market Share Analysis
- 11.4. List of Potential Customers
- 12. Research Methodology
List of Figures
- Figure 1: Global Global Autonomous Taxi Industry Revenue Breakdown (billion, %) by Region 2025 & 2033
- Figure 2: North America Global Autonomous Taxi Industry Revenue (billion), by Level of Autonomy 2025 & 2033
- Figure 3: North America Global Autonomous Taxi Industry Revenue Share (%), by Level of Autonomy 2025 & 2033
- Figure 4: North America Global Autonomous Taxi Industry Revenue (billion), by Propulsion 2025 & 2033
- Figure 5: North America Global Autonomous Taxi Industry Revenue Share (%), by Propulsion 2025 & 2033
- Figure 6: North America Global Autonomous Taxi Industry Revenue (billion), by Vehicle 2025 & 2033
- Figure 7: North America Global Autonomous Taxi Industry Revenue Share (%), by Vehicle 2025 & 2033
- Figure 8: North America Global Autonomous Taxi Industry Revenue (billion), by Application 2025 & 2033
- Figure 9: North America Global Autonomous Taxi Industry Revenue Share (%), by Application 2025 & 2033
- Figure 10: North America Global Autonomous Taxi Industry Revenue (billion), by Service Type 2025 & 2033
- Figure 11: North America Global Autonomous Taxi Industry Revenue Share (%), by Service Type 2025 & 2033
- Figure 12: North America Global Autonomous Taxi Industry Revenue (billion), by Country 2025 & 2033
- Figure 13: North America Global Autonomous Taxi Industry Revenue Share (%), by Country 2025 & 2033
- Figure 14: Europe Global Autonomous Taxi Industry Revenue (billion), by Level of Autonomy 2025 & 2033
- Figure 15: Europe Global Autonomous Taxi Industry Revenue Share (%), by Level of Autonomy 2025 & 2033
- Figure 16: Europe Global Autonomous Taxi Industry Revenue (billion), by Propulsion 2025 & 2033
- Figure 17: Europe Global Autonomous Taxi Industry Revenue Share (%), by Propulsion 2025 & 2033
- Figure 18: Europe Global Autonomous Taxi Industry Revenue (billion), by Vehicle 2025 & 2033
- Figure 19: Europe Global Autonomous Taxi Industry Revenue Share (%), by Vehicle 2025 & 2033
- Figure 20: Europe Global Autonomous Taxi Industry Revenue (billion), by Application 2025 & 2033
- Figure 21: Europe Global Autonomous Taxi Industry Revenue Share (%), by Application 2025 & 2033
- Figure 22: Europe Global Autonomous Taxi Industry Revenue (billion), by Service Type 2025 & 2033
- Figure 23: Europe Global Autonomous Taxi Industry Revenue Share (%), by Service Type 2025 & 2033
- Figure 24: Europe Global Autonomous Taxi Industry Revenue (billion), by Country 2025 & 2033
- Figure 25: Europe Global Autonomous Taxi Industry Revenue Share (%), by Country 2025 & 2033
- Figure 26: Asia Pacific Global Autonomous Taxi Industry Revenue (billion), by Level of Autonomy 2025 & 2033
- Figure 27: Asia Pacific Global Autonomous Taxi Industry Revenue Share (%), by Level of Autonomy 2025 & 2033
- Figure 28: Asia Pacific Global Autonomous Taxi Industry Revenue (billion), by Propulsion 2025 & 2033
- Figure 29: Asia Pacific Global Autonomous Taxi Industry Revenue Share (%), by Propulsion 2025 & 2033
- Figure 30: Asia Pacific Global Autonomous Taxi Industry Revenue (billion), by Vehicle 2025 & 2033
- Figure 31: Asia Pacific Global Autonomous Taxi Industry Revenue Share (%), by Vehicle 2025 & 2033
- Figure 32: Asia Pacific Global Autonomous Taxi Industry Revenue (billion), by Application 2025 & 2033
- Figure 33: Asia Pacific Global Autonomous Taxi Industry Revenue Share (%), by Application 2025 & 2033
- Figure 34: Asia Pacific Global Autonomous Taxi Industry Revenue (billion), by Service Type 2025 & 2033
- Figure 35: Asia Pacific Global Autonomous Taxi Industry Revenue Share (%), by Service Type 2025 & 2033
- Figure 36: Asia Pacific Global Autonomous Taxi Industry Revenue (billion), by Country 2025 & 2033
- Figure 37: Asia Pacific Global Autonomous Taxi Industry Revenue Share (%), by Country 2025 & 2033
- Figure 38: Rest of the World Global Autonomous Taxi Industry Revenue (billion), by Level of Autonomy 2025 & 2033
- Figure 39: Rest of the World Global Autonomous Taxi Industry Revenue Share (%), by Level of Autonomy 2025 & 2033
- Figure 40: Rest of the World Global Autonomous Taxi Industry Revenue (billion), by Propulsion 2025 & 2033
- Figure 41: Rest of the World Global Autonomous Taxi Industry Revenue Share (%), by Propulsion 2025 & 2033
- Figure 42: Rest of the World Global Autonomous Taxi Industry Revenue (billion), by Vehicle 2025 & 2033
- Figure 43: Rest of the World Global Autonomous Taxi Industry Revenue Share (%), by Vehicle 2025 & 2033
- Figure 44: Rest of the World Global Autonomous Taxi Industry Revenue (billion), by Application 2025 & 2033
- Figure 45: Rest of the World Global Autonomous Taxi Industry Revenue Share (%), by Application 2025 & 2033
- Figure 46: Rest of the World Global Autonomous Taxi Industry Revenue (billion), by Service Type 2025 & 2033
- Figure 47: Rest of the World Global Autonomous Taxi Industry Revenue Share (%), by Service Type 2025 & 2033
- Figure 48: Rest of the World Global Autonomous Taxi Industry Revenue (billion), by Country 2025 & 2033
- Figure 49: Rest of the World Global Autonomous Taxi Industry Revenue Share (%), by Country 2025 & 2033
List of Tables
- Table 1: Global Autonomous Taxi Industry Revenue billion Forecast, by Level of Autonomy 2020 & 2033
- Table 2: Global Autonomous Taxi Industry Revenue billion Forecast, by Propulsion 2020 & 2033
- Table 3: Global Autonomous Taxi Industry Revenue billion Forecast, by Vehicle 2020 & 2033
- Table 4: Global Autonomous Taxi Industry Revenue billion Forecast, by Application 2020 & 2033
- Table 5: Global Autonomous Taxi Industry Revenue billion Forecast, by Service Type 2020 & 2033
- Table 6: Global Autonomous Taxi Industry Revenue billion Forecast, by Region 2020 & 2033
- Table 7: Global Autonomous Taxi Industry Revenue billion Forecast, by Level of Autonomy 2020 & 2033
- Table 8: Global Autonomous Taxi Industry Revenue billion Forecast, by Propulsion 2020 & 2033
- Table 9: Global Autonomous Taxi Industry Revenue billion Forecast, by Vehicle 2020 & 2033
- Table 10: Global Autonomous Taxi Industry Revenue billion Forecast, by Application 2020 & 2033
- Table 11: Global Autonomous Taxi Industry Revenue billion Forecast, by Service Type 2020 & 2033
- Table 12: Global Autonomous Taxi Industry Revenue billion Forecast, by Country 2020 & 2033
- Table 13: United States Global Autonomous Taxi Industry Revenue (billion) Forecast, by Application 2020 & 2033
- Table 14: Canada Global Autonomous Taxi Industry Revenue (billion) Forecast, by Application 2020 & 2033
- Table 15: Rest of North America Global Autonomous Taxi Industry Revenue (billion) Forecast, by Application 2020 & 2033
- Table 16: Global Autonomous Taxi Industry Revenue billion Forecast, by Level of Autonomy 2020 & 2033
- Table 17: Global Autonomous Taxi Industry Revenue billion Forecast, by Propulsion 2020 & 2033
- Table 18: Global Autonomous Taxi Industry Revenue billion Forecast, by Vehicle 2020 & 2033
- Table 19: Global Autonomous Taxi Industry Revenue billion Forecast, by Application 2020 & 2033
- Table 20: Global Autonomous Taxi Industry Revenue billion Forecast, by Service Type 2020 & 2033
- Table 21: Global Autonomous Taxi Industry Revenue billion Forecast, by Country 2020 & 2033
- Table 22: Germany Global Autonomous Taxi Industry Revenue (billion) Forecast, by Application 2020 & 2033
- Table 23: United Kingdom Global Autonomous Taxi Industry Revenue (billion) Forecast, by Application 2020 & 2033
- Table 24: France Global Autonomous Taxi Industry Revenue (billion) Forecast, by Application 2020 & 2033
- Table 25: Italy Global Autonomous Taxi Industry Revenue (billion) Forecast, by Application 2020 & 2033
- Table 26: Spain Global Autonomous Taxi Industry Revenue (billion) Forecast, by Application 2020 & 2033
- Table 27: Rest of Europe Global Autonomous Taxi Industry Revenue (billion) Forecast, by Application 2020 & 2033
- Table 28: Global Autonomous Taxi Industry Revenue billion Forecast, by Level of Autonomy 2020 & 2033
- Table 29: Global Autonomous Taxi Industry Revenue billion Forecast, by Propulsion 2020 & 2033
- Table 30: Global Autonomous Taxi Industry Revenue billion Forecast, by Vehicle 2020 & 2033
- Table 31: Global Autonomous Taxi Industry Revenue billion Forecast, by Application 2020 & 2033
- Table 32: Global Autonomous Taxi Industry Revenue billion Forecast, by Service Type 2020 & 2033
- Table 33: Global Autonomous Taxi Industry Revenue billion Forecast, by Country 2020 & 2033
- Table 34: China Global Autonomous Taxi Industry Revenue (billion) Forecast, by Application 2020 & 2033
- Table 35: Japan Global Autonomous Taxi Industry Revenue (billion) Forecast, by Application 2020 & 2033
- Table 36: India Global Autonomous Taxi Industry Revenue (billion) Forecast, by Application 2020 & 2033
- Table 37: Rest of Asia Pacific Global Autonomous Taxi Industry Revenue (billion) Forecast, by Application 2020 & 2033
- Table 38: Global Autonomous Taxi Industry Revenue billion Forecast, by Level of Autonomy 2020 & 2033
- Table 39: Global Autonomous Taxi Industry Revenue billion Forecast, by Propulsion 2020 & 2033
- Table 40: Global Autonomous Taxi Industry Revenue billion Forecast, by Vehicle 2020 & 2033
- Table 41: Global Autonomous Taxi Industry Revenue billion Forecast, by Application 2020 & 2033
- Table 42: Global Autonomous Taxi Industry Revenue billion Forecast, by Service Type 2020 & 2033
- Table 43: Global Autonomous Taxi Industry Revenue billion Forecast, by Country 2020 & 2033
- Table 44: South America Global Autonomous Taxi Industry Revenue (billion) Forecast, by Application 2020 & 2033
- Table 45: Middle East and Africa Global Autonomous Taxi Industry Revenue (billion) Forecast, by Application 2020 & 2033
Frequently Asked Questions
1. What is the projected Compound Annual Growth Rate (CAGR) of the Global Autonomous Taxi Industry?
The projected CAGR is approximately 99.1%.
2. Which companies are prominent players in the Global Autonomous Taxi Industry?
Key companies in the market include Baidu Inc, Didi Chuxing Technology Co, Uber Technologies Inc, MOIA, AutoX Inc, GM Cruise, Tesla Inc *List Not Exhaustive, Waymo LLC, APTIV PLC, EasyMile, NAVYA SA, AB Volvo, ZF Friedrichshafen AG.
3. What are the main segments of the Global Autonomous Taxi Industry?
The market segments include Level of Autonomy, Propulsion, Vehicle, Application, Service Type.
4. Can you provide details about the market size?
The market size is estimated to be USD 0.61 billion as of 2022.
5. What are some drivers contributing to market growth?
Increase in Leisure Activities in the Country.
6. What are the notable trends driving market growth?
Robo-Taxis Are Attracting People Around the World.
7. Are there any restraints impacting market growth?
Strict Vehicle Emission Regulations.
8. Can you provide examples of recent developments in the market?
In August 2022, Waymo LLC introduced new features designed to make its fleet of autonomous taxis more accessible to passengers with visual impairments and other disabilities.
9. What pricing options are available for accessing the report?
Pricing options include single-user, multi-user, and enterprise licenses priced at USD 4750, USD 5250, and USD 8750 respectively.
10. Is the market size provided in terms of value or volume?
The market size is provided in terms of value, measured in billion.
11. Are there any specific market keywords associated with the report?
Yes, the market keyword associated with the report is "Global Autonomous Taxi Industry," which aids in identifying and referencing the specific market segment covered.
12. How do I determine which pricing option suits my needs best?
The pricing options vary based on user requirements and access needs. Individual users may opt for single-user licenses, while businesses requiring broader access may choose multi-user or enterprise licenses for cost-effective access to the report.
13. Are there any additional resources or data provided in the Global Autonomous Taxi Industry report?
While the report offers comprehensive insights, it's advisable to review the specific contents or supplementary materials provided to ascertain if additional resources or data are available.
14. How can I stay updated on further developments or reports in the Global Autonomous Taxi Industry?
To stay informed about further developments, trends, and reports in the Global Autonomous Taxi Industry, consider subscribing to industry newsletters, following relevant companies and organizations, or regularly checking reputable industry news sources and publications.
Methodology
Step 1 - Identification of Relevant Samples Size from Population Database


Step 2 - Approaches for Defining Global Market Size (Value, Volume* & Price*)

Note*: In applicable scenarios
Step 3 - Data Sources
Primary Research
- Web Analytics
- Survey Reports
- Research Institute
- Latest Research Reports
- Opinion Leaders
Secondary Research
- Annual Reports
- White Paper
- Latest Press Release
- Industry Association
- Paid Database
- Investor Presentations

Step 4 - Data Triangulation
Involves using different sources of information in order to increase the validity of a study
These sources are likely to be stakeholders in a program - participants, other researchers, program staff, other community members, and so on.
Then we put all data in single framework & apply various statistical tools to find out the dynamic on the market.
During the analysis stage, feedback from the stakeholder groups would be compared to determine areas of agreement as well as areas of divergence