

Key Insights
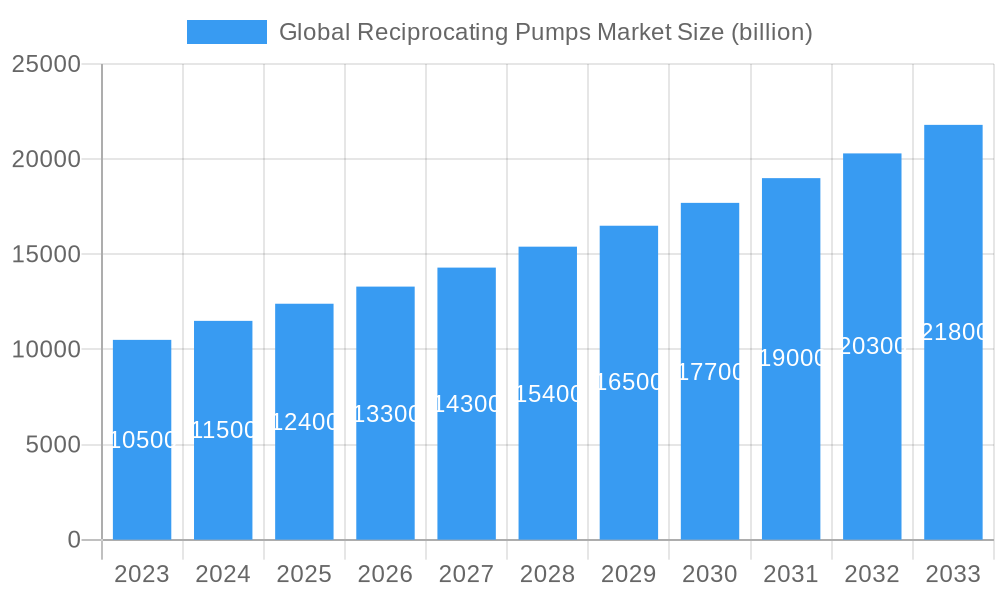
The global reciprocating pumps market is poised for robust expansion, projected to reach an estimated USD 11.5 billion in 2024, driven by a Compound Annual Growth Rate (CAGR) of 7.2% throughout the forecast period ending in 2033. This significant growth is underpinned by the indispensable role of reciprocating pumps across a multitude of critical industrial applications. The Oil & Gas sector, in particular, serves as a primary growth engine, demanding high-performance pumps for extraction, transportation, and refining processes. Similarly, the escalating need for efficient water and wastewater management, coupled with the sustained activity in the Mining and Chemical industries, further bolsters market demand. The inherent advantages of reciprocating pumps, such as their ability to handle high pressures, deliver precise flow rates, and operate effectively with viscous or abrasive fluids, make them the preferred choice in these demanding environments. Advancements in materials science and pump design are also contributing to enhanced durability, efficiency, and reduced maintenance, making these pumps even more attractive for industrial adoption.
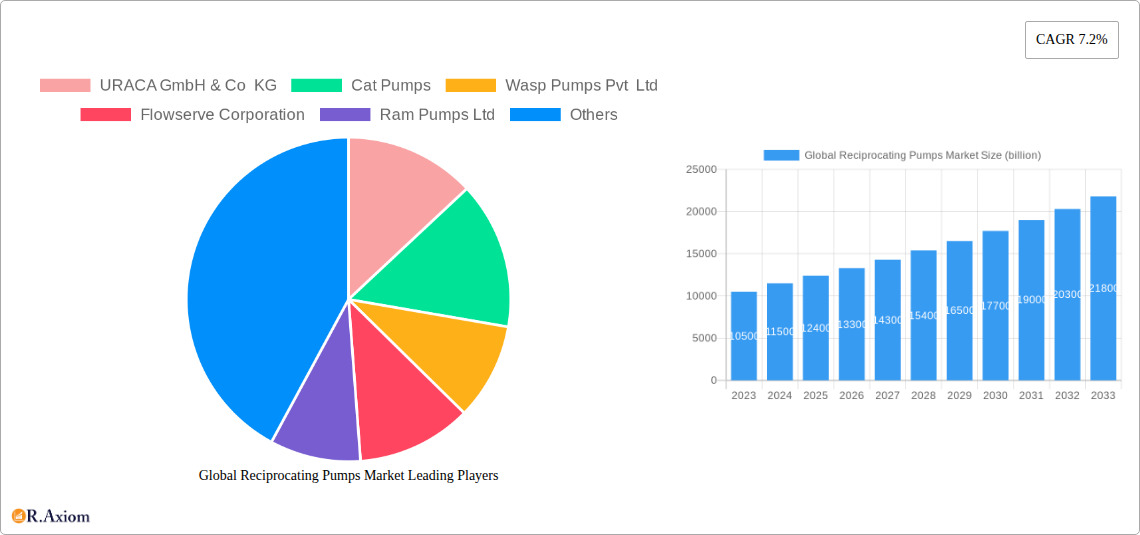
Global Reciprocating Pumps Market Market Size (In Billion)
Emerging trends within the reciprocating pumps market indicate a growing preference for advanced pumping solutions that offer greater energy efficiency and intelligent operational capabilities. The development of smart pumps with integrated monitoring and control systems is gaining traction, enabling predictive maintenance and optimizing operational performance. This aligns with the broader industrial trend towards digitalization and Industry 4.0. While the market enjoys strong growth drivers, certain restraints may influence its trajectory. Increasing competition from alternative pump technologies, particularly centrifugal pumps in certain low-pressure, high-volume applications, and the initial capital investment required for some advanced reciprocating pump systems, could pose challenges. However, the specialized capabilities of reciprocating pumps, especially in high-pressure and precise dosing applications, ensure their continued dominance in niche segments. The market is segmented by type, with Piston, Plunger, and Diaphragm pumps catering to diverse operational needs. Mechanism capacities range from up to 100 m3/h to above 800 m3/h, serving a wide spectrum of industrial requirements.
Global Reciprocating Pumps Market Company Market Share
Here is a detailed, SEO-optimized report description for the Global Reciprocating Pumps Market:
Global Reciprocating Pumps Market Market Concentration & Innovation
The global reciprocating pumps market exhibits moderate to high concentration, with a few dominant players controlling a significant market share. Innovation remains a key driver, fueled by the increasing demand for high-efficiency, robust, and low-maintenance pumping solutions across various industries. Regulatory frameworks, particularly those concerning environmental protection and industrial safety, are influencing product development towards more sustainable and compliant technologies. For instance, stricter emissions standards are pushing manufacturers to develop pumps with improved energy efficiency and reduced leakage. Product substitutes, such as centrifugal pumps, offer alternative solutions for specific applications, but reciprocating pumps maintain a strong foothold due to their ability to handle high pressures, viscous fluids, and precise dosing requirements. End-user trends are pivotal, with growing investments in infrastructure development, water management, and the oil and gas sector directly impacting demand. Mergers and acquisitions (M&A) activities are strategically shaping the market landscape, with larger entities acquiring smaller, innovative companies to expand their product portfolios and geographical reach. The value of M&A deals is projected to increase, reflecting the consolidation and strategic realignments within the industry. The market is expected to reach $5.1 billion by 2033, growing from $3.8 billion in 2025.
Global Reciprocating Pumps Market Industry Trends & Insights
The global reciprocating pumps market is poised for substantial growth, driven by an interplay of escalating industrialization, increasing demand for efficient fluid transfer solutions, and technological advancements. The market is projected to witness a Compound Annual Growth Rate (CAGR) of approximately 3.5% during the forecast period of 2025-2033. A primary growth catalyst is the burgeoning oil and gas sector, where reciprocating pumps are indispensable for exploration, extraction, and transportation of crude oil and natural gas, especially in high-pressure applications and for enhanced oil recovery (EOR) operations. The expanding water and wastewater treatment infrastructure globally, spurred by growing population and stringent environmental regulations, is another significant driver. These pumps are critical for desalination plants, municipal water supply, and industrial wastewater management. The mining industry's need for robust pumps to handle abrasive slurries and high-density fluids further bolsters market demand.
Technological disruptions are continuously reshaping the competitive landscape. Manufacturers are focusing on developing pumps with enhanced durability, corrosion resistance, and improved sealing technologies to minimize downtime and maintenance costs. The integration of smart technologies, such as IoT sensors and predictive maintenance capabilities, is gaining traction, allowing for real-time monitoring, performance optimization, and early detection of potential failures. This shift towards Industry 4.0 integration enhances operational efficiency and reduces total cost of ownership for end-users. Consumer preferences are leaning towards energy-efficient, environmentally friendly, and customizable pumping solutions. The demand for pumps that can handle a wide range of fluid viscosities and operate under extreme conditions is also on the rise.
Competitive dynamics are characterized by strategic partnerships, product innovations, and geographical expansion. Companies are investing heavily in research and development to introduce pumps with superior performance characteristics and cater to niche applications. The market penetration of advanced reciprocating pump technologies is increasing, as industries recognize their long-term cost benefits and operational reliability. The market size is estimated to reach $5.1 billion by 2033, indicating a robust growth trajectory.
Dominant Markets & Segments in Global Reciprocating Pumps Market
The global reciprocating pumps market is characterized by significant regional dominance and strong performance within specific segments. North America, particularly the United States, is a leading region due to its mature oil and gas industry and substantial investments in water and wastewater infrastructure. Stringent environmental regulations and a focus on technological innovation further drive demand for advanced reciprocating pump solutions in this region. Asia Pacific is emerging as a high-growth market, propelled by rapid industrialization, increasing infrastructure projects, and a growing manufacturing base in countries like China and India. Economic policies promoting industrial growth and significant government spending on water management are key drivers.
Within market segments, the Plunger type of reciprocating pump holds a dominant position. Plunger pumps are favored for their ability to generate very high pressures, making them ideal for demanding applications in the oil and gas sector for drilling and fracturing, as well as in chemical processing and high-pressure cleaning. Their robust construction and reliability in harsh environments contribute to their widespread adoption.
In terms of mechanism, the 100-300 m3/h flow rate segment is a significant contributor to the market. This range offers a balance between capacity and flexibility, catering to a broad spectrum of industrial processes that require moderate to high throughput. This segment is particularly strong in chemical processing, general industrial applications, and water treatment facilities. The 300-800 m3/h segment is also crucial, supporting larger-scale operations.
The Oil & Gas end-user segment is a primary driver of market growth, accounting for a substantial share. The inherent need for high-pressure and reliable fluid transfer in exploration, production, and refining operations makes reciprocating pumps indispensable. This is closely followed by the Water & Waste Water segment, driven by global efforts towards clean water access and efficient wastewater management, requiring pumps for various treatment stages and distribution networks. The Chemical industry also represents a significant end-user, utilizing reciprocating pumps for precise dosing, transfer of corrosive fluids, and high-pressure reactions. The market size is estimated to reach $5.1 billion by 2033.
Global Reciprocating Pumps Market Product Developments
Product development in the global reciprocating pumps market is focused on enhancing efficiency, durability, and adaptability. Innovations are geared towards creating pumps that offer higher flow rates, improved pressure capabilities, and greater resistance to abrasive and corrosive media. Manufacturers are also integrating advanced materials and designs to reduce energy consumption and minimize maintenance requirements. The development of modular pump designs and smart features for remote monitoring and diagnostics are key trends, providing end-users with increased operational control and predictive maintenance capabilities. These advancements enable reciprocating pumps to better meet the evolving demands of critical industries such as oil & gas, water treatment, and chemical processing, ensuring competitive advantage and market relevance.
Report Scope & Segmentation Analysis
This report provides a comprehensive analysis of the global reciprocating pumps market, segmented by Type, Mechanism, and End-User. The Type segmentation includes Piston, Plunger, and Diaphragm pumps, each catering to distinct pressure and fluid handling requirements. The Mechanism segmentation analyzes flow rates into Up to 100 m3/h, 100-300 m3/h, 300-800 m3/h, and Above 800 m3/h, reflecting varying operational capacities. The End-User segmentation covers key industries such as Oil & Gas, Water & Waste Water, Mining, Chemical, Food & Beverages, Pulp & Paper, and Others, highlighting application-specific demand. Growth projections and market sizes are detailed for each segment, alongside an analysis of competitive dynamics. The market is projected to reach $5.1 billion by 2033.
Key Drivers of Global Reciprocating Pumps Market Growth
The global reciprocating pumps market is propelled by several key drivers. Firstly, the robust demand from the oil and gas industry for high-pressure applications and enhanced oil recovery initiatives is a significant growth catalyst. Secondly, expanding global investments in water and wastewater treatment infrastructure, driven by population growth and environmental concerns, fuels demand for reliable pumping solutions. Thirdly, the increasing industrialization and manufacturing activities across emerging economies necessitate efficient fluid handling systems. Technological advancements leading to more durable, energy-efficient, and smart reciprocating pumps are also crucial drivers, enabling higher performance and lower operational costs for end-users. Regulatory pressures mandating stricter environmental standards are encouraging the adoption of advanced pumping technologies that minimize emissions and leakage.
Challenges in the Global Reciprocating Pumps Market Sector
Despite robust growth prospects, the global reciprocating pumps market faces several challenges. Intense competition from alternative pumping technologies, such as centrifugal pumps, which may offer lower upfront costs for certain applications, poses a significant barrier. Fluctuations in raw material prices, particularly for metals and specialized alloys used in pump manufacturing, can impact profitability and pricing strategies. Stringent and evolving regulatory landscapes related to emissions, safety, and environmental impact can necessitate costly product redesigns and compliance efforts. Furthermore, the skilled labor shortage for specialized manufacturing and maintenance of complex reciprocating pumps can hinder production and service delivery. Supply chain disruptions, as witnessed in recent years, can also impact the availability of components and lead to production delays, affecting market growth.
Emerging Opportunities in Global Reciprocating Pumps Market
Emerging opportunities within the global reciprocating pumps market are substantial, driven by technological innovation and evolving industry needs. The increasing adoption of digital technologies, including IoT and AI for predictive maintenance and remote monitoring of pump performance, presents a significant opportunity to enhance customer value and create new service revenue streams. The growing focus on renewable energy sources, such as hydropower and geothermal energy, is creating new demand for specialized reciprocating pumps. Furthermore, the expansion of the food and beverage industry, particularly in developing regions, requires precise and hygienic pumping solutions, an area where diaphragm reciprocating pumps can excel. The development of pumps designed for handling advanced materials, such as specialized chemicals and supercritical fluids, also opens up new niche markets. The global market is projected to reach $5.1 billion by 2033.
Leading Players in the Global Reciprocating Pumps Market Market
- URACA GmbH & Co KG
- Cat Pumps
- Wasp Pumps Pvt Ltd
- Flowserve Corporation
- Ram Pumps Ltd
- PSG Dover
- Peroni Pompe SPA
- Celeros Flow Technology
- DMW Corporation
- TEIKOKU MACHINERY WORKS LTD
Key Developments in Global Reciprocating Pumps Market Industry
- June 2021: Alfa Laval announced the launch of its new DuraCirc Circumferential Piston Pump. With flow rates up to 150 m3/h, the pump can handle operating pressures up to 580 psi (40 bar). Additionally, its optional ports make it easy to replace existing pumps from Alfa Laval and other brands with the DuraCirc without adapting pipework. This development enhances product offerings and addresses the need for seamless upgrades.
- March 2021: To address the need for pumps with lower pulsation, Diaphragm pump manufacturer KNF added the FP 70 to its smooth flow liquid pump range. The new product improves the efficiency of the pump and the customer's fluidic system. This innovation caters to applications requiring highly stable and consistent fluid flow.
Strategic Outlook for Global Reciprocating Pumps Market Market
The strategic outlook for the global reciprocating pumps market is characterized by sustained growth and innovation. The market's trajectory is being shaped by increasing demand from critical sectors like oil & gas and water treatment, alongside the adoption of advanced technologies such as IoT and AI for enhanced operational efficiency. Manufacturers are focusing on developing more energy-efficient, environmentally compliant, and durable pumps to meet evolving industry standards and customer expectations. Strategic partnerships, mergers, and acquisitions will continue to play a vital role in market consolidation and expansion. The growing emphasis on infrastructure development and industrial automation in emerging economies presents significant opportunities for market players. The overall outlook suggests a dynamic market driven by technological advancements and expanding application areas, with a projected market size of $5.1 billion by 2033.
Global Reciprocating Pumps Market Segmentation
-
1. Type
- 1.1. Piston
- 1.2. Plunger
- 1.3. Diaphragm
-
2. Mechnism
- 2.1. Up to 100 m3/h
- 2.2. 100-300 m3/h
- 2.3. 300-800 m3/h
- 2.4. Above 800 m3/h
-
3. End-User
- 3.1. Oil & Gas
- 3.2. Water & Waste Water
- 3.3. Mining
- 3.4. Chemical
- 3.5. Food & Beverages
- 3.6. Pulp & Paper
- 3.7. Others
Global Reciprocating Pumps Market Segmentation By Geography
- 1. North America
- 2. Asia Pacific
- 3. Europe
- 4. Latin America
- 5. Middle East and Africa
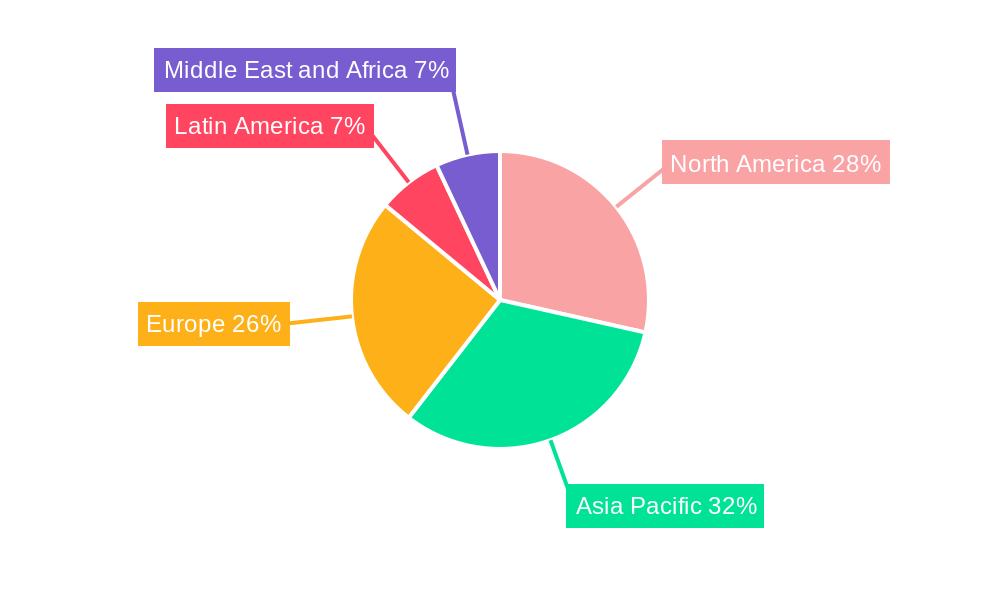
Global Reciprocating Pumps Market Regional Market Share
Geographic Coverage of Global Reciprocating Pumps Market
Global Reciprocating Pumps Market REPORT HIGHLIGHTS
| Aspects | Details |
|---|---|
| Study Period | 2020-2034 |
| Base Year | 2025 |
| Estimated Year | 2026 |
| Forecast Period | 2026-2034 |
| Historical Period | 2020-2025 |
| Growth Rate | CAGR of 7.2% from 2020-2034 |
| Segmentation |
|
Table of Contents
- 1. Introduction
- 1.1. Research Scope
- 1.2. Market Segmentation
- 1.3. Research Objective
- 1.4. Definitions and Assumptions
- 2. Executive Summary
- 2.1. Market Snapshot
- 3. Market Dynamics
- 3.1. Market Drivers
- 3.2. Market Restrains
- 3.3. Market Trends
- 3.4. Market Opportunities
- 4. Market Factor Analysis
- 4.1. Porters Five Forces
- 4.1.1. Bargaining Power of Suppliers
- 4.1.2. Bargaining Power of Buyers
- 4.1.3. Threat of New Entrants
- 4.1.4. Threat of Substitutes
- 4.1.5. Competitive Rivalry
- 4.2. PESTEL analysis
- 4.3. BCG Analysis
- 4.3.1. Stars (High Growth, High Market Share)
- 4.3.2. Cash Cows (Low Growth, High Market Share)
- 4.3.3. Question Mark (High Growth, Low Market Share)
- 4.3.4. Dogs (Low Growth, Low Market Share)
- 4.4. Ansoff Matrix Analysis
- 4.5. Supply Chain Analysis
- 4.6. Regulatory Landscape
- 4.7. Current Market Potential and Opportunity Assessment (TAM–SAM–SOM Framework)
- 4.8. RAX Analyst Note
- 4.1. Porters Five Forces
- 5. Market Analysis, Insights and Forecast 2021-2033
- 5.1. Market Analysis, Insights and Forecast - by Type
- 5.1.1. Piston
- 5.1.2. Plunger
- 5.1.3. Diaphragm
- 5.2. Market Analysis, Insights and Forecast - by Mechnism
- 5.2.1. Up to 100 m3/h
- 5.2.2. 100-300 m3/h
- 5.2.3. 300-800 m3/h
- 5.2.4. Above 800 m3/h
- 5.3. Market Analysis, Insights and Forecast - by End-User
- 5.3.1. Oil & Gas
- 5.3.2. Water & Waste Water
- 5.3.3. Mining
- 5.3.4. Chemical
- 5.3.5. Food & Beverages
- 5.3.6. Pulp & Paper
- 5.3.7. Others
- 5.4. Market Analysis, Insights and Forecast - by Region
- 5.4.1. North America
- 5.4.2. Asia Pacific
- 5.4.3. Europe
- 5.4.4. Latin America
- 5.4.5. Middle East and Africa
- 5.1. Market Analysis, Insights and Forecast - by Type
- 6. Global Reciprocating Pumps Market Analysis, Insights and Forecast, 2021-2033
- 6.1. Market Analysis, Insights and Forecast - by Type
- 6.1.1. Piston
- 6.1.2. Plunger
- 6.1.3. Diaphragm
- 6.2. Market Analysis, Insights and Forecast - by Mechnism
- 6.2.1. Up to 100 m3/h
- 6.2.2. 100-300 m3/h
- 6.2.3. 300-800 m3/h
- 6.2.4. Above 800 m3/h
- 6.3. Market Analysis, Insights and Forecast - by End-User
- 6.3.1. Oil & Gas
- 6.3.2. Water & Waste Water
- 6.3.3. Mining
- 6.3.4. Chemical
- 6.3.5. Food & Beverages
- 6.3.6. Pulp & Paper
- 6.3.7. Others
- 6.1. Market Analysis, Insights and Forecast - by Type
- 7. North America Global Reciprocating Pumps Market Analysis, Insights and Forecast, 2020-2032
- 7.1. Market Analysis, Insights and Forecast - by Type
- 7.1.1. Piston
- 7.1.2. Plunger
- 7.1.3. Diaphragm
- 7.2. Market Analysis, Insights and Forecast - by Mechnism
- 7.2.1. Up to 100 m3/h
- 7.2.2. 100-300 m3/h
- 7.2.3. 300-800 m3/h
- 7.2.4. Above 800 m3/h
- 7.3. Market Analysis, Insights and Forecast - by End-User
- 7.3.1. Oil & Gas
- 7.3.2. Water & Waste Water
- 7.3.3. Mining
- 7.3.4. Chemical
- 7.3.5. Food & Beverages
- 7.3.6. Pulp & Paper
- 7.3.7. Others
- 7.1. Market Analysis, Insights and Forecast - by Type
- 8. Asia Pacific Global Reciprocating Pumps Market Analysis, Insights and Forecast, 2020-2032
- 8.1. Market Analysis, Insights and Forecast - by Type
- 8.1.1. Piston
- 8.1.2. Plunger
- 8.1.3. Diaphragm
- 8.2. Market Analysis, Insights and Forecast - by Mechnism
- 8.2.1. Up to 100 m3/h
- 8.2.2. 100-300 m3/h
- 8.2.3. 300-800 m3/h
- 8.2.4. Above 800 m3/h
- 8.3. Market Analysis, Insights and Forecast - by End-User
- 8.3.1. Oil & Gas
- 8.3.2. Water & Waste Water
- 8.3.3. Mining
- 8.3.4. Chemical
- 8.3.5. Food & Beverages
- 8.3.6. Pulp & Paper
- 8.3.7. Others
- 8.1. Market Analysis, Insights and Forecast - by Type
- 9. Europe Global Reciprocating Pumps Market Analysis, Insights and Forecast, 2020-2032
- 9.1. Market Analysis, Insights and Forecast - by Type
- 9.1.1. Piston
- 9.1.2. Plunger
- 9.1.3. Diaphragm
- 9.2. Market Analysis, Insights and Forecast - by Mechnism
- 9.2.1. Up to 100 m3/h
- 9.2.2. 100-300 m3/h
- 9.2.3. 300-800 m3/h
- 9.2.4. Above 800 m3/h
- 9.3. Market Analysis, Insights and Forecast - by End-User
- 9.3.1. Oil & Gas
- 9.3.2. Water & Waste Water
- 9.3.3. Mining
- 9.3.4. Chemical
- 9.3.5. Food & Beverages
- 9.3.6. Pulp & Paper
- 9.3.7. Others
- 9.1. Market Analysis, Insights and Forecast - by Type
- 10. Latin America Global Reciprocating Pumps Market Analysis, Insights and Forecast, 2020-2032
- 10.1. Market Analysis, Insights and Forecast - by Type
- 10.1.1. Piston
- 10.1.2. Plunger
- 10.1.3. Diaphragm
- 10.2. Market Analysis, Insights and Forecast - by Mechnism
- 10.2.1. Up to 100 m3/h
- 10.2.2. 100-300 m3/h
- 10.2.3. 300-800 m3/h
- 10.2.4. Above 800 m3/h
- 10.3. Market Analysis, Insights and Forecast - by End-User
- 10.3.1. Oil & Gas
- 10.3.2. Water & Waste Water
- 10.3.3. Mining
- 10.3.4. Chemical
- 10.3.5. Food & Beverages
- 10.3.6. Pulp & Paper
- 10.3.7. Others
- 10.1. Market Analysis, Insights and Forecast - by Type
- 11. Middle East and Africa Global Reciprocating Pumps Market Analysis, Insights and Forecast, 2020-2032
- 11.1. Market Analysis, Insights and Forecast - by Type
- 11.1.1. Piston
- 11.1.2. Plunger
- 11.1.3. Diaphragm
- 11.2. Market Analysis, Insights and Forecast - by Mechnism
- 11.2.1. Up to 100 m3/h
- 11.2.2. 100-300 m3/h
- 11.2.3. 300-800 m3/h
- 11.2.4. Above 800 m3/h
- 11.3. Market Analysis, Insights and Forecast - by End-User
- 11.3.1. Oil & Gas
- 11.3.2. Water & Waste Water
- 11.3.3. Mining
- 11.3.4. Chemical
- 11.3.5. Food & Beverages
- 11.3.6. Pulp & Paper
- 11.3.7. Others
- 11.1. Market Analysis, Insights and Forecast - by Type
- 12. Competitive Analysis
- 12.1. Company Profiles
- 12.1.1 URACA GmbH & Co KG
- 12.1.1.1. Company Overview
- 12.1.1.2. Products
- 12.1.1.3. Company Financials
- 12.1.1.4. SWOT Analysis
- 12.1.2 Cat Pumps
- 12.1.2.1. Company Overview
- 12.1.2.2. Products
- 12.1.2.3. Company Financials
- 12.1.2.4. SWOT Analysis
- 12.1.3 Wasp Pumps Pvt Ltd
- 12.1.3.1. Company Overview
- 12.1.3.2. Products
- 12.1.3.3. Company Financials
- 12.1.3.4. SWOT Analysis
- 12.1.4 Flowserve Corporation
- 12.1.4.1. Company Overview
- 12.1.4.2. Products
- 12.1.4.3. Company Financials
- 12.1.4.4. SWOT Analysis
- 12.1.5 Ram Pumps Ltd
- 12.1.5.1. Company Overview
- 12.1.5.2. Products
- 12.1.5.3. Company Financials
- 12.1.5.4. SWOT Analysis
- 12.1.6 PSG Dover
- 12.1.6.1. Company Overview
- 12.1.6.2. Products
- 12.1.6.3. Company Financials
- 12.1.6.4. SWOT Analysis
- 12.1.7 Peroni Pompe SPA
- 12.1.7.1. Company Overview
- 12.1.7.2. Products
- 12.1.7.3. Company Financials
- 12.1.7.4. SWOT Analysis
- 12.1.8 Celeros Flow Technology
- 12.1.8.1. Company Overview
- 12.1.8.2. Products
- 12.1.8.3. Company Financials
- 12.1.8.4. SWOT Analysis
- 12.1.9 DMW Corporation
- 12.1.9.1. Company Overview
- 12.1.9.2. Products
- 12.1.9.3. Company Financials
- 12.1.9.4. SWOT Analysis
- 12.1.10 TEIKOKU MACHINERY WORKS LTD
- 12.1.10.1. Company Overview
- 12.1.10.2. Products
- 12.1.10.3. Company Financials
- 12.1.10.4. SWOT Analysis
- 12.1.1 URACA GmbH & Co KG
- 12.2. Market Entropy
- 12.2.1 Company's Key Areas Served
- 12.2.2 Recent Developments
- 12.3. Company Market Share Analysis 2025
- 12.3.1 Top 5 Companies Market Share Analysis
- 12.3.2 Top 3 Companies Market Share Analysis
- 12.4. List of Potential Customers
- 13. Research Methodology
List of Figures
- Figure 1: Global Global Reciprocating Pumps Market Revenue Breakdown (billion, %) by Region 2025 & 2033
- Figure 2: Global Global Reciprocating Pumps Market Volume Breakdown (K Unit, %) by Region 2025 & 2033
- Figure 3: North America Global Reciprocating Pumps Market Revenue (billion), by Type 2025 & 2033
- Figure 4: North America Global Reciprocating Pumps Market Volume (K Unit), by Type 2025 & 2033
- Figure 5: North America Global Reciprocating Pumps Market Revenue Share (%), by Type 2025 & 2033
- Figure 6: North America Global Reciprocating Pumps Market Volume Share (%), by Type 2025 & 2033
- Figure 7: North America Global Reciprocating Pumps Market Revenue (billion), by Mechnism 2025 & 2033
- Figure 8: North America Global Reciprocating Pumps Market Volume (K Unit), by Mechnism 2025 & 2033
- Figure 9: North America Global Reciprocating Pumps Market Revenue Share (%), by Mechnism 2025 & 2033
- Figure 10: North America Global Reciprocating Pumps Market Volume Share (%), by Mechnism 2025 & 2033
- Figure 11: North America Global Reciprocating Pumps Market Revenue (billion), by End-User 2025 & 2033
- Figure 12: North America Global Reciprocating Pumps Market Volume (K Unit), by End-User 2025 & 2033
- Figure 13: North America Global Reciprocating Pumps Market Revenue Share (%), by End-User 2025 & 2033
- Figure 14: North America Global Reciprocating Pumps Market Volume Share (%), by End-User 2025 & 2033
- Figure 15: North America Global Reciprocating Pumps Market Revenue (billion), by Country 2025 & 2033
- Figure 16: North America Global Reciprocating Pumps Market Volume (K Unit), by Country 2025 & 2033
- Figure 17: North America Global Reciprocating Pumps Market Revenue Share (%), by Country 2025 & 2033
- Figure 18: North America Global Reciprocating Pumps Market Volume Share (%), by Country 2025 & 2033
- Figure 19: Asia Pacific Global Reciprocating Pumps Market Revenue (billion), by Type 2025 & 2033
- Figure 20: Asia Pacific Global Reciprocating Pumps Market Volume (K Unit), by Type 2025 & 2033
- Figure 21: Asia Pacific Global Reciprocating Pumps Market Revenue Share (%), by Type 2025 & 2033
- Figure 22: Asia Pacific Global Reciprocating Pumps Market Volume Share (%), by Type 2025 & 2033
- Figure 23: Asia Pacific Global Reciprocating Pumps Market Revenue (billion), by Mechnism 2025 & 2033
- Figure 24: Asia Pacific Global Reciprocating Pumps Market Volume (K Unit), by Mechnism 2025 & 2033
- Figure 25: Asia Pacific Global Reciprocating Pumps Market Revenue Share (%), by Mechnism 2025 & 2033
- Figure 26: Asia Pacific Global Reciprocating Pumps Market Volume Share (%), by Mechnism 2025 & 2033
- Figure 27: Asia Pacific Global Reciprocating Pumps Market Revenue (billion), by End-User 2025 & 2033
- Figure 28: Asia Pacific Global Reciprocating Pumps Market Volume (K Unit), by End-User 2025 & 2033
- Figure 29: Asia Pacific Global Reciprocating Pumps Market Revenue Share (%), by End-User 2025 & 2033
- Figure 30: Asia Pacific Global Reciprocating Pumps Market Volume Share (%), by End-User 2025 & 2033
- Figure 31: Asia Pacific Global Reciprocating Pumps Market Revenue (billion), by Country 2025 & 2033
- Figure 32: Asia Pacific Global Reciprocating Pumps Market Volume (K Unit), by Country 2025 & 2033
- Figure 33: Asia Pacific Global Reciprocating Pumps Market Revenue Share (%), by Country 2025 & 2033
- Figure 34: Asia Pacific Global Reciprocating Pumps Market Volume Share (%), by Country 2025 & 2033
- Figure 35: Europe Global Reciprocating Pumps Market Revenue (billion), by Type 2025 & 2033
- Figure 36: Europe Global Reciprocating Pumps Market Volume (K Unit), by Type 2025 & 2033
- Figure 37: Europe Global Reciprocating Pumps Market Revenue Share (%), by Type 2025 & 2033
- Figure 38: Europe Global Reciprocating Pumps Market Volume Share (%), by Type 2025 & 2033
- Figure 39: Europe Global Reciprocating Pumps Market Revenue (billion), by Mechnism 2025 & 2033
- Figure 40: Europe Global Reciprocating Pumps Market Volume (K Unit), by Mechnism 2025 & 2033
- Figure 41: Europe Global Reciprocating Pumps Market Revenue Share (%), by Mechnism 2025 & 2033
- Figure 42: Europe Global Reciprocating Pumps Market Volume Share (%), by Mechnism 2025 & 2033
- Figure 43: Europe Global Reciprocating Pumps Market Revenue (billion), by End-User 2025 & 2033
- Figure 44: Europe Global Reciprocating Pumps Market Volume (K Unit), by End-User 2025 & 2033
- Figure 45: Europe Global Reciprocating Pumps Market Revenue Share (%), by End-User 2025 & 2033
- Figure 46: Europe Global Reciprocating Pumps Market Volume Share (%), by End-User 2025 & 2033
- Figure 47: Europe Global Reciprocating Pumps Market Revenue (billion), by Country 2025 & 2033
- Figure 48: Europe Global Reciprocating Pumps Market Volume (K Unit), by Country 2025 & 2033
- Figure 49: Europe Global Reciprocating Pumps Market Revenue Share (%), by Country 2025 & 2033
- Figure 50: Europe Global Reciprocating Pumps Market Volume Share (%), by Country 2025 & 2033
- Figure 51: Latin America Global Reciprocating Pumps Market Revenue (billion), by Type 2025 & 2033
- Figure 52: Latin America Global Reciprocating Pumps Market Volume (K Unit), by Type 2025 & 2033
- Figure 53: Latin America Global Reciprocating Pumps Market Revenue Share (%), by Type 2025 & 2033
- Figure 54: Latin America Global Reciprocating Pumps Market Volume Share (%), by Type 2025 & 2033
- Figure 55: Latin America Global Reciprocating Pumps Market Revenue (billion), by Mechnism 2025 & 2033
- Figure 56: Latin America Global Reciprocating Pumps Market Volume (K Unit), by Mechnism 2025 & 2033
- Figure 57: Latin America Global Reciprocating Pumps Market Revenue Share (%), by Mechnism 2025 & 2033
- Figure 58: Latin America Global Reciprocating Pumps Market Volume Share (%), by Mechnism 2025 & 2033
- Figure 59: Latin America Global Reciprocating Pumps Market Revenue (billion), by End-User 2025 & 2033
- Figure 60: Latin America Global Reciprocating Pumps Market Volume (K Unit), by End-User 2025 & 2033
- Figure 61: Latin America Global Reciprocating Pumps Market Revenue Share (%), by End-User 2025 & 2033
- Figure 62: Latin America Global Reciprocating Pumps Market Volume Share (%), by End-User 2025 & 2033
- Figure 63: Latin America Global Reciprocating Pumps Market Revenue (billion), by Country 2025 & 2033
- Figure 64: Latin America Global Reciprocating Pumps Market Volume (K Unit), by Country 2025 & 2033
- Figure 65: Latin America Global Reciprocating Pumps Market Revenue Share (%), by Country 2025 & 2033
- Figure 66: Latin America Global Reciprocating Pumps Market Volume Share (%), by Country 2025 & 2033
- Figure 67: Middle East and Africa Global Reciprocating Pumps Market Revenue (billion), by Type 2025 & 2033
- Figure 68: Middle East and Africa Global Reciprocating Pumps Market Volume (K Unit), by Type 2025 & 2033
- Figure 69: Middle East and Africa Global Reciprocating Pumps Market Revenue Share (%), by Type 2025 & 2033
- Figure 70: Middle East and Africa Global Reciprocating Pumps Market Volume Share (%), by Type 2025 & 2033
- Figure 71: Middle East and Africa Global Reciprocating Pumps Market Revenue (billion), by Mechnism 2025 & 2033
- Figure 72: Middle East and Africa Global Reciprocating Pumps Market Volume (K Unit), by Mechnism 2025 & 2033
- Figure 73: Middle East and Africa Global Reciprocating Pumps Market Revenue Share (%), by Mechnism 2025 & 2033
- Figure 74: Middle East and Africa Global Reciprocating Pumps Market Volume Share (%), by Mechnism 2025 & 2033
- Figure 75: Middle East and Africa Global Reciprocating Pumps Market Revenue (billion), by End-User 2025 & 2033
- Figure 76: Middle East and Africa Global Reciprocating Pumps Market Volume (K Unit), by End-User 2025 & 2033
- Figure 77: Middle East and Africa Global Reciprocating Pumps Market Revenue Share (%), by End-User 2025 & 2033
- Figure 78: Middle East and Africa Global Reciprocating Pumps Market Volume Share (%), by End-User 2025 & 2033
- Figure 79: Middle East and Africa Global Reciprocating Pumps Market Revenue (billion), by Country 2025 & 2033
- Figure 80: Middle East and Africa Global Reciprocating Pumps Market Volume (K Unit), by Country 2025 & 2033
- Figure 81: Middle East and Africa Global Reciprocating Pumps Market Revenue Share (%), by Country 2025 & 2033
- Figure 82: Middle East and Africa Global Reciprocating Pumps Market Volume Share (%), by Country 2025 & 2033
List of Tables
- Table 1: Global Reciprocating Pumps Market Revenue billion Forecast, by Type 2020 & 2033
- Table 2: Global Reciprocating Pumps Market Volume K Unit Forecast, by Type 2020 & 2033
- Table 3: Global Reciprocating Pumps Market Revenue billion Forecast, by Mechnism 2020 & 2033
- Table 4: Global Reciprocating Pumps Market Volume K Unit Forecast, by Mechnism 2020 & 2033
- Table 5: Global Reciprocating Pumps Market Revenue billion Forecast, by End-User 2020 & 2033
- Table 6: Global Reciprocating Pumps Market Volume K Unit Forecast, by End-User 2020 & 2033
- Table 7: Global Reciprocating Pumps Market Revenue billion Forecast, by Region 2020 & 2033
- Table 8: Global Reciprocating Pumps Market Volume K Unit Forecast, by Region 2020 & 2033
- Table 9: Global Reciprocating Pumps Market Revenue billion Forecast, by Type 2020 & 2033
- Table 10: Global Reciprocating Pumps Market Volume K Unit Forecast, by Type 2020 & 2033
- Table 11: Global Reciprocating Pumps Market Revenue billion Forecast, by Mechnism 2020 & 2033
- Table 12: Global Reciprocating Pumps Market Volume K Unit Forecast, by Mechnism 2020 & 2033
- Table 13: Global Reciprocating Pumps Market Revenue billion Forecast, by End-User 2020 & 2033
- Table 14: Global Reciprocating Pumps Market Volume K Unit Forecast, by End-User 2020 & 2033
- Table 15: Global Reciprocating Pumps Market Revenue billion Forecast, by Country 2020 & 2033
- Table 16: Global Reciprocating Pumps Market Volume K Unit Forecast, by Country 2020 & 2033
- Table 17: Global Reciprocating Pumps Market Revenue billion Forecast, by Type 2020 & 2033
- Table 18: Global Reciprocating Pumps Market Volume K Unit Forecast, by Type 2020 & 2033
- Table 19: Global Reciprocating Pumps Market Revenue billion Forecast, by Mechnism 2020 & 2033
- Table 20: Global Reciprocating Pumps Market Volume K Unit Forecast, by Mechnism 2020 & 2033
- Table 21: Global Reciprocating Pumps Market Revenue billion Forecast, by End-User 2020 & 2033
- Table 22: Global Reciprocating Pumps Market Volume K Unit Forecast, by End-User 2020 & 2033
- Table 23: Global Reciprocating Pumps Market Revenue billion Forecast, by Country 2020 & 2033
- Table 24: Global Reciprocating Pumps Market Volume K Unit Forecast, by Country 2020 & 2033
- Table 25: Global Reciprocating Pumps Market Revenue billion Forecast, by Type 2020 & 2033
- Table 26: Global Reciprocating Pumps Market Volume K Unit Forecast, by Type 2020 & 2033
- Table 27: Global Reciprocating Pumps Market Revenue billion Forecast, by Mechnism 2020 & 2033
- Table 28: Global Reciprocating Pumps Market Volume K Unit Forecast, by Mechnism 2020 & 2033
- Table 29: Global Reciprocating Pumps Market Revenue billion Forecast, by End-User 2020 & 2033
- Table 30: Global Reciprocating Pumps Market Volume K Unit Forecast, by End-User 2020 & 2033
- Table 31: Global Reciprocating Pumps Market Revenue billion Forecast, by Country 2020 & 2033
- Table 32: Global Reciprocating Pumps Market Volume K Unit Forecast, by Country 2020 & 2033
- Table 33: Global Reciprocating Pumps Market Revenue billion Forecast, by Type 2020 & 2033
- Table 34: Global Reciprocating Pumps Market Volume K Unit Forecast, by Type 2020 & 2033
- Table 35: Global Reciprocating Pumps Market Revenue billion Forecast, by Mechnism 2020 & 2033
- Table 36: Global Reciprocating Pumps Market Volume K Unit Forecast, by Mechnism 2020 & 2033
- Table 37: Global Reciprocating Pumps Market Revenue billion Forecast, by End-User 2020 & 2033
- Table 38: Global Reciprocating Pumps Market Volume K Unit Forecast, by End-User 2020 & 2033
- Table 39: Global Reciprocating Pumps Market Revenue billion Forecast, by Country 2020 & 2033
- Table 40: Global Reciprocating Pumps Market Volume K Unit Forecast, by Country 2020 & 2033
- Table 41: Global Reciprocating Pumps Market Revenue billion Forecast, by Type 2020 & 2033
- Table 42: Global Reciprocating Pumps Market Volume K Unit Forecast, by Type 2020 & 2033
- Table 43: Global Reciprocating Pumps Market Revenue billion Forecast, by Mechnism 2020 & 2033
- Table 44: Global Reciprocating Pumps Market Volume K Unit Forecast, by Mechnism 2020 & 2033
- Table 45: Global Reciprocating Pumps Market Revenue billion Forecast, by End-User 2020 & 2033
- Table 46: Global Reciprocating Pumps Market Volume K Unit Forecast, by End-User 2020 & 2033
- Table 47: Global Reciprocating Pumps Market Revenue billion Forecast, by Country 2020 & 2033
- Table 48: Global Reciprocating Pumps Market Volume K Unit Forecast, by Country 2020 & 2033
Frequently Asked Questions
1. What is the projected Compound Annual Growth Rate (CAGR) of the Global Reciprocating Pumps Market?
The projected CAGR is approximately 7.2%.
2. Which companies are prominent players in the Global Reciprocating Pumps Market?
Key companies in the market include URACA GmbH & Co KG, Cat Pumps, Wasp Pumps Pvt Ltd, Flowserve Corporation, Ram Pumps Ltd, PSG Dover, Peroni Pompe SPA, Celeros Flow Technology, DMW Corporation, TEIKOKU MACHINERY WORKS LTD.
3. What are the main segments of the Global Reciprocating Pumps Market?
The market segments include Type, Mechnism, End-User.
4. Can you provide details about the market size?
The market size is estimated to be USD 10.05 billion as of 2022.
5. What are some drivers contributing to market growth?
Increasing Deployment in Oil & Gas Sector; Advancement in Reciprocating Pump Technology.
6. What are the notable trends driving market growth?
Oil & Gas Sector to Hold Significant Market Share.
7. Are there any restraints impacting market growth?
High Installation and Maintenance Cost Associated.
8. Can you provide examples of recent developments in the market?
June 2021 - Alfa Laval announced the launch of its new DuraCirc Circumferential Piston Pump. With flow rates up to 150 m3/h, the pump can handle operating pressures up to 580 psi (40 bar). Additionally, its optional ports make it easy to replace existing pumps from Alfa Laval and other brands with the DuraCirc without adapting pipework.
9. What pricing options are available for accessing the report?
Pricing options include single-user, multi-user, and enterprise licenses priced at USD 4750, USD 5250, and USD 8750 respectively.
10. Is the market size provided in terms of value or volume?
The market size is provided in terms of value, measured in billion and volume, measured in K Unit.
11. Are there any specific market keywords associated with the report?
Yes, the market keyword associated with the report is "Global Reciprocating Pumps Market," which aids in identifying and referencing the specific market segment covered.
12. How do I determine which pricing option suits my needs best?
The pricing options vary based on user requirements and access needs. Individual users may opt for single-user licenses, while businesses requiring broader access may choose multi-user or enterprise licenses for cost-effective access to the report.
13. Are there any additional resources or data provided in the Global Reciprocating Pumps Market report?
While the report offers comprehensive insights, it's advisable to review the specific contents or supplementary materials provided to ascertain if additional resources or data are available.
14. How can I stay updated on further developments or reports in the Global Reciprocating Pumps Market?
To stay informed about further developments, trends, and reports in the Global Reciprocating Pumps Market, consider subscribing to industry newsletters, following relevant companies and organizations, or regularly checking reputable industry news sources and publications.
Methodology
Step 1 - Identification of Relevant Samples Size from Population Database


Step 2 - Approaches for Defining Global Market Size (Value, Volume* & Price*)

Note*: In applicable scenarios
Step 3 - Data Sources
Primary Research
- Web Analytics
- Survey Reports
- Research Institute
- Latest Research Reports
- Opinion Leaders
Secondary Research
- Annual Reports
- White Paper
- Latest Press Release
- Industry Association
- Paid Database
- Investor Presentations

Step 4 - Data Triangulation
Involves using different sources of information in order to increase the validity of a study
These sources are likely to be stakeholders in a program - participants, other researchers, program staff, other community members, and so on.
Then we put all data in single framework & apply various statistical tools to find out the dynamic on the market.
During the analysis stage, feedback from the stakeholder groups would be compared to determine areas of agreement as well as areas of divergence