

Key Insights
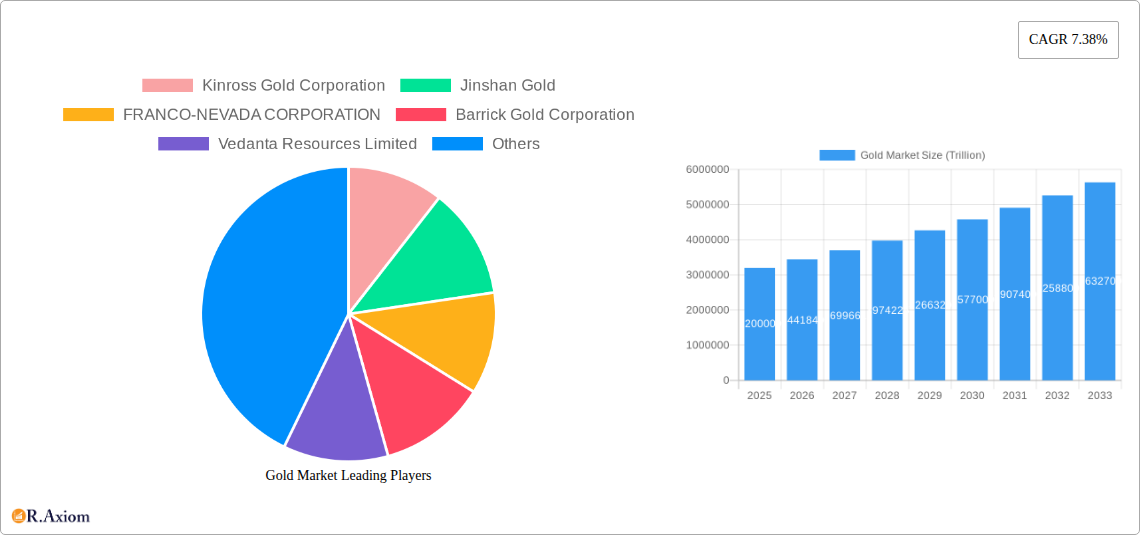
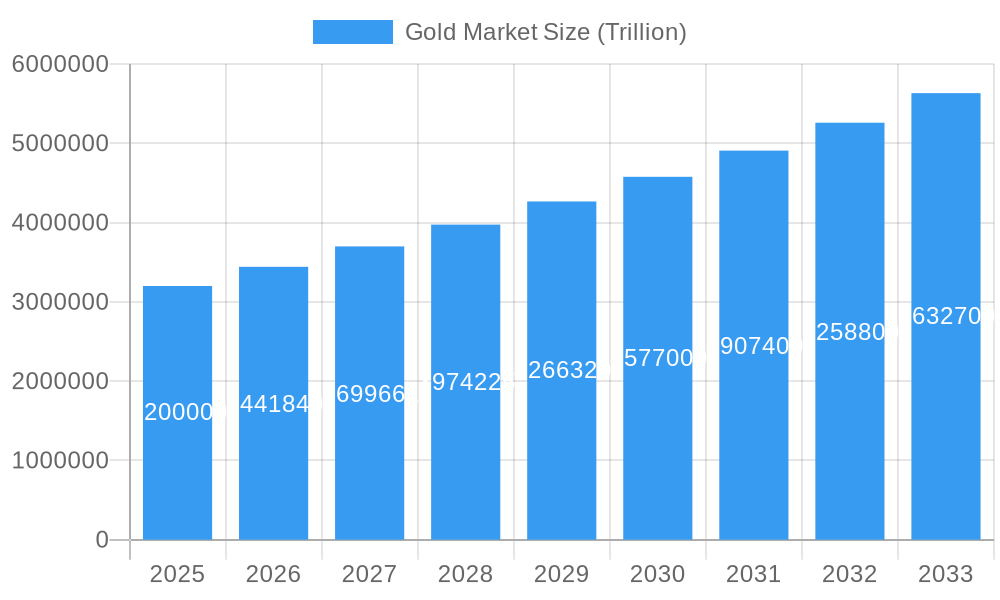
The global gold market, valued at $4000 billion in 2025, is projected for substantial expansion, with a compound annual growth rate (CAGR) of 7.38% from 2025 to 2033. Key growth drivers include escalating demand from the jewelry sector, particularly in emerging economies with rising disposable incomes. The electronics industry's continued reliance on gold's conductivity for components ensures sustained demand. Gold's role as a safe-haven asset during economic volatility further supports market growth. While smaller, the demand for gold in awards and status symbols contributes to overall market volume. Potential supply chain disruptions and price fluctuations present challenges, but the long-term outlook remains robust due to consistent demand across diverse applications and ongoing investment interest.
Gold Market Market Size (In Million)
Market segmentation highlights opportunities in alloyed and layered gold. Geographically, the Asia-Pacific region, led by China and India, dominates due to strong cultural preferences for gold jewelry and investment. North America and Europe are significant markets driven by industrial and investment demand. Key players like Barrick Gold, Newmont, and Zijin Mining Group influence market dynamics. The competitive landscape is intense, fostering price pressures and technological innovation. The 2025-2033 forecast period indicates a compelling growth trajectory, necessitating strategic navigation of market challenges.
Gold Market Company Market Share
This report offers an in-depth analysis of the global gold market, projecting significant valuation increases by 2033. It covers the historical period (2019-2024), base year (2025), and forecasts (2025-2033). Analysis extends to market segments such as Alloyed Gold and Layered Gold, and applications including Jewellery, Electronics, Awards and Status Symbols, and Other Applications (Dentistry, Aerospace). The study examines market concentration, innovation, industry trends, dominant regions, product developments, key drivers and challenges, emerging opportunities, leading players, and significant market developments, providing invaluable insights for investors and industry stakeholders.
Gold Market Market Concentration & Innovation
The global gold market exhibits a moderately concentrated structure, with several major players commanding significant market share. While precise market share figures fluctuate, companies like Barrick Gold Corporation and Newmont Corporation consistently rank among the top producers globally, controlling a significant portion of the overall supply. However, a considerable number of smaller, more regionally focused producers also contribute substantially. The industry witnesses continuous technological innovation, particularly in exploration, extraction, and processing techniques, to improve efficiency and reduce costs. The increasing adoption of advanced technologies like AI and machine learning for exploration and resource optimization is significant. Regulatory frameworks, particularly those concerning mining permits, environmental regulations, and royalties, profoundly impact market dynamics and vary significantly across jurisdictions. Product substitutes for gold in certain applications (e.g., platinum in electronics) exert limited pressure due to gold's unique properties. End-user trends, particularly in jewelry and investment, continue to drive demand. Mergers and acquisitions (M&A) activity plays a crucial role in shaping market concentration. Notable deals, such as the xx Trillion Pan American Silver Corporation acquisition of Yamana Gold Inc. in March 2023, reshape the competitive landscape and expand geographical reach.
- Market Concentration: Moderately concentrated, with a few dominant players and numerous smaller producers.
- Innovation Drivers: Advancements in exploration technologies (AI, machine learning), processing techniques, and sustainable mining practices.
- M&A Activity: Significant transactions reshaping the industry landscape with deal values exceeding xx Trillion in recent years. Example: Pan American Silver’s acquisition of Yamana Gold.
- Regulatory Frameworks: Vary significantly across jurisdictions impacting operational costs and investment decisions.
- Product Substitutes: Limited substitutes due to gold's unique properties.
- End-user Trends: Steady demand driven by investment, jewelry, and industrial applications.
Gold Market Industry Trends & Insights
The gold market is experiencing steady growth, fueled by several key factors. Investment demand remains a significant driver, with gold often perceived as a safe haven asset during economic uncertainty. Technological advancements in exploration and mining continue to improve efficiency and reduce costs, leading to increased production and potentially lower prices. Consumer preferences for gold jewelry, particularly in emerging markets with expanding middle classes, further boost market growth. However, the market is characterized by price volatility influenced by macroeconomic conditions, geopolitical events, and currency fluctuations. The Compound Annual Growth Rate (CAGR) for the forecast period (2025-2033) is projected to be around xx%, influenced by factors such as global economic growth, inflation, and investment sentiment. Market penetration remains high in established markets like jewelry, but growth opportunities are being explored in niche areas such as electronics and specialized industrial applications. Competitive dynamics are characterized by a mix of large multinational companies and smaller, regionally focused players, leading to a diverse and dynamic market structure.
Dominant Markets & Segments in Gold Market
The Jewellery segment remains the largest application area, driven by strong consumer demand in Asia, particularly India and China. The Electronics segment witnesses increasing adoption of gold in high-tech applications demanding superior conductivity and reliability. Other Applications (Dentistry, Aerospace, etc.) show steady, albeit less explosive, growth reflecting the unique properties of gold in these specific sectors.
- Leading Regions/Countries: Asia (India, China) dominates in Jewellery, while various countries contribute to other segments based on mining activities and industrial usage.
- Key Drivers: Economic growth in emerging markets (jewelry demand), technological advancements (electronics), and specific industrial requirements (other applications).
Dominance Analysis: The continued dominance of Asia in the jewellery sector is largely attributed to strong cultural affinity for gold, coupled with growing disposable incomes. However, other regions are emerging as significant players in various market segments depending on their infrastructure development and technological advancements. The global nature of the gold market makes pinpointing one specific dominant region challenging, though Asia's influence on the jewellery segment is undeniable.
Gold Market Product Developments
Recent product developments focus on refining techniques, enhancing purity, and exploring new alloys to meet the diverse requirements of various applications. Technological advancements in recycling and refining are improving efficiency and minimizing environmental impact, aligning with growing sustainability concerns. The market continuously witnesses new alloys and formulations designed to offer enhanced properties for specialized applications. These developments cater to the increasing need for high-performance materials in demanding sectors like aerospace and electronics.
Report Scope & Segmentation Analysis
This report segments the gold market by type (Alloyed Gold, Layered Gold) and application (Jewellery, Electronics, Awards and Status Symbols, Other Applications). Each segment is analyzed in detail, including growth projections, market size estimates, and competitive dynamics. For instance, the Alloyed Gold segment exhibits strong growth across various applications, while Layered Gold finds significant use in specialized electronics. Market sizes are projected in Trillions, reflecting substantial growth across all segments during the forecast period (2025-2033). Competitive dynamics within each segment vary, depending on the level of concentration and the presence of niche players.
Key Drivers of Gold Market Growth
Several factors drive gold market growth: strong investment demand viewed as a safe haven asset, increasing industrial applications in electronics and other specialized sectors, robust demand for gold jewelry, especially in emerging markets, and ongoing technological advancements in exploration and extraction that improve efficiency and reduce costs. Furthermore, central bank purchases and government policies in some regions also contribute positively.
Challenges in the Gold Market Sector
Significant challenges exist, including price volatility influenced by macroeconomic factors and geopolitical events, environmental concerns and sustainability pressure, regulatory hurdles and varying mining policies across jurisdictions, and supply chain disruptions impacting production and distribution. These factors can significantly influence market stability and investment decisions. The environmental impact of gold mining necessitates sustainable practices, requiring substantial investments and careful regulatory oversight.
Emerging Opportunities in Gold Market
Emerging opportunities exist within the rapidly evolving technological landscape. The increasing integration of gold in advanced electronics and other high-tech applications presents a significant growth pathway. Additionally, the exploration of sustainable mining practices and responsible sourcing initiatives opens avenues for enhanced market credibility and potentially higher price premiums for ethically sourced gold. New markets in emerging economies, particularly in Asia and Africa, offer substantial growth potential driven by increasing consumer demand and infrastructure development.
Leading Players in the Gold Market Market
- Kinross Gold Corporation
- Jinshan Gold
- FRANCO-NEVADA CORPORATION
- Barrick Gold Corporation
- Vedanta Resources Limited
- PJSC Polyus
- Gabriel Resources Ltd
- Tertiary Minerals
- FURUKAWA CO LTD
- Johnson Matthey
- Agnico Eagle Mines Limited
- Zijin Mining Group
- New Gold Inc
- Harmony Gold Mining Company Limited
- Newmont Corporation
Key Developments in Gold Market Industry
- March 2023: Pan American Silver Corporation's acquisition of Yamana Gold Inc. significantly expanded its Latin American operations. This xx Trillion deal reshaped the competitive landscape and increased production capacity.
- February 2023: Barrick Gold Corporation reported a 10% increase in gold reserves, strengthening its position as a leading gold producer. This signals increased production potential and market stability.
Strategic Outlook for Gold Market Market
The gold market's future appears promising, driven by consistent investment demand, ongoing technological advancements, and expanding consumer markets, particularly in emerging economies. Growth catalysts include continued innovation in mining technologies, increased focus on sustainability, and exploration of new applications in high-tech sectors. However, successfully navigating macroeconomic volatility and addressing environmental concerns will be critical for sustained growth and market stability. The long-term outlook suggests a positive trajectory, although price fluctuations are expected to continue.
Gold Market Segmentation
-
1. Type
- 1.1. Alloyed Gold
- 1.2. Layered Gold
-
2. Application
- 2.1. Jewellery
- 2.2. Electronics
- 2.3. Awards and Status Symbols
- 2.4. Other Applications (Dentistry, Aerospace, etc.)
Gold Market Segmentation By Geography
-
1. Asia Pacific
- 1.1. China
- 1.2. India
- 1.3. Japan
- 1.4. South Korea
- 1.5. Rest of Asia Pacific
-
2. North America
- 2.1. United States
- 2.2. Canada
- 2.3. Mexico
-
3. Europe
- 3.1. Germany
- 3.2. United Kingdom
- 3.3. Italy
- 3.4. France
- 3.5. Rest of Europe
-
4. South America
- 4.1. Brazil
- 4.2. Argentina
- 4.3. Rest of South America
-
5. Middle East and Africa
- 5.1. Saudi Arabia
- 5.2. South Africa
- 5.3. Rest of Middle East and Africa
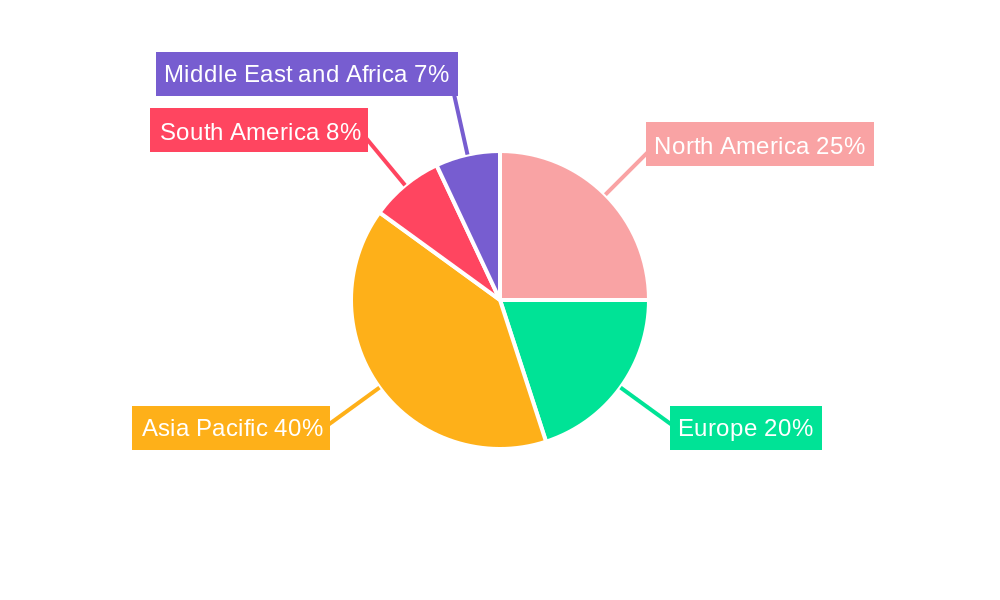
Gold Market Regional Market Share
Geographic Coverage of Gold Market
Gold Market REPORT HIGHLIGHTS
| Aspects | Details |
|---|---|
| Study Period | 2020-2034 |
| Base Year | 2025 |
| Estimated Year | 2026 |
| Forecast Period | 2026-2034 |
| Historical Period | 2020-2025 |
| Growth Rate | CAGR of 7.38% from 2020-2034 |
| Segmentation |
|
Table of Contents
- 1. Introduction
- 1.1. Research Scope
- 1.2. Market Segmentation
- 1.3. Research Objective
- 1.4. Definitions and Assumptions
- 2. Executive Summary
- 2.1. Market Snapshot
- 3. Market Dynamics
- 3.1. Market Drivers
- 3.2. Market Restrains
- 3.3. Market Trends
- 3.4. Market Opportunities
- 4. Market Factor Analysis
- 4.1. Porters Five Forces
- 4.1.1. Bargaining Power of Suppliers
- 4.1.2. Bargaining Power of Buyers
- 4.1.3. Threat of New Entrants
- 4.1.4. Threat of Substitutes
- 4.1.5. Competitive Rivalry
- 4.2. PESTEL analysis
- 4.3. BCG Analysis
- 4.3.1. Stars (High Growth, High Market Share)
- 4.3.2. Cash Cows (Low Growth, High Market Share)
- 4.3.3. Question Mark (High Growth, Low Market Share)
- 4.3.4. Dogs (Low Growth, Low Market Share)
- 4.4. Ansoff Matrix Analysis
- 4.5. Supply Chain Analysis
- 4.6. Regulatory Landscape
- 4.7. Current Market Potential and Opportunity Assessment (TAM–SAM–SOM Framework)
- 4.8. RAX Analyst Note
- 4.1. Porters Five Forces
- 5. Market Analysis, Insights and Forecast 2021-2033
- 5.1. Market Analysis, Insights and Forecast - by Type
- 5.1.1. Alloyed Gold
- 5.1.2. Layered Gold
- 5.2. Market Analysis, Insights and Forecast - by Application
- 5.2.1. Jewellery
- 5.2.2. Electronics
- 5.2.3. Awards and Status Symbols
- 5.2.4. Other Applications (Dentistry, Aerospace, etc.)
- 5.3. Market Analysis, Insights and Forecast - by Region
- 5.3.1. Asia Pacific
- 5.3.2. North America
- 5.3.3. Europe
- 5.3.4. South America
- 5.3.5. Middle East and Africa
- 5.1. Market Analysis, Insights and Forecast - by Type
- 6. Global Gold Market Analysis, Insights and Forecast, 2021-2033
- 6.1. Market Analysis, Insights and Forecast - by Type
- 6.1.1. Alloyed Gold
- 6.1.2. Layered Gold
- 6.2. Market Analysis, Insights and Forecast - by Application
- 6.2.1. Jewellery
- 6.2.2. Electronics
- 6.2.3. Awards and Status Symbols
- 6.2.4. Other Applications (Dentistry, Aerospace, etc.)
- 6.1. Market Analysis, Insights and Forecast - by Type
- 7. Asia Pacific Gold Market Analysis, Insights and Forecast, 2020-2032
- 7.1. Market Analysis, Insights and Forecast - by Type
- 7.1.1. Alloyed Gold
- 7.1.2. Layered Gold
- 7.2. Market Analysis, Insights and Forecast - by Application
- 7.2.1. Jewellery
- 7.2.2. Electronics
- 7.2.3. Awards and Status Symbols
- 7.2.4. Other Applications (Dentistry, Aerospace, etc.)
- 7.1. Market Analysis, Insights and Forecast - by Type
- 8. North America Gold Market Analysis, Insights and Forecast, 2020-2032
- 8.1. Market Analysis, Insights and Forecast - by Type
- 8.1.1. Alloyed Gold
- 8.1.2. Layered Gold
- 8.2. Market Analysis, Insights and Forecast - by Application
- 8.2.1. Jewellery
- 8.2.2. Electronics
- 8.2.3. Awards and Status Symbols
- 8.2.4. Other Applications (Dentistry, Aerospace, etc.)
- 8.1. Market Analysis, Insights and Forecast - by Type
- 9. Europe Gold Market Analysis, Insights and Forecast, 2020-2032
- 9.1. Market Analysis, Insights and Forecast - by Type
- 9.1.1. Alloyed Gold
- 9.1.2. Layered Gold
- 9.2. Market Analysis, Insights and Forecast - by Application
- 9.2.1. Jewellery
- 9.2.2. Electronics
- 9.2.3. Awards and Status Symbols
- 9.2.4. Other Applications (Dentistry, Aerospace, etc.)
- 9.1. Market Analysis, Insights and Forecast - by Type
- 10. South America Gold Market Analysis, Insights and Forecast, 2020-2032
- 10.1. Market Analysis, Insights and Forecast - by Type
- 10.1.1. Alloyed Gold
- 10.1.2. Layered Gold
- 10.2. Market Analysis, Insights and Forecast - by Application
- 10.2.1. Jewellery
- 10.2.2. Electronics
- 10.2.3. Awards and Status Symbols
- 10.2.4. Other Applications (Dentistry, Aerospace, etc.)
- 10.1. Market Analysis, Insights and Forecast - by Type
- 11. Middle East and Africa Gold Market Analysis, Insights and Forecast, 2020-2032
- 11.1. Market Analysis, Insights and Forecast - by Type
- 11.1.1. Alloyed Gold
- 11.1.2. Layered Gold
- 11.2. Market Analysis, Insights and Forecast - by Application
- 11.2.1. Jewellery
- 11.2.2. Electronics
- 11.2.3. Awards and Status Symbols
- 11.2.4. Other Applications (Dentistry, Aerospace, etc.)
- 11.1. Market Analysis, Insights and Forecast - by Type
- 12. Competitive Analysis
- 12.1. Company Profiles
- 12.1.1 Kinross Gold Corporation
- 12.1.1.1. Company Overview
- 12.1.1.2. Products
- 12.1.1.3. Company Financials
- 12.1.1.4. SWOT Analysis
- 12.1.2 Jinshan Gold
- 12.1.2.1. Company Overview
- 12.1.2.2. Products
- 12.1.2.3. Company Financials
- 12.1.2.4. SWOT Analysis
- 12.1.3 FRANCO-NEVADA CORPORATION
- 12.1.3.1. Company Overview
- 12.1.3.2. Products
- 12.1.3.3. Company Financials
- 12.1.3.4. SWOT Analysis
- 12.1.4 Barrick Gold Corporation
- 12.1.4.1. Company Overview
- 12.1.4.2. Products
- 12.1.4.3. Company Financials
- 12.1.4.4. SWOT Analysis
- 12.1.5 Vedanta Resources Limited
- 12.1.5.1. Company Overview
- 12.1.5.2. Products
- 12.1.5.3. Company Financials
- 12.1.5.4. SWOT Analysis
- 12.1.6 PJSC Polyus
- 12.1.6.1. Company Overview
- 12.1.6.2. Products
- 12.1.6.3. Company Financials
- 12.1.6.4. SWOT Analysis
- 12.1.7 Gabriel Resources Ltd
- 12.1.7.1. Company Overview
- 12.1.7.2. Products
- 12.1.7.3. Company Financials
- 12.1.7.4. SWOT Analysis
- 12.1.8 Tertiary Minerals
- 12.1.8.1. Company Overview
- 12.1.8.2. Products
- 12.1.8.3. Company Financials
- 12.1.8.4. SWOT Analysis
- 12.1.9 FURUKAWA CO LTD
- 12.1.9.1. Company Overview
- 12.1.9.2. Products
- 12.1.9.3. Company Financials
- 12.1.9.4. SWOT Analysis
- 12.1.10 Johnson Matthey
- 12.1.10.1. Company Overview
- 12.1.10.2. Products
- 12.1.10.3. Company Financials
- 12.1.10.4. SWOT Analysis
- 12.1.11 Agnico Eagle Mines Limited
- 12.1.11.1. Company Overview
- 12.1.11.2. Products
- 12.1.11.3. Company Financials
- 12.1.11.4. SWOT Analysis
- 12.1.12 Zijin Mining Group*List Not Exhaustive
- 12.1.12.1. Company Overview
- 12.1.12.2. Products
- 12.1.12.3. Company Financials
- 12.1.12.4. SWOT Analysis
- 12.1.13 New Gold Inc
- 12.1.13.1. Company Overview
- 12.1.13.2. Products
- 12.1.13.3. Company Financials
- 12.1.13.4. SWOT Analysis
- 12.1.14 Harmony Gold Mining Company Limited
- 12.1.14.1. Company Overview
- 12.1.14.2. Products
- 12.1.14.3. Company Financials
- 12.1.14.4. SWOT Analysis
- 12.1.15 Newmont Corporation
- 12.1.15.1. Company Overview
- 12.1.15.2. Products
- 12.1.15.3. Company Financials
- 12.1.15.4. SWOT Analysis
- 12.1.1 Kinross Gold Corporation
- 12.2. Market Entropy
- 12.2.1 Company's Key Areas Served
- 12.2.2 Recent Developments
- 12.3. Company Market Share Analysis 2025
- 12.3.1 Top 5 Companies Market Share Analysis
- 12.3.2 Top 3 Companies Market Share Analysis
- 12.4. List of Potential Customers
- 13. Research Methodology
List of Figures
- Figure 1: Global Gold Market Revenue Breakdown (billion, %) by Region 2025 & 2033
- Figure 2: Global Gold Market Volume Breakdown (kilotons, %) by Region 2025 & 2033
- Figure 3: Asia Pacific Gold Market Revenue (billion), by Type 2025 & 2033
- Figure 4: Asia Pacific Gold Market Volume (kilotons), by Type 2025 & 2033
- Figure 5: Asia Pacific Gold Market Revenue Share (%), by Type 2025 & 2033
- Figure 6: Asia Pacific Gold Market Volume Share (%), by Type 2025 & 2033
- Figure 7: Asia Pacific Gold Market Revenue (billion), by Application 2025 & 2033
- Figure 8: Asia Pacific Gold Market Volume (kilotons), by Application 2025 & 2033
- Figure 9: Asia Pacific Gold Market Revenue Share (%), by Application 2025 & 2033
- Figure 10: Asia Pacific Gold Market Volume Share (%), by Application 2025 & 2033
- Figure 11: Asia Pacific Gold Market Revenue (billion), by Country 2025 & 2033
- Figure 12: Asia Pacific Gold Market Volume (kilotons), by Country 2025 & 2033
- Figure 13: Asia Pacific Gold Market Revenue Share (%), by Country 2025 & 2033
- Figure 14: Asia Pacific Gold Market Volume Share (%), by Country 2025 & 2033
- Figure 15: North America Gold Market Revenue (billion), by Type 2025 & 2033
- Figure 16: North America Gold Market Volume (kilotons), by Type 2025 & 2033
- Figure 17: North America Gold Market Revenue Share (%), by Type 2025 & 2033
- Figure 18: North America Gold Market Volume Share (%), by Type 2025 & 2033
- Figure 19: North America Gold Market Revenue (billion), by Application 2025 & 2033
- Figure 20: North America Gold Market Volume (kilotons), by Application 2025 & 2033
- Figure 21: North America Gold Market Revenue Share (%), by Application 2025 & 2033
- Figure 22: North America Gold Market Volume Share (%), by Application 2025 & 2033
- Figure 23: North America Gold Market Revenue (billion), by Country 2025 & 2033
- Figure 24: North America Gold Market Volume (kilotons), by Country 2025 & 2033
- Figure 25: North America Gold Market Revenue Share (%), by Country 2025 & 2033
- Figure 26: North America Gold Market Volume Share (%), by Country 2025 & 2033
- Figure 27: Europe Gold Market Revenue (billion), by Type 2025 & 2033
- Figure 28: Europe Gold Market Volume (kilotons), by Type 2025 & 2033
- Figure 29: Europe Gold Market Revenue Share (%), by Type 2025 & 2033
- Figure 30: Europe Gold Market Volume Share (%), by Type 2025 & 2033
- Figure 31: Europe Gold Market Revenue (billion), by Application 2025 & 2033
- Figure 32: Europe Gold Market Volume (kilotons), by Application 2025 & 2033
- Figure 33: Europe Gold Market Revenue Share (%), by Application 2025 & 2033
- Figure 34: Europe Gold Market Volume Share (%), by Application 2025 & 2033
- Figure 35: Europe Gold Market Revenue (billion), by Country 2025 & 2033
- Figure 36: Europe Gold Market Volume (kilotons), by Country 2025 & 2033
- Figure 37: Europe Gold Market Revenue Share (%), by Country 2025 & 2033
- Figure 38: Europe Gold Market Volume Share (%), by Country 2025 & 2033
- Figure 39: South America Gold Market Revenue (billion), by Type 2025 & 2033
- Figure 40: South America Gold Market Volume (kilotons), by Type 2025 & 2033
- Figure 41: South America Gold Market Revenue Share (%), by Type 2025 & 2033
- Figure 42: South America Gold Market Volume Share (%), by Type 2025 & 2033
- Figure 43: South America Gold Market Revenue (billion), by Application 2025 & 2033
- Figure 44: South America Gold Market Volume (kilotons), by Application 2025 & 2033
- Figure 45: South America Gold Market Revenue Share (%), by Application 2025 & 2033
- Figure 46: South America Gold Market Volume Share (%), by Application 2025 & 2033
- Figure 47: South America Gold Market Revenue (billion), by Country 2025 & 2033
- Figure 48: South America Gold Market Volume (kilotons), by Country 2025 & 2033
- Figure 49: South America Gold Market Revenue Share (%), by Country 2025 & 2033
- Figure 50: South America Gold Market Volume Share (%), by Country 2025 & 2033
- Figure 51: Middle East and Africa Gold Market Revenue (billion), by Type 2025 & 2033
- Figure 52: Middle East and Africa Gold Market Volume (kilotons), by Type 2025 & 2033
- Figure 53: Middle East and Africa Gold Market Revenue Share (%), by Type 2025 & 2033
- Figure 54: Middle East and Africa Gold Market Volume Share (%), by Type 2025 & 2033
- Figure 55: Middle East and Africa Gold Market Revenue (billion), by Application 2025 & 2033
- Figure 56: Middle East and Africa Gold Market Volume (kilotons), by Application 2025 & 2033
- Figure 57: Middle East and Africa Gold Market Revenue Share (%), by Application 2025 & 2033
- Figure 58: Middle East and Africa Gold Market Volume Share (%), by Application 2025 & 2033
- Figure 59: Middle East and Africa Gold Market Revenue (billion), by Country 2025 & 2033
- Figure 60: Middle East and Africa Gold Market Volume (kilotons), by Country 2025 & 2033
- Figure 61: Middle East and Africa Gold Market Revenue Share (%), by Country 2025 & 2033
- Figure 62: Middle East and Africa Gold Market Volume Share (%), by Country 2025 & 2033
List of Tables
- Table 1: Global Gold Market Revenue billion Forecast, by Type 2020 & 2033
- Table 2: Global Gold Market Volume kilotons Forecast, by Type 2020 & 2033
- Table 3: Global Gold Market Revenue billion Forecast, by Application 2020 & 2033
- Table 4: Global Gold Market Volume kilotons Forecast, by Application 2020 & 2033
- Table 5: Global Gold Market Revenue billion Forecast, by Region 2020 & 2033
- Table 6: Global Gold Market Volume kilotons Forecast, by Region 2020 & 2033
- Table 7: Global Gold Market Revenue billion Forecast, by Type 2020 & 2033
- Table 8: Global Gold Market Volume kilotons Forecast, by Type 2020 & 2033
- Table 9: Global Gold Market Revenue billion Forecast, by Application 2020 & 2033
- Table 10: Global Gold Market Volume kilotons Forecast, by Application 2020 & 2033
- Table 11: Global Gold Market Revenue billion Forecast, by Country 2020 & 2033
- Table 12: Global Gold Market Volume kilotons Forecast, by Country 2020 & 2033
- Table 13: China Gold Market Revenue (billion) Forecast, by Application 2020 & 2033
- Table 14: China Gold Market Volume (kilotons) Forecast, by Application 2020 & 2033
- Table 15: India Gold Market Revenue (billion) Forecast, by Application 2020 & 2033
- Table 16: India Gold Market Volume (kilotons) Forecast, by Application 2020 & 2033
- Table 17: Japan Gold Market Revenue (billion) Forecast, by Application 2020 & 2033
- Table 18: Japan Gold Market Volume (kilotons) Forecast, by Application 2020 & 2033
- Table 19: South Korea Gold Market Revenue (billion) Forecast, by Application 2020 & 2033
- Table 20: South Korea Gold Market Volume (kilotons) Forecast, by Application 2020 & 2033
- Table 21: Rest of Asia Pacific Gold Market Revenue (billion) Forecast, by Application 2020 & 2033
- Table 22: Rest of Asia Pacific Gold Market Volume (kilotons) Forecast, by Application 2020 & 2033
- Table 23: Global Gold Market Revenue billion Forecast, by Type 2020 & 2033
- Table 24: Global Gold Market Volume kilotons Forecast, by Type 2020 & 2033
- Table 25: Global Gold Market Revenue billion Forecast, by Application 2020 & 2033
- Table 26: Global Gold Market Volume kilotons Forecast, by Application 2020 & 2033
- Table 27: Global Gold Market Revenue billion Forecast, by Country 2020 & 2033
- Table 28: Global Gold Market Volume kilotons Forecast, by Country 2020 & 2033
- Table 29: United States Gold Market Revenue (billion) Forecast, by Application 2020 & 2033
- Table 30: United States Gold Market Volume (kilotons) Forecast, by Application 2020 & 2033
- Table 31: Canada Gold Market Revenue (billion) Forecast, by Application 2020 & 2033
- Table 32: Canada Gold Market Volume (kilotons) Forecast, by Application 2020 & 2033
- Table 33: Mexico Gold Market Revenue (billion) Forecast, by Application 2020 & 2033
- Table 34: Mexico Gold Market Volume (kilotons) Forecast, by Application 2020 & 2033
- Table 35: Global Gold Market Revenue billion Forecast, by Type 2020 & 2033
- Table 36: Global Gold Market Volume kilotons Forecast, by Type 2020 & 2033
- Table 37: Global Gold Market Revenue billion Forecast, by Application 2020 & 2033
- Table 38: Global Gold Market Volume kilotons Forecast, by Application 2020 & 2033
- Table 39: Global Gold Market Revenue billion Forecast, by Country 2020 & 2033
- Table 40: Global Gold Market Volume kilotons Forecast, by Country 2020 & 2033
- Table 41: Germany Gold Market Revenue (billion) Forecast, by Application 2020 & 2033
- Table 42: Germany Gold Market Volume (kilotons) Forecast, by Application 2020 & 2033
- Table 43: United Kingdom Gold Market Revenue (billion) Forecast, by Application 2020 & 2033
- Table 44: United Kingdom Gold Market Volume (kilotons) Forecast, by Application 2020 & 2033
- Table 45: Italy Gold Market Revenue (billion) Forecast, by Application 2020 & 2033
- Table 46: Italy Gold Market Volume (kilotons) Forecast, by Application 2020 & 2033
- Table 47: France Gold Market Revenue (billion) Forecast, by Application 2020 & 2033
- Table 48: France Gold Market Volume (kilotons) Forecast, by Application 2020 & 2033
- Table 49: Rest of Europe Gold Market Revenue (billion) Forecast, by Application 2020 & 2033
- Table 50: Rest of Europe Gold Market Volume (kilotons) Forecast, by Application 2020 & 2033
- Table 51: Global Gold Market Revenue billion Forecast, by Type 2020 & 2033
- Table 52: Global Gold Market Volume kilotons Forecast, by Type 2020 & 2033
- Table 53: Global Gold Market Revenue billion Forecast, by Application 2020 & 2033
- Table 54: Global Gold Market Volume kilotons Forecast, by Application 2020 & 2033
- Table 55: Global Gold Market Revenue billion Forecast, by Country 2020 & 2033
- Table 56: Global Gold Market Volume kilotons Forecast, by Country 2020 & 2033
- Table 57: Brazil Gold Market Revenue (billion) Forecast, by Application 2020 & 2033
- Table 58: Brazil Gold Market Volume (kilotons) Forecast, by Application 2020 & 2033
- Table 59: Argentina Gold Market Revenue (billion) Forecast, by Application 2020 & 2033
- Table 60: Argentina Gold Market Volume (kilotons) Forecast, by Application 2020 & 2033
- Table 61: Rest of South America Gold Market Revenue (billion) Forecast, by Application 2020 & 2033
- Table 62: Rest of South America Gold Market Volume (kilotons) Forecast, by Application 2020 & 2033
- Table 63: Global Gold Market Revenue billion Forecast, by Type 2020 & 2033
- Table 64: Global Gold Market Volume kilotons Forecast, by Type 2020 & 2033
- Table 65: Global Gold Market Revenue billion Forecast, by Application 2020 & 2033
- Table 66: Global Gold Market Volume kilotons Forecast, by Application 2020 & 2033
- Table 67: Global Gold Market Revenue billion Forecast, by Country 2020 & 2033
- Table 68: Global Gold Market Volume kilotons Forecast, by Country 2020 & 2033
- Table 69: Saudi Arabia Gold Market Revenue (billion) Forecast, by Application 2020 & 2033
- Table 70: Saudi Arabia Gold Market Volume (kilotons) Forecast, by Application 2020 & 2033
- Table 71: South Africa Gold Market Revenue (billion) Forecast, by Application 2020 & 2033
- Table 72: South Africa Gold Market Volume (kilotons) Forecast, by Application 2020 & 2033
- Table 73: Rest of Middle East and Africa Gold Market Revenue (billion) Forecast, by Application 2020 & 2033
- Table 74: Rest of Middle East and Africa Gold Market Volume (kilotons) Forecast, by Application 2020 & 2033
Frequently Asked Questions
1. What is the projected Compound Annual Growth Rate (CAGR) of the Gold Market?
The projected CAGR is approximately 7.38%.
2. Which companies are prominent players in the Gold Market?
Key companies in the market include Kinross Gold Corporation, Jinshan Gold, FRANCO-NEVADA CORPORATION, Barrick Gold Corporation, Vedanta Resources Limited, PJSC Polyus, Gabriel Resources Ltd, Tertiary Minerals, FURUKAWA CO LTD, Johnson Matthey, Agnico Eagle Mines Limited, Zijin Mining Group*List Not Exhaustive, New Gold Inc, Harmony Gold Mining Company Limited, Newmont Corporation.
3. What are the main segments of the Gold Market?
The market segments include Type, Application.
4. Can you provide details about the market size?
The market size is estimated to be USD 4000 billion as of 2022.
5. What are some drivers contributing to market growth?
Demand for Gold in the form of Jewelry and Long-term Savings; Increasing Consumption in High-End Electronics Applications; Other Drivers.
6. What are the notable trends driving market growth?
Jewelry Segment to Dominate the Demand.
7. Are there any restraints impacting market growth?
Declining Ore Grades and Other Technical Challenges; Other Restraints.
8. Can you provide examples of recent developments in the market?
March 2023: Pan American Silver Corporation acquired all the issued and outstanding common shares of Yamana Gold Inc., as part of the arrangement, which includes its mines and increased the geographical operations of the company in Latin America.
9. What pricing options are available for accessing the report?
Pricing options include single-user, multi-user, and enterprise licenses priced at USD 4750, USD 5250, and USD 8750 respectively.
10. Is the market size provided in terms of value or volume?
The market size is provided in terms of value, measured in billion and volume, measured in kilotons.
11. Are there any specific market keywords associated with the report?
Yes, the market keyword associated with the report is "Gold Market," which aids in identifying and referencing the specific market segment covered.
12. How do I determine which pricing option suits my needs best?
The pricing options vary based on user requirements and access needs. Individual users may opt for single-user licenses, while businesses requiring broader access may choose multi-user or enterprise licenses for cost-effective access to the report.
13. Are there any additional resources or data provided in the Gold Market report?
While the report offers comprehensive insights, it's advisable to review the specific contents or supplementary materials provided to ascertain if additional resources or data are available.
14. How can I stay updated on further developments or reports in the Gold Market?
To stay informed about further developments, trends, and reports in the Gold Market, consider subscribing to industry newsletters, following relevant companies and organizations, or regularly checking reputable industry news sources and publications.
Methodology
Step 1 - Identification of Relevant Samples Size from Population Database


Step 2 - Approaches for Defining Global Market Size (Value, Volume* & Price*)

Note*: In applicable scenarios
Step 3 - Data Sources
Primary Research
- Web Analytics
- Survey Reports
- Research Institute
- Latest Research Reports
- Opinion Leaders
Secondary Research
- Annual Reports
- White Paper
- Latest Press Release
- Industry Association
- Paid Database
- Investor Presentations

Step 4 - Data Triangulation
Involves using different sources of information in order to increase the validity of a study
These sources are likely to be stakeholders in a program - participants, other researchers, program staff, other community members, and so on.
Then we put all data in single framework & apply various statistical tools to find out the dynamic on the market.
During the analysis stage, feedback from the stakeholder groups would be compared to determine areas of agreement as well as areas of divergence