Key Insights
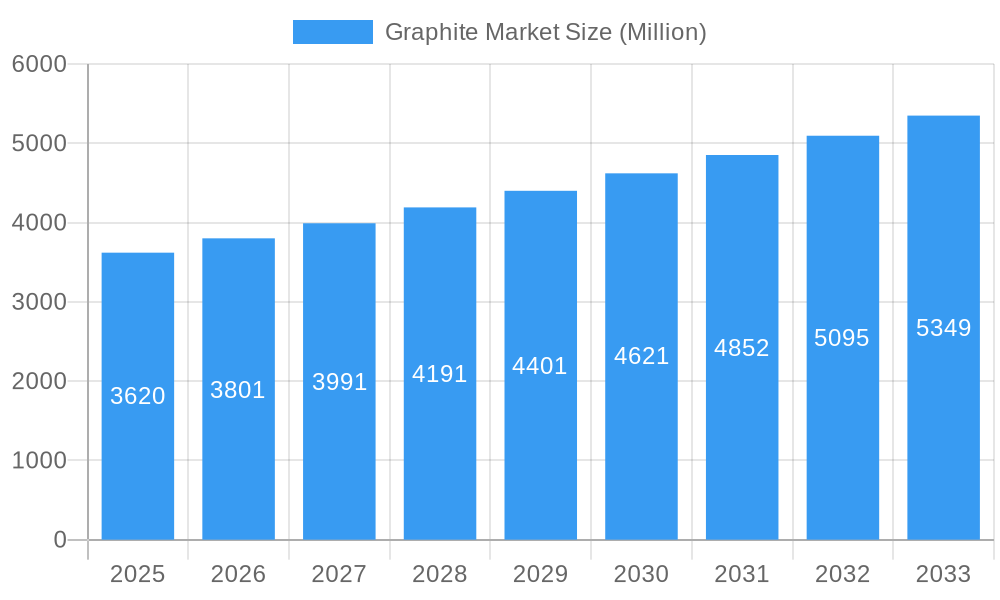
The global graphite market is poised for significant expansion, projected to reach $31.59 billion by 2025, exhibiting a Compound Annual Growth Rate (CAGR) of 8.42%. This growth is fueled by the escalating demand for advanced materials across key industries. Major drivers include the burgeoning electric vehicle (EV) and hybrid electric vehicle (HEV) sectors, necessitating substantial graphite for battery anodes, and the continued requirement for high-performance refractories and electrodes in metallurgy and steel production. Innovations in synthetic graphite production are enhancing market dynamism by offering tailored properties for specialized applications. The expansion of renewable energy infrastructure, dependent on advanced energy storage, will further accelerate graphite consumption.
Graphite Market Market Size (In Billion)
The market is bifurcated into natural and synthetic graphite, with applications including electrodes, refractories, casting, foundries, lubricants, and a rapidly growing battery segment. The electronics and automotive industries, especially EVs and HEVs, are the primary end-users, highlighting graphite's crucial role in technological progress. Geographically, the Asia Pacific region, led by China, is expected to maintain market dominance due to its robust manufacturing base and rapid adoption of electric mobility. Potential market restraints include natural graphite price volatility, stringent environmental regulations for mining, and significant capital investment for advanced synthetic graphite facilities. Nevertheless, the global push towards decarbonization and electrification is anticipated to overcome these challenges, ensuring a favorable market outlook.
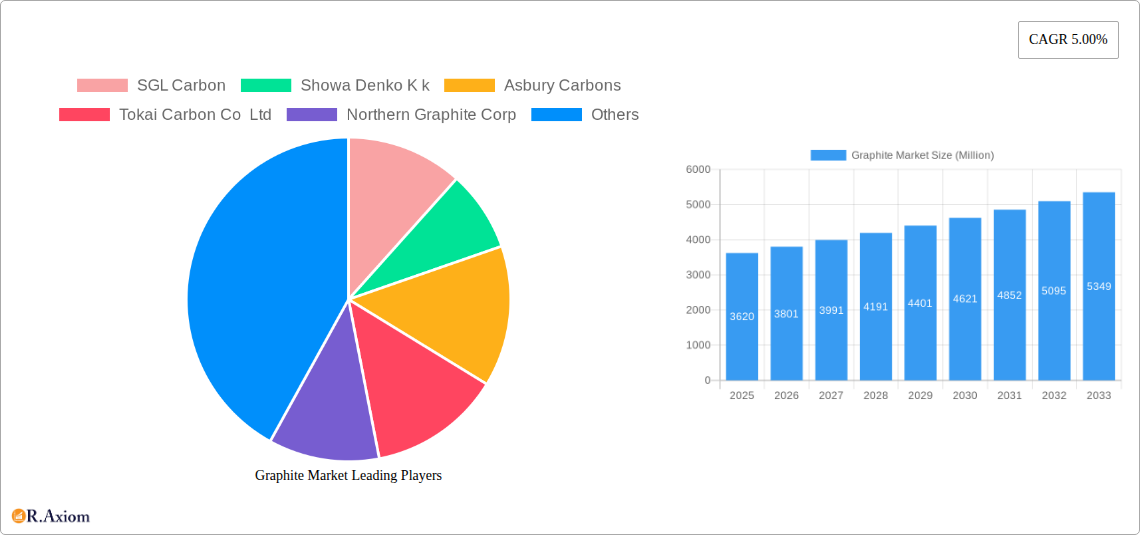
Graphite Market Company Market Share
Graphite Market Report: Comprehensive Analysis & Forecast (2019–2033)
This in-depth report provides an exhaustive analysis of the global graphite market, covering historical trends, current dynamics, and future projections. With a study period spanning from 2019 to 2033 and a base year of 2025, this report delves into market segmentation by type (Natural Graphite, Synthetic Graphite), application (Electrodes, Refractories, Casting and Foundries, Batteries, Lubricants, Other Applications), and end-user industry (Electronics, Metallurgy, Automotive (Includes EV/HEV Vehicles), Other End-user Industries). Gain critical insights into the lithium-ion battery anode material market, synthetic graphite applications, natural graphite demand, and the burgeoning EV battery market. Understand the impact of technological advancements and regulatory landscapes on key players like SGL Carbon, Showa Denko K k, Asbury Carbons, Tokai Carbon Co Ltd, Northern Graphite Corp, Mason Graphite Inc, Triton Minerals, BTR New Material Group Co Ltd, Jiangxi Zichen Technology Co Ltd, Imerys, Shanghai Shanshan Technology Co Ltd, Syrah Resources Limited, Shenzhen Xiangfenghua Technology Co Ltd, and Nippon Kokuen Group.
Graphite Market Market Concentration & Innovation
The graphite market exhibits a moderate level of concentration, with a few dominant players holding significant market share in both natural and synthetic graphite production. SGL Carbon and Showa Denko K k are leading entities, particularly in the synthetic graphite segment crucial for battery applications. Innovation is a key driver, fueled by the escalating demand for high-performance graphite in lithium-ion batteries for electric vehicles (EVs) and hybrid electric vehicles (HEVs). Breakthroughs in anode material technology, including advanced processing techniques for natural graphite and the development of novel synthetic graphite structures, are enhancing battery energy density and charging speeds. Regulatory frameworks, particularly those related to environmental standards for mining and processing, influence operational costs and investment decisions. Product substitutes, such as silicon-based anodes, are emerging but currently face challenges in terms of cost and scalability for mass adoption. End-user trends overwhelmingly favor sustainable and efficient energy storage solutions, propelling demand for graphite. Mergers and acquisitions (M&A) are observed as companies seek to secure supply chains, expand production capacity, and acquire advanced technologies. For instance, strategic partnerships and acquisitions aimed at securing raw material sources for natural graphite or enhancing synthetic graphite production capabilities are becoming more prevalent. The M&A deal values are expected to escalate as the importance of graphite in the energy transition becomes more pronounced, potentially reaching several hundred million dollars for significant acquisitions.
Graphite Market Industry Trends & Insights
The global graphite market is experiencing robust growth, driven by an unprecedented surge in demand from the battery sector, primarily for electric vehicles and energy storage systems. The projected Compound Annual Growth Rate (CAGR) for the forecast period 2025–2033 is expected to be in the high single digits, reflecting the transformative impact of the clean energy transition. Technological disruptions are at the forefront, with continuous advancements in graphite processing techniques aimed at improving purity, particle size distribution, and electrical conductivity. These innovations are critical for enhancing the performance of lithium-ion battery anodes, leading to increased energy density, faster charging times, and extended battery life. The development of anode materials with higher specific capacity and improved cyclability is a key focus for researchers and manufacturers. Consumer preferences are increasingly leaning towards sustainable and high-performance energy solutions. This shift is directly translating into a higher demand for EVs and, consequently, for the graphite required to manufacture their batteries. The "green" credentials of products are also becoming a significant factor, influencing sourcing and production methods for graphite. Competitive dynamics are characterized by intense rivalry among established players and emerging entrants, particularly from regions with significant natural graphite reserves or advanced synthetic graphite production capabilities. Market penetration of high-purity graphite in specialized applications within the electronics and aerospace industries is also steadily increasing. The strategic importance of securing a stable and ethically sourced supply of graphite is driving vertical integration and long-term supply agreements. Furthermore, the exploration and development of new graphite deposits, alongside improvements in extraction and purification technologies, are crucial for meeting the projected demand, which is anticipated to reach over 200 million metric tons by 2033. The market penetration of synthetic graphite in high-tech applications is also poised for significant expansion, offering a controlled and customizable alternative to natural graphite.
Dominant Markets & Segments in Graphite Market
The dominance within the graphite market is a multi-faceted landscape influenced by regional advantages, application-specific demand, and end-user industry growth.
Dominant Regions and Countries:
- Asia Pacific: This region is the undisputed leader, driven by its massive manufacturing base for electronics, batteries, and automotive components. China, in particular, is a powerhouse in both the production of natural graphite and the manufacturing of synthetic graphite, holding a substantial share of the global market. Economic policies promoting domestic manufacturing and substantial investments in battery gigafactories have solidified its position. South Korea and Japan are also significant contributors, particularly in the high-purity synthetic graphite segment for advanced battery technologies.
Dominant Segments:
Type: Synthetic Graphite: While natural graphite remains crucial, synthetic graphite is witnessing explosive growth due to its superior performance characteristics in high-end applications like lithium-ion battery anodes. Its controlled properties, such as higher purity and specific electrical conductivity, make it indispensable for next-generation batteries. The projected market size for synthetic graphite is estimated to exceed 100 million metric tons by 2033.
Application: Batteries: This segment is the primary growth engine for the graphite market. The exponential rise in demand for electric vehicles (EVs) and the expansion of grid-scale energy storage solutions are directly fueling the need for graphite as a key anode material. The market size for graphite in batteries is projected to reach over 70 million metric tons by 2033, with significant investments in production capacity to meet this demand.
End-user Industry: Automotive (Includes EV/HEV Vehicles): The automotive sector, specifically the EV and HEV sub-segment, is the most significant driver of graphite demand. The widespread adoption of electric mobility globally has created an insatiable appetite for graphite-based battery components. Government incentives, stricter emission regulations, and increasing consumer awareness about environmental sustainability are propelling the growth of this end-user industry, with its contribution to the graphite market expected to surpass 60% by 2033.
Key Drivers for Dominance:
- Technological Advancements: Innovations in battery chemistry and manufacturing processes that enhance the performance and cost-effectiveness of graphite anodes are critical.
- Government Policies and Incentives: Favorable policies promoting EVs, renewable energy storage, and domestic manufacturing of critical minerals are shaping regional dominance.
- Infrastructure Development: The expansion of EV charging infrastructure and renewable energy storage facilities directly correlates with graphite demand.
- Raw Material Availability and Cost: Access to high-quality natural graphite reserves and cost-effective synthetic graphite production methods play a crucial role in market leadership.
Graphite Market Product Developments
Product development in the graphite market is heavily skewed towards enhancing performance for battery applications. Innovations focus on producing higher-purity natural graphite and advanced synthetic graphite with tailored microstructures for improved lithium-ion intercalation. This includes developing spherical natural graphite (SNG) and engineered synthetic graphite with controlled porosity and surface area. These developments offer significant competitive advantages by enabling longer battery life, faster charging capabilities, and higher energy density in EVs and portable electronics. The market fit for these advanced materials is exceptionally strong, driven by the urgent need for improved energy storage solutions across multiple industries.
Graphite Market Report Scope & Segmentation Analysis
The report provides a comprehensive segmentation of the graphite market. The Natural Graphite segment encompasses flake graphite, amorphous graphite, and crystalline graphite, catering to applications like refractories and lubricants. The Synthetic Graphite segment includes needle coke-based graphite and petrochemical coke-based graphite, crucial for electrodes and battery anodes. In terms of applications, Electrodes for steel production, Refractories for high-temperature industrial processes, Casting and Foundries for metal casting, and Batteries for energy storage are key segments. The Lubricants segment serves industrial and automotive needs, while Other Applications include composites and coatings. The Electronics end-user industry utilizes graphite for thermal management and conductive materials. The Metallurgy sector relies on graphite for various high-temperature processes. The Automotive (Includes EV/HEV Vehicles) segment is the fastest-growing, driven by battery demand. Other End-user Industries include aerospace and medical devices. Growth projections for each segment indicate significant expansion, with the Batteries segment expected to lead the market by a considerable margin.
Key Drivers of Graphite Market Growth
The graphite market is propelled by a confluence of potent growth drivers. The most significant is the electrification of transportation, with the booming EV and HEV market creating an insatiable demand for graphite-based anode materials. This is intrinsically linked to the global push for renewable energy storage solutions, where graphite plays a pivotal role in battery technology for grid stabilization and decentralized power. Technological advancements in battery chemistry, leading to higher energy density and faster charging capabilities, directly translate to increased graphite demand. Furthermore, the growing adoption of graphite in advanced applications within the electronics and semiconductor industries, such as thermal management and conductive materials, contributes to steady growth. Favorable government policies and subsidies promoting green energy technologies and domestic battery production further accelerate market expansion.
Challenges in the Graphite Market Sector
Despite robust growth, the graphite market faces significant challenges. Supply chain volatility remains a primary concern, with the concentration of natural graphite mining in a few regions creating geopolitical risks and price fluctuations. Environmental regulations pertaining to mining and processing, particularly for natural graphite, can lead to increased operational costs and production disruptions. The development and scaling of alternative anode materials, such as silicon-based anodes, pose a long-term competitive threat, although current cost and performance hurdles limit their widespread adoption. Price volatility of raw materials, especially for synthetic graphite production, can impact profitability margins. Furthermore, ensuring the ethical sourcing and sustainability of graphite is becoming increasingly important for consumers and regulatory bodies, adding complexity to production processes.
Emerging Opportunities in Graphite Market
Emerging opportunities in the graphite market are abundant and diverse. The continued exponential growth of the EV and energy storage sectors presents the most significant opportunity, demanding higher volumes of both natural and synthetic graphite. Advancements in solid-state battery technology could potentially create new demand for specialized graphite materials or different anode compositions, presenting an area for future innovation. The development of recycled graphite from spent batteries offers a sustainable and potentially cost-effective alternative supply source. The application of graphite in next-generation computing and advanced materials, such as graphene-based composites and thermal management solutions for high-performance electronics, opens up niche but high-value markets. Furthermore, the increasing focus on diversifying graphite supply chains beyond current dominant regions creates opportunities for new exploration and production ventures.
Leading Players in the Graphite Market Market
SGL Carbon Showa Denko K k Asbury Carbons Tokai Carbon Co Ltd Northern Graphite Corp Mason Graphite Inc Triton Minerals BTR New Material Group Co Ltd Jiangxi Zichen Technology Co Ltd Imerys Shanghai Shanshan Technology Co Ltd Syrah Resources Limited Shenzhen Xiangfenghua Technology Co Ltd Nippon Kokuen Group
Key Developments in Graphite Market Industry
- October 2022: Syrah Resources Ltd. announced it would supply a key lithium-ion battery component to South Korea's LG Energy Solution Ltd. According to the agreement, the company was to provide 2 kilotons per annum of graphite to LG Energy Solution Ltd. active anode material (AAM) from 2025 and increase it to at least 10 ktpa after its production capacity at its Vidalia facility in Louisiana. This development significantly bolsters Syrah's market position in the burgeoning battery materials sector.
- October 2022: Imerys Graphite & Carbon announced the launch of a landmark lithium exploitation project (“the EMILI Project'') at its Beauvoir site (Allier département of France). The project intended to expand Imerys' position as a market leader and expert in Li-ion battery components and complete its product line, which includes synthetic graphite and carbon black, at its production facilities in Willebroek (Belgium) and Bodio (Switzerland). This strategic move by Imerys highlights its commitment to expanding its footprint in the critical battery materials supply chain.
Strategic Outlook for Graphite Market Market
The strategic outlook for the graphite market is exceptionally positive, driven by the indispensable role of graphite in the global transition towards sustainable energy and electric mobility. Continued innovation in battery anode materials will remain a key growth catalyst, with a focus on improving energy density, charging speeds, and battery longevity. Investments in expanding production capacity for both natural and synthetic graphite will be crucial to meet projected demand. Diversification of supply chains and the development of advanced recycling technologies for graphite will be essential for ensuring market stability and sustainability. Companies that can effectively navigate regulatory landscapes, secure raw material access, and innovate in high-performance graphite solutions are poised for significant growth and market leadership in the coming decade, with the market value expected to exceed $60 Billion by 2033.
Graphite Market Segmentation
-
1. Type
- 1.1. Natural Graphite
- 1.2. Synthetic Graphite
-
2. Application
- 2.1. Electrodes
- 2.2. Refractories, Casting, and Foundries
- 2.3. Batteries
- 2.4. Lubricants
- 2.5. Other Applications
-
3. End-user Industry
- 3.1. Electronics
- 3.2. Metallurgy
- 3.3. Automotive (Includes EV/HEV Vehicles)
- 3.4. Other End-user Industries
Graphite Market Segmentation By Geography
-
1. Asia Pacific
- 1.1. China
- 1.2. India
- 1.3. Japan
- 1.4. South Korea
- 1.5. Rest of Asia Pacific
-
2. North America
- 2.1. United States
- 2.2. Canada
- 2.3. Mexico
-
3. Europe
- 3.1. Germany
- 3.2. United Kingdom
- 3.3. Italy
- 3.4. France
- 3.5. Russia
- 3.6. Rest of Europe
-
4. South America
- 4.1. Brazil
- 4.2. Argentina
- 4.3. Rest of South America
-
5. Middle East and Africa
- 5.1. Saudi Arabia
- 5.2. South Africa
- 5.3. Rest of Middle East and Africa
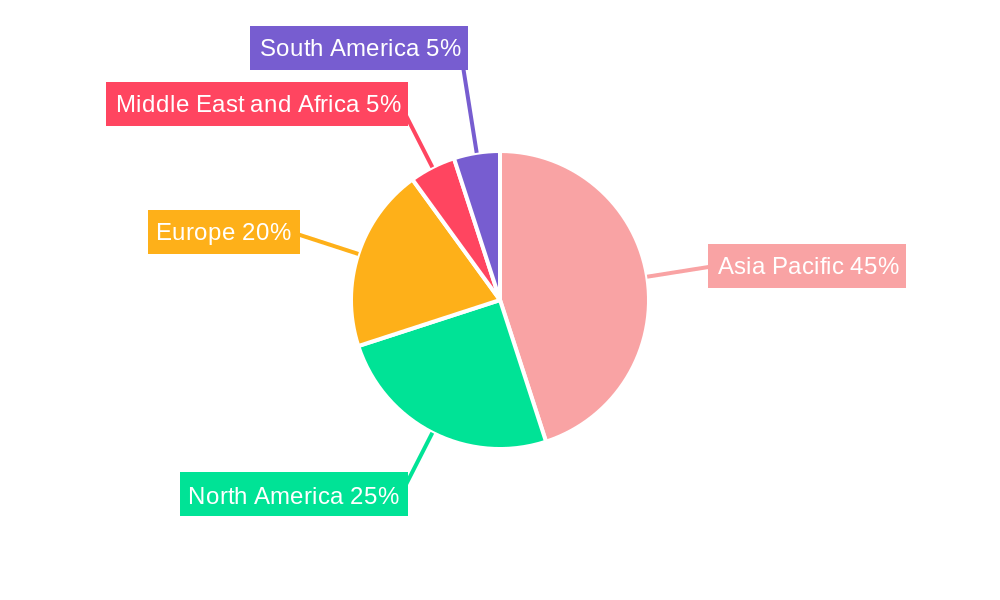
Graphite Market Regional Market Share
Geographic Coverage of Graphite Market
Graphite Market REPORT HIGHLIGHTS
| Aspects | Details |
|---|---|
| Study Period | 2020-2034 |
| Base Year | 2025 |
| Estimated Year | 2026 |
| Forecast Period | 2026-2034 |
| Historical Period | 2020-2025 |
| Growth Rate | CAGR of 8.42% from 2020-2034 |
| Segmentation |
|
Table of Contents
- 1. Introduction
- 1.1. Research Scope
- 1.2. Market Segmentation
- 1.3. Research Objective
- 1.4. Definitions and Assumptions
- 2. Executive Summary
- 2.1. Market Snapshot
- 3. Market Dynamics
- 3.1. Market Drivers
- 3.2. Market Restrains
- 3.3. Market Trends
- 3.4. Market Opportunities
- 4. Market Factor Analysis
- 4.1. Porters Five Forces
- 4.1.1. Bargaining Power of Suppliers
- 4.1.2. Bargaining Power of Buyers
- 4.1.3. Threat of New Entrants
- 4.1.4. Threat of Substitutes
- 4.1.5. Competitive Rivalry
- 4.2. PESTEL analysis
- 4.3. BCG Analysis
- 4.3.1. Stars (High Growth, High Market Share)
- 4.3.2. Cash Cows (Low Growth, High Market Share)
- 4.3.3. Question Mark (High Growth, Low Market Share)
- 4.3.4. Dogs (Low Growth, Low Market Share)
- 4.4. Ansoff Matrix Analysis
- 4.5. Supply Chain Analysis
- 4.6. Regulatory Landscape
- 4.7. Current Market Potential and Opportunity Assessment (TAM–SAM–SOM Framework)
- 4.8. RAX Analyst Note
- 4.1. Porters Five Forces
- 5. Market Analysis, Insights and Forecast 2021-2033
- 5.1. Market Analysis, Insights and Forecast - by Type
- 5.1.1. Natural Graphite
- 5.1.2. Synthetic Graphite
- 5.2. Market Analysis, Insights and Forecast - by Application
- 5.2.1. Electrodes
- 5.2.2. Refractories, Casting, and Foundries
- 5.2.3. Batteries
- 5.2.4. Lubricants
- 5.2.5. Other Applications
- 5.3. Market Analysis, Insights and Forecast - by End-user Industry
- 5.3.1. Electronics
- 5.3.2. Metallurgy
- 5.3.3. Automotive (Includes EV/HEV Vehicles)
- 5.3.4. Other End-user Industries
- 5.4. Market Analysis, Insights and Forecast - by Region
- 5.4.1. Asia Pacific
- 5.4.2. North America
- 5.4.3. Europe
- 5.4.4. South America
- 5.4.5. Middle East and Africa
- 5.1. Market Analysis, Insights and Forecast - by Type
- 6. Global Graphite Market Analysis, Insights and Forecast, 2021-2033
- 6.1. Market Analysis, Insights and Forecast - by Type
- 6.1.1. Natural Graphite
- 6.1.2. Synthetic Graphite
- 6.2. Market Analysis, Insights and Forecast - by Application
- 6.2.1. Electrodes
- 6.2.2. Refractories, Casting, and Foundries
- 6.2.3. Batteries
- 6.2.4. Lubricants
- 6.2.5. Other Applications
- 6.3. Market Analysis, Insights and Forecast - by End-user Industry
- 6.3.1. Electronics
- 6.3.2. Metallurgy
- 6.3.3. Automotive (Includes EV/HEV Vehicles)
- 6.3.4. Other End-user Industries
- 6.1. Market Analysis, Insights and Forecast - by Type
- 7. Asia Pacific Graphite Market Analysis, Insights and Forecast, 2020-2032
- 7.1. Market Analysis, Insights and Forecast - by Type
- 7.1.1. Natural Graphite
- 7.1.2. Synthetic Graphite
- 7.2. Market Analysis, Insights and Forecast - by Application
- 7.2.1. Electrodes
- 7.2.2. Refractories, Casting, and Foundries
- 7.2.3. Batteries
- 7.2.4. Lubricants
- 7.2.5. Other Applications
- 7.3. Market Analysis, Insights and Forecast - by End-user Industry
- 7.3.1. Electronics
- 7.3.2. Metallurgy
- 7.3.3. Automotive (Includes EV/HEV Vehicles)
- 7.3.4. Other End-user Industries
- 7.1. Market Analysis, Insights and Forecast - by Type
- 8. North America Graphite Market Analysis, Insights and Forecast, 2020-2032
- 8.1. Market Analysis, Insights and Forecast - by Type
- 8.1.1. Natural Graphite
- 8.1.2. Synthetic Graphite
- 8.2. Market Analysis, Insights and Forecast - by Application
- 8.2.1. Electrodes
- 8.2.2. Refractories, Casting, and Foundries
- 8.2.3. Batteries
- 8.2.4. Lubricants
- 8.2.5. Other Applications
- 8.3. Market Analysis, Insights and Forecast - by End-user Industry
- 8.3.1. Electronics
- 8.3.2. Metallurgy
- 8.3.3. Automotive (Includes EV/HEV Vehicles)
- 8.3.4. Other End-user Industries
- 8.1. Market Analysis, Insights and Forecast - by Type
- 9. Europe Graphite Market Analysis, Insights and Forecast, 2020-2032
- 9.1. Market Analysis, Insights and Forecast - by Type
- 9.1.1. Natural Graphite
- 9.1.2. Synthetic Graphite
- 9.2. Market Analysis, Insights and Forecast - by Application
- 9.2.1. Electrodes
- 9.2.2. Refractories, Casting, and Foundries
- 9.2.3. Batteries
- 9.2.4. Lubricants
- 9.2.5. Other Applications
- 9.3. Market Analysis, Insights and Forecast - by End-user Industry
- 9.3.1. Electronics
- 9.3.2. Metallurgy
- 9.3.3. Automotive (Includes EV/HEV Vehicles)
- 9.3.4. Other End-user Industries
- 9.1. Market Analysis, Insights and Forecast - by Type
- 10. South America Graphite Market Analysis, Insights and Forecast, 2020-2032
- 10.1. Market Analysis, Insights and Forecast - by Type
- 10.1.1. Natural Graphite
- 10.1.2. Synthetic Graphite
- 10.2. Market Analysis, Insights and Forecast - by Application
- 10.2.1. Electrodes
- 10.2.2. Refractories, Casting, and Foundries
- 10.2.3. Batteries
- 10.2.4. Lubricants
- 10.2.5. Other Applications
- 10.3. Market Analysis, Insights and Forecast - by End-user Industry
- 10.3.1. Electronics
- 10.3.2. Metallurgy
- 10.3.3. Automotive (Includes EV/HEV Vehicles)
- 10.3.4. Other End-user Industries
- 10.1. Market Analysis, Insights and Forecast - by Type
- 11. Middle East and Africa Graphite Market Analysis, Insights and Forecast, 2020-2032
- 11.1. Market Analysis, Insights and Forecast - by Type
- 11.1.1. Natural Graphite
- 11.1.2. Synthetic Graphite
- 11.2. Market Analysis, Insights and Forecast - by Application
- 11.2.1. Electrodes
- 11.2.2. Refractories, Casting, and Foundries
- 11.2.3. Batteries
- 11.2.4. Lubricants
- 11.2.5. Other Applications
- 11.3. Market Analysis, Insights and Forecast - by End-user Industry
- 11.3.1. Electronics
- 11.3.2. Metallurgy
- 11.3.3. Automotive (Includes EV/HEV Vehicles)
- 11.3.4. Other End-user Industries
- 11.1. Market Analysis, Insights and Forecast - by Type
- 12. Competitive Analysis
- 12.1. Company Profiles
- 12.1.1 SGL Carbon
- 12.1.1.1. Company Overview
- 12.1.1.2. Products
- 12.1.1.3. Company Financials
- 12.1.1.4. SWOT Analysis
- 12.1.2 Showa Denko K k
- 12.1.2.1. Company Overview
- 12.1.2.2. Products
- 12.1.2.3. Company Financials
- 12.1.2.4. SWOT Analysis
- 12.1.3 Asbury Carbons
- 12.1.3.1. Company Overview
- 12.1.3.2. Products
- 12.1.3.3. Company Financials
- 12.1.3.4. SWOT Analysis
- 12.1.4 Tokai Carbon Co Ltd
- 12.1.4.1. Company Overview
- 12.1.4.2. Products
- 12.1.4.3. Company Financials
- 12.1.4.4. SWOT Analysis
- 12.1.5 Northern Graphite Corp
- 12.1.5.1. Company Overview
- 12.1.5.2. Products
- 12.1.5.3. Company Financials
- 12.1.5.4. SWOT Analysis
- 12.1.6 Mason Graphite Inc
- 12.1.6.1. Company Overview
- 12.1.6.2. Products
- 12.1.6.3. Company Financials
- 12.1.6.4. SWOT Analysis
- 12.1.7 Triton Minerals
- 12.1.7.1. Company Overview
- 12.1.7.2. Products
- 12.1.7.3. Company Financials
- 12.1.7.4. SWOT Analysis
- 12.1.8 BTR New Material Group Co Ltd
- 12.1.8.1. Company Overview
- 12.1.8.2. Products
- 12.1.8.3. Company Financials
- 12.1.8.4. SWOT Analysis
- 12.1.9 Jiangxi Zichen Technology Co Ltd
- 12.1.9.1. Company Overview
- 12.1.9.2. Products
- 12.1.9.3. Company Financials
- 12.1.9.4. SWOT Analysis
- 12.1.10 Imerys
- 12.1.10.1. Company Overview
- 12.1.10.2. Products
- 12.1.10.3. Company Financials
- 12.1.10.4. SWOT Analysis
- 12.1.11 Shanghai Shanshan Technology Co Ltd
- 12.1.11.1. Company Overview
- 12.1.11.2. Products
- 12.1.11.3. Company Financials
- 12.1.11.4. SWOT Analysis
- 12.1.12 Syrah Resources Limited
- 12.1.12.1. Company Overview
- 12.1.12.2. Products
- 12.1.12.3. Company Financials
- 12.1.12.4. SWOT Analysis
- 12.1.13 Shenzhen Xiangfenghua Technology Co Ltd
- 12.1.13.1. Company Overview
- 12.1.13.2. Products
- 12.1.13.3. Company Financials
- 12.1.13.4. SWOT Analysis
- 12.1.14 Nippon Kokuen Group
- 12.1.14.1. Company Overview
- 12.1.14.2. Products
- 12.1.14.3. Company Financials
- 12.1.14.4. SWOT Analysis
- 12.1.1 SGL Carbon
- 12.2. Market Entropy
- 12.2.1 Company's Key Areas Served
- 12.2.2 Recent Developments
- 12.3. Company Market Share Analysis 2025
- 12.3.1 Top 5 Companies Market Share Analysis
- 12.3.2 Top 3 Companies Market Share Analysis
- 12.4. List of Potential Customers
- 13. Research Methodology
List of Figures
- Figure 1: Global Graphite Market Revenue Breakdown (billion, %) by Region 2025 & 2033
- Figure 2: Global Graphite Market Volume Breakdown (K Tons, %) by Region 2025 & 2033
- Figure 3: Asia Pacific Graphite Market Revenue (billion), by Type 2025 & 2033
- Figure 4: Asia Pacific Graphite Market Volume (K Tons), by Type 2025 & 2033
- Figure 5: Asia Pacific Graphite Market Revenue Share (%), by Type 2025 & 2033
- Figure 6: Asia Pacific Graphite Market Volume Share (%), by Type 2025 & 2033
- Figure 7: Asia Pacific Graphite Market Revenue (billion), by Application 2025 & 2033
- Figure 8: Asia Pacific Graphite Market Volume (K Tons), by Application 2025 & 2033
- Figure 9: Asia Pacific Graphite Market Revenue Share (%), by Application 2025 & 2033
- Figure 10: Asia Pacific Graphite Market Volume Share (%), by Application 2025 & 2033
- Figure 11: Asia Pacific Graphite Market Revenue (billion), by End-user Industry 2025 & 2033
- Figure 12: Asia Pacific Graphite Market Volume (K Tons), by End-user Industry 2025 & 2033
- Figure 13: Asia Pacific Graphite Market Revenue Share (%), by End-user Industry 2025 & 2033
- Figure 14: Asia Pacific Graphite Market Volume Share (%), by End-user Industry 2025 & 2033
- Figure 15: Asia Pacific Graphite Market Revenue (billion), by Country 2025 & 2033
- Figure 16: Asia Pacific Graphite Market Volume (K Tons), by Country 2025 & 2033
- Figure 17: Asia Pacific Graphite Market Revenue Share (%), by Country 2025 & 2033
- Figure 18: Asia Pacific Graphite Market Volume Share (%), by Country 2025 & 2033
- Figure 19: North America Graphite Market Revenue (billion), by Type 2025 & 2033
- Figure 20: North America Graphite Market Volume (K Tons), by Type 2025 & 2033
- Figure 21: North America Graphite Market Revenue Share (%), by Type 2025 & 2033
- Figure 22: North America Graphite Market Volume Share (%), by Type 2025 & 2033
- Figure 23: North America Graphite Market Revenue (billion), by Application 2025 & 2033
- Figure 24: North America Graphite Market Volume (K Tons), by Application 2025 & 2033
- Figure 25: North America Graphite Market Revenue Share (%), by Application 2025 & 2033
- Figure 26: North America Graphite Market Volume Share (%), by Application 2025 & 2033
- Figure 27: North America Graphite Market Revenue (billion), by End-user Industry 2025 & 2033
- Figure 28: North America Graphite Market Volume (K Tons), by End-user Industry 2025 & 2033
- Figure 29: North America Graphite Market Revenue Share (%), by End-user Industry 2025 & 2033
- Figure 30: North America Graphite Market Volume Share (%), by End-user Industry 2025 & 2033
- Figure 31: North America Graphite Market Revenue (billion), by Country 2025 & 2033
- Figure 32: North America Graphite Market Volume (K Tons), by Country 2025 & 2033
- Figure 33: North America Graphite Market Revenue Share (%), by Country 2025 & 2033
- Figure 34: North America Graphite Market Volume Share (%), by Country 2025 & 2033
- Figure 35: Europe Graphite Market Revenue (billion), by Type 2025 & 2033
- Figure 36: Europe Graphite Market Volume (K Tons), by Type 2025 & 2033
- Figure 37: Europe Graphite Market Revenue Share (%), by Type 2025 & 2033
- Figure 38: Europe Graphite Market Volume Share (%), by Type 2025 & 2033
- Figure 39: Europe Graphite Market Revenue (billion), by Application 2025 & 2033
- Figure 40: Europe Graphite Market Volume (K Tons), by Application 2025 & 2033
- Figure 41: Europe Graphite Market Revenue Share (%), by Application 2025 & 2033
- Figure 42: Europe Graphite Market Volume Share (%), by Application 2025 & 2033
- Figure 43: Europe Graphite Market Revenue (billion), by End-user Industry 2025 & 2033
- Figure 44: Europe Graphite Market Volume (K Tons), by End-user Industry 2025 & 2033
- Figure 45: Europe Graphite Market Revenue Share (%), by End-user Industry 2025 & 2033
- Figure 46: Europe Graphite Market Volume Share (%), by End-user Industry 2025 & 2033
- Figure 47: Europe Graphite Market Revenue (billion), by Country 2025 & 2033
- Figure 48: Europe Graphite Market Volume (K Tons), by Country 2025 & 2033
- Figure 49: Europe Graphite Market Revenue Share (%), by Country 2025 & 2033
- Figure 50: Europe Graphite Market Volume Share (%), by Country 2025 & 2033
- Figure 51: South America Graphite Market Revenue (billion), by Type 2025 & 2033
- Figure 52: South America Graphite Market Volume (K Tons), by Type 2025 & 2033
- Figure 53: South America Graphite Market Revenue Share (%), by Type 2025 & 2033
- Figure 54: South America Graphite Market Volume Share (%), by Type 2025 & 2033
- Figure 55: South America Graphite Market Revenue (billion), by Application 2025 & 2033
- Figure 56: South America Graphite Market Volume (K Tons), by Application 2025 & 2033
- Figure 57: South America Graphite Market Revenue Share (%), by Application 2025 & 2033
- Figure 58: South America Graphite Market Volume Share (%), by Application 2025 & 2033
- Figure 59: South America Graphite Market Revenue (billion), by End-user Industry 2025 & 2033
- Figure 60: South America Graphite Market Volume (K Tons), by End-user Industry 2025 & 2033
- Figure 61: South America Graphite Market Revenue Share (%), by End-user Industry 2025 & 2033
- Figure 62: South America Graphite Market Volume Share (%), by End-user Industry 2025 & 2033
- Figure 63: South America Graphite Market Revenue (billion), by Country 2025 & 2033
- Figure 64: South America Graphite Market Volume (K Tons), by Country 2025 & 2033
- Figure 65: South America Graphite Market Revenue Share (%), by Country 2025 & 2033
- Figure 66: South America Graphite Market Volume Share (%), by Country 2025 & 2033
- Figure 67: Middle East and Africa Graphite Market Revenue (billion), by Type 2025 & 2033
- Figure 68: Middle East and Africa Graphite Market Volume (K Tons), by Type 2025 & 2033
- Figure 69: Middle East and Africa Graphite Market Revenue Share (%), by Type 2025 & 2033
- Figure 70: Middle East and Africa Graphite Market Volume Share (%), by Type 2025 & 2033
- Figure 71: Middle East and Africa Graphite Market Revenue (billion), by Application 2025 & 2033
- Figure 72: Middle East and Africa Graphite Market Volume (K Tons), by Application 2025 & 2033
- Figure 73: Middle East and Africa Graphite Market Revenue Share (%), by Application 2025 & 2033
- Figure 74: Middle East and Africa Graphite Market Volume Share (%), by Application 2025 & 2033
- Figure 75: Middle East and Africa Graphite Market Revenue (billion), by End-user Industry 2025 & 2033
- Figure 76: Middle East and Africa Graphite Market Volume (K Tons), by End-user Industry 2025 & 2033
- Figure 77: Middle East and Africa Graphite Market Revenue Share (%), by End-user Industry 2025 & 2033
- Figure 78: Middle East and Africa Graphite Market Volume Share (%), by End-user Industry 2025 & 2033
- Figure 79: Middle East and Africa Graphite Market Revenue (billion), by Country 2025 & 2033
- Figure 80: Middle East and Africa Graphite Market Volume (K Tons), by Country 2025 & 2033
- Figure 81: Middle East and Africa Graphite Market Revenue Share (%), by Country 2025 & 2033
- Figure 82: Middle East and Africa Graphite Market Volume Share (%), by Country 2025 & 2033
List of Tables
- Table 1: Global Graphite Market Revenue billion Forecast, by Type 2020 & 2033
- Table 2: Global Graphite Market Volume K Tons Forecast, by Type 2020 & 2033
- Table 3: Global Graphite Market Revenue billion Forecast, by Application 2020 & 2033
- Table 4: Global Graphite Market Volume K Tons Forecast, by Application 2020 & 2033
- Table 5: Global Graphite Market Revenue billion Forecast, by End-user Industry 2020 & 2033
- Table 6: Global Graphite Market Volume K Tons Forecast, by End-user Industry 2020 & 2033
- Table 7: Global Graphite Market Revenue billion Forecast, by Region 2020 & 2033
- Table 8: Global Graphite Market Volume K Tons Forecast, by Region 2020 & 2033
- Table 9: Global Graphite Market Revenue billion Forecast, by Type 2020 & 2033
- Table 10: Global Graphite Market Volume K Tons Forecast, by Type 2020 & 2033
- Table 11: Global Graphite Market Revenue billion Forecast, by Application 2020 & 2033
- Table 12: Global Graphite Market Volume K Tons Forecast, by Application 2020 & 2033
- Table 13: Global Graphite Market Revenue billion Forecast, by End-user Industry 2020 & 2033
- Table 14: Global Graphite Market Volume K Tons Forecast, by End-user Industry 2020 & 2033
- Table 15: Global Graphite Market Revenue billion Forecast, by Country 2020 & 2033
- Table 16: Global Graphite Market Volume K Tons Forecast, by Country 2020 & 2033
- Table 17: China Graphite Market Revenue (billion) Forecast, by Application 2020 & 2033
- Table 18: China Graphite Market Volume (K Tons) Forecast, by Application 2020 & 2033
- Table 19: India Graphite Market Revenue (billion) Forecast, by Application 2020 & 2033
- Table 20: India Graphite Market Volume (K Tons) Forecast, by Application 2020 & 2033
- Table 21: Japan Graphite Market Revenue (billion) Forecast, by Application 2020 & 2033
- Table 22: Japan Graphite Market Volume (K Tons) Forecast, by Application 2020 & 2033
- Table 23: South Korea Graphite Market Revenue (billion) Forecast, by Application 2020 & 2033
- Table 24: South Korea Graphite Market Volume (K Tons) Forecast, by Application 2020 & 2033
- Table 25: Rest of Asia Pacific Graphite Market Revenue (billion) Forecast, by Application 2020 & 2033
- Table 26: Rest of Asia Pacific Graphite Market Volume (K Tons) Forecast, by Application 2020 & 2033
- Table 27: Global Graphite Market Revenue billion Forecast, by Type 2020 & 2033
- Table 28: Global Graphite Market Volume K Tons Forecast, by Type 2020 & 2033
- Table 29: Global Graphite Market Revenue billion Forecast, by Application 2020 & 2033
- Table 30: Global Graphite Market Volume K Tons Forecast, by Application 2020 & 2033
- Table 31: Global Graphite Market Revenue billion Forecast, by End-user Industry 2020 & 2033
- Table 32: Global Graphite Market Volume K Tons Forecast, by End-user Industry 2020 & 2033
- Table 33: Global Graphite Market Revenue billion Forecast, by Country 2020 & 2033
- Table 34: Global Graphite Market Volume K Tons Forecast, by Country 2020 & 2033
- Table 35: United States Graphite Market Revenue (billion) Forecast, by Application 2020 & 2033
- Table 36: United States Graphite Market Volume (K Tons) Forecast, by Application 2020 & 2033
- Table 37: Canada Graphite Market Revenue (billion) Forecast, by Application 2020 & 2033
- Table 38: Canada Graphite Market Volume (K Tons) Forecast, by Application 2020 & 2033
- Table 39: Mexico Graphite Market Revenue (billion) Forecast, by Application 2020 & 2033
- Table 40: Mexico Graphite Market Volume (K Tons) Forecast, by Application 2020 & 2033
- Table 41: Global Graphite Market Revenue billion Forecast, by Type 2020 & 2033
- Table 42: Global Graphite Market Volume K Tons Forecast, by Type 2020 & 2033
- Table 43: Global Graphite Market Revenue billion Forecast, by Application 2020 & 2033
- Table 44: Global Graphite Market Volume K Tons Forecast, by Application 2020 & 2033
- Table 45: Global Graphite Market Revenue billion Forecast, by End-user Industry 2020 & 2033
- Table 46: Global Graphite Market Volume K Tons Forecast, by End-user Industry 2020 & 2033
- Table 47: Global Graphite Market Revenue billion Forecast, by Country 2020 & 2033
- Table 48: Global Graphite Market Volume K Tons Forecast, by Country 2020 & 2033
- Table 49: Germany Graphite Market Revenue (billion) Forecast, by Application 2020 & 2033
- Table 50: Germany Graphite Market Volume (K Tons) Forecast, by Application 2020 & 2033
- Table 51: United Kingdom Graphite Market Revenue (billion) Forecast, by Application 2020 & 2033
- Table 52: United Kingdom Graphite Market Volume (K Tons) Forecast, by Application 2020 & 2033
- Table 53: Italy Graphite Market Revenue (billion) Forecast, by Application 2020 & 2033
- Table 54: Italy Graphite Market Volume (K Tons) Forecast, by Application 2020 & 2033
- Table 55: France Graphite Market Revenue (billion) Forecast, by Application 2020 & 2033
- Table 56: France Graphite Market Volume (K Tons) Forecast, by Application 2020 & 2033
- Table 57: Russia Graphite Market Revenue (billion) Forecast, by Application 2020 & 2033
- Table 58: Russia Graphite Market Volume (K Tons) Forecast, by Application 2020 & 2033
- Table 59: Rest of Europe Graphite Market Revenue (billion) Forecast, by Application 2020 & 2033
- Table 60: Rest of Europe Graphite Market Volume (K Tons) Forecast, by Application 2020 & 2033
- Table 61: Global Graphite Market Revenue billion Forecast, by Type 2020 & 2033
- Table 62: Global Graphite Market Volume K Tons Forecast, by Type 2020 & 2033
- Table 63: Global Graphite Market Revenue billion Forecast, by Application 2020 & 2033
- Table 64: Global Graphite Market Volume K Tons Forecast, by Application 2020 & 2033
- Table 65: Global Graphite Market Revenue billion Forecast, by End-user Industry 2020 & 2033
- Table 66: Global Graphite Market Volume K Tons Forecast, by End-user Industry 2020 & 2033
- Table 67: Global Graphite Market Revenue billion Forecast, by Country 2020 & 2033
- Table 68: Global Graphite Market Volume K Tons Forecast, by Country 2020 & 2033
- Table 69: Brazil Graphite Market Revenue (billion) Forecast, by Application 2020 & 2033
- Table 70: Brazil Graphite Market Volume (K Tons) Forecast, by Application 2020 & 2033
- Table 71: Argentina Graphite Market Revenue (billion) Forecast, by Application 2020 & 2033
- Table 72: Argentina Graphite Market Volume (K Tons) Forecast, by Application 2020 & 2033
- Table 73: Rest of South America Graphite Market Revenue (billion) Forecast, by Application 2020 & 2033
- Table 74: Rest of South America Graphite Market Volume (K Tons) Forecast, by Application 2020 & 2033
- Table 75: Global Graphite Market Revenue billion Forecast, by Type 2020 & 2033
- Table 76: Global Graphite Market Volume K Tons Forecast, by Type 2020 & 2033
- Table 77: Global Graphite Market Revenue billion Forecast, by Application 2020 & 2033
- Table 78: Global Graphite Market Volume K Tons Forecast, by Application 2020 & 2033
- Table 79: Global Graphite Market Revenue billion Forecast, by End-user Industry 2020 & 2033
- Table 80: Global Graphite Market Volume K Tons Forecast, by End-user Industry 2020 & 2033
- Table 81: Global Graphite Market Revenue billion Forecast, by Country 2020 & 2033
- Table 82: Global Graphite Market Volume K Tons Forecast, by Country 2020 & 2033
- Table 83: Saudi Arabia Graphite Market Revenue (billion) Forecast, by Application 2020 & 2033
- Table 84: Saudi Arabia Graphite Market Volume (K Tons) Forecast, by Application 2020 & 2033
- Table 85: South Africa Graphite Market Revenue (billion) Forecast, by Application 2020 & 2033
- Table 86: South Africa Graphite Market Volume (K Tons) Forecast, by Application 2020 & 2033
- Table 87: Rest of Middle East and Africa Graphite Market Revenue (billion) Forecast, by Application 2020 & 2033
- Table 88: Rest of Middle East and Africa Graphite Market Volume (K Tons) Forecast, by Application 2020 & 2033
Frequently Asked Questions
1. What is the projected Compound Annual Growth Rate (CAGR) of the Graphite Market?
The projected CAGR is approximately 8.42%.
2. Which companies are prominent players in the Graphite Market?
Key companies in the market include SGL Carbon, Showa Denko K k, Asbury Carbons, Tokai Carbon Co Ltd, Northern Graphite Corp, Mason Graphite Inc, Triton Minerals, BTR New Material Group Co Ltd, Jiangxi Zichen Technology Co Ltd, Imerys, Shanghai Shanshan Technology Co Ltd, Syrah Resources Limited, Shenzhen Xiangfenghua Technology Co Ltd, Nippon Kokuen Group.
3. What are the main segments of the Graphite Market?
The market segments include Type, Application, End-user Industry.
4. Can you provide details about the market size?
The market size is estimated to be USD 31.59 billion as of 2022.
5. What are some drivers contributing to market growth?
Augmenting Demand from the Burgeoning Lithium-ion Battery Industry; Increase In Steel Production in Asia and the Middle East.
6. What are the notable trends driving market growth?
The Metallurgy Segment is Expected to Dominate the Market.
7. Are there any restraints impacting market growth?
Stringent Environmental Regulations; Other Restraints.
8. Can you provide examples of recent developments in the market?
October 2022: Syrah Resources Ltd. announced it would supply a key lithium-ion battery component to South Korea's LG Energy Solution Ltd. According to the agreement, the company was to provide 2 kilotons per annum of graphite to LG Energy Solution Ltd. active anode material (AAM) from 2025 and increase it to at least 10 ktpa after its production capacity at its Vidalia facility in Louisiana.
9. What pricing options are available for accessing the report?
Pricing options include single-user, multi-user, and enterprise licenses priced at USD 4750, USD 5250, and USD 8750 respectively.
10. Is the market size provided in terms of value or volume?
The market size is provided in terms of value, measured in billion and volume, measured in K Tons.
11. Are there any specific market keywords associated with the report?
Yes, the market keyword associated with the report is "Graphite Market," which aids in identifying and referencing the specific market segment covered.
12. How do I determine which pricing option suits my needs best?
The pricing options vary based on user requirements and access needs. Individual users may opt for single-user licenses, while businesses requiring broader access may choose multi-user or enterprise licenses for cost-effective access to the report.
13. Are there any additional resources or data provided in the Graphite Market report?
While the report offers comprehensive insights, it's advisable to review the specific contents or supplementary materials provided to ascertain if additional resources or data are available.
14. How can I stay updated on further developments or reports in the Graphite Market?
To stay informed about further developments, trends, and reports in the Graphite Market, consider subscribing to industry newsletters, following relevant companies and organizations, or regularly checking reputable industry news sources and publications.
Methodology
Step 1 - Identification of Relevant Samples Size from Population Database


Step 2 - Approaches for Defining Global Market Size (Value, Volume* & Price*)

Note*: In applicable scenarios
Step 3 - Data Sources
Primary Research
- Web Analytics
- Survey Reports
- Research Institute
- Latest Research Reports
- Opinion Leaders
Secondary Research
- Annual Reports
- White Paper
- Latest Press Release
- Industry Association
- Paid Database
- Investor Presentations

Step 4 - Data Triangulation
Involves using different sources of information in order to increase the validity of a study
These sources are likely to be stakeholders in a program - participants, other researchers, program staff, other community members, and so on.
Then we put all data in single framework & apply various statistical tools to find out the dynamic on the market.
During the analysis stage, feedback from the stakeholder groups would be compared to determine areas of agreement as well as areas of divergence

